植物生态学报 ›› 2005, Vol. 29 ›› Issue (2): 197-201.DOI: 10.17521/cjpe.2005.0025

• 论文 • 上一篇    下一篇

数字高程模型在群落内物种共存研究中的应用——以神农架米心水青冈-曼青冈群落的地形模型建立为例

张谧1,2, 熊高明1, 陈志刚1, 樊大勇1, 谢宗强1,*()   

  1. 1 中国科学院植物研究所植被数量生态学重点实验室,北京100093
    2 中国科学院研究生院,北京100039
  • 收稿日期:2004-02-22 接受日期:2004-06-21 出版日期:2005-02-22 发布日期:2005-03-10
  • 通讯作者: 谢宗强
  • 作者简介:*E-mail:xie@ibcas.ac.cn
  • 基金资助:
    中国科学院知识创新研究课题(KSCX2-SW-109);国务院三峡建设委员会研究课题(SX2001-025);国务院三峡建设委员会研究课题(SX2001-003)

THE APPLICATION OF DIGITAL ELEVATION MODELS IN COMMUNITY BIODIVERSITY RESEARCH WITH AN EXAMPLE FROM A FAGUS ENGLERIANA-CYCLOBALANOPSIS OXYODON COMMUNITY IN SHENNONGJIA AREA

ZHANG Mi1,2, XIONG Gao-Ming1, CHEN Zhi-Gang1, FAN Da-Yong1, XIE Zong-Qiang1,*()   

  1. 1 Laboratory of Quantitative Vegetation Ecology, Institute of Botany, Chinese Academy of Sciences, Beijing 100093, China
    2 Graduate School of Chinese Academy of Sciences,Beijing 100039, China
  • Received:2004-02-22 Accepted:2004-06-21 Online:2005-02-22 Published:2005-03-10
  • Contact: XIE Zong-Qiang

摘要:

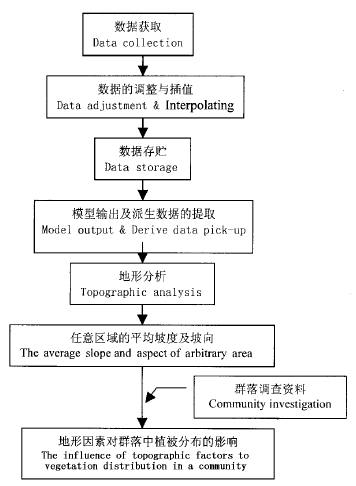
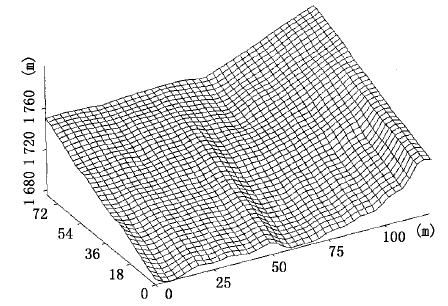
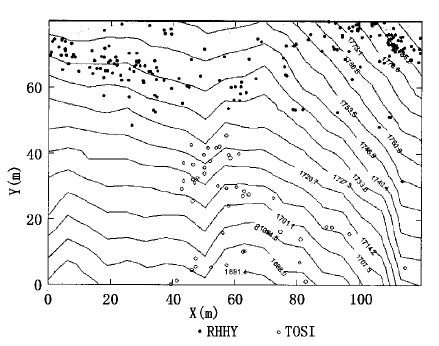
地形是环境异质性产生的原因之一。受技术条件的限制, 以往研究中地形因子只能作为背景因子介入, 无法分析地形的细微变化对植物分布格局的影响。该文将数字高程模型引入群落内物种多样性研究, 以神农架米心水青冈 (Fagusengleriana) 青 冈 (Cyclobalanopsisoxyodon) 群落固定样地的地形分析为例, 介绍DEM的建立及地形因素的提取。摸拟 0.96hm2 样地的地形变化, 发现样地总坡向为西偏北 30°, 总坡度为 4 0.0 1°, 最大坡度为74.6°, 最小坡度为 18.2°, DEM的精度为 0.4m。选择群落中 2 4种植物与坡度、坡向及坡位等地形因素进行相关分析, 发现不同的种对地形变化的反应不同。该次研究中, DEM量化了地形数据, 使之可以参与到生物多样性研究中, 为在连续面上分析地形因素对群落内植物分布的影响提供了极大的便利。DEM在小尺度中应用的主要问题是原数据的采集, 该次研究中的地形数据为人工野外测量, 研究规模受到一定限制。

关键词: 坡度, 坡向, DEM, 神农架

Abstract:

Topography is a primary factor that creates microenvironmental heterogeneity in a landscape. In previous studies, topographic factors, such as slope and aspect, were measured as discrete data and had limited use in analyses. In this paper, a digital elevation model (DEM) was used to analyze the influence of topographic heterogeneity on the distribution patterns of woody plants at the community level by calculating digital topographic values and creating a digital description of the landform. The establishment of a DEM can be generalized in three steps: 1) gathering the topographic data; 2) data adjustment & interpolation; and 3) displaying the data. To illustrate this process, a DEM was built based on a 0.96 hm 2 permanent forest plot in the Shennongjia area (31°19′4″ N, 110°29′44″ E). The forest was dominated by Fagus engleriana and Cyclobalanopsis oxyodon. Topographic data were gathered when the plot was established. A total of 425 sample points were mapped by elevation. An inverse distance weighted method was used to interpolate data between points. Using Arcview GIS software, the slope and aspect of all 425 points within the plot were calculated. The slope varied from 18.2 to 74.6 degrees in the 0.96 hm 2 plot. The precision of the DEM was 0.4 m. Using the DEM, the slope and aspect of every point within the permanent plot were calculated and these topographic factors were then used to analyze species distribution patterns. Twenty-four species were chosen to calculate their correlations with slope, aspect and position. The positive and negative correlations with the slope, aspect and position were 7, 7, 6, 3, and 8, 5 respectively. One problem of using a DEM at small scales is related to the difficulties associated with the collection of the original data. Under the forest canopy, it was difficult to gather topographic data using GPS, remote pictures or other automated tools. To achieve the required precision, all topographic data were acquired using a compass, which limited the scale at which the analysis could be conducted. Although improvements are needed in this method, the DEM provided a lot of information and was a convenient method for analyzing species distributions in relation to topographic factors. Because remote sensing cannot provide a detailed description of species distributions within forest communities, such research should be combined with the establishment of permanent plots.

Key words: Slope, Aspect, DEM, Species distribution, Shennongjia