
植物生态学报 ›› 2005, Vol. 29 ›› Issue (2): 266-273.DOI: 10.17521/cjpe.2005.0034
张立桢1,2, 曹卫星1,*( ), 张思平2, 周治国1
收稿日期:2003-09-22
接受日期:2004-08-11
出版日期:2005-09-22
发布日期:2005-03-10
通讯作者:
曹卫星
作者简介:*E-mail:caow@njau.edu.cn基金资助:
ZHANG Li-Zhen1,2, CAO Wei-Xing1,*(), ZHANG Si-Ping2, ZHOU Zhi-Guo1
Received:2003-09-22
Accepted:2004-08-11
Online:2005-09-22
Published:2005-03-10
Contact:
CAO Wei-Xing
摘要:
结合田间根钻取样和图像扫描分析方法, 研究了不同棉花品种根系的长度、直径和表面积动态及 0~ 10 0cm深和 0~ 4 0cm宽土壤范围内的空间分布特征。该方法与常规直尺测量结果相比相关系数R2 达到 0.899 (n =1318), 显示了较好的可靠性。研究结果表明, 棉花平均根长密度 (RLD) 在花铃期为 1.2 1~ 1.2 7mm·cm-3, 吐絮后降至 1.0 4~ 1.12mm·cm-3, 收花时为 0.76mm·cm-3 。棉花根平均直径在不同基因型间存在显著差异, 抗虫杂交棉的根直径最粗, 平均为 0.5 2mm ;早熟类型品种根直径较细, 平均为 0.36mm。在土壤深度上根直径的差异不显著, 但距棉行距离越远, 根的平均直径越小。在明确根系长度和直径动态规律的基础上, 提出了根表面积指数 (RAI) 的概念, 与地上部叶面积指数具有相似的含义和生物学意义, 且呈较好的指数相关关系 (R2 =0.779) 。RAI在生理发育时间 (PDT) 小于等于 4 0前, 其增长动态符合LOGISTIC生长规律 (R2 =0.84 9), 在PDT大于 4 0后, 呈线性递减趋势 (R2 =0.5 70~ 0.895 ), 且杂交抗虫棉的RAI在全生育期内均明显高于其它类型品种, 而早熟类型品种相对略低。RAI空间分布特征表现为, 开花前在浅根层内 (0~ 30cm) 分布最多, 花铃期以中层根系 (40~ 6 0cm) 为主, 吐絮后主要以深层 (70~ 10 0cm) 和距棉行较远的行间较多。研究结果为制定合理的施肥、灌溉措施提供了理论依据, 并量化了棉花根系的时空变化, 为进一步提高生长发育模拟模型的精度奠定了基础。
张立桢, 曹卫星, 张思平, 周治国. 棉花根系生长和空间分布特征. 植物生态学报, 2005, 29(2): 266-273. DOI: 10.17521/cjpe.2005.0034
ZHANG Li-Zhen, CAO Wei-Xing, ZHANG Si-Ping, ZHOU Zhi-Guo. CHARACTERIZING ROOT GROWTH AND SPATIAL DISTRIBUTION IN COTTON. Chinese Journal of Plant Ecology, 2005, 29(2): 266-273. DOI: 10.17521/cjpe.2005.0034
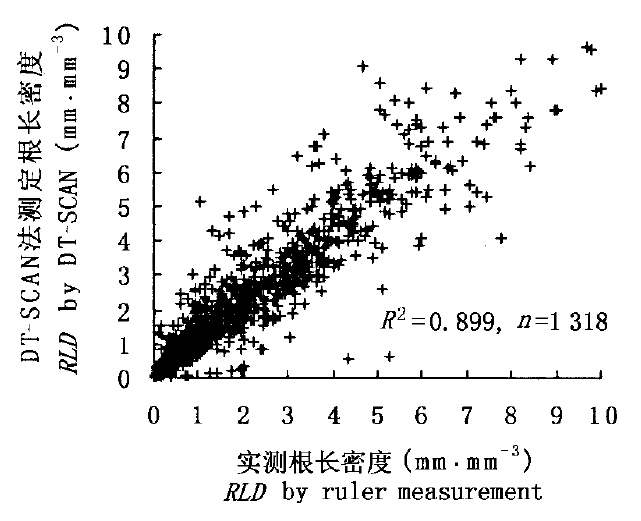
图1 实测法与图像分析法测定棉花根长密度的结果比较
Fig.1 The comparison of root length density (RLD) measurements by ruler measerment method with image analysis method
| 水平位置 Placement | 日/月 Day/month | ||||||
|---|---|---|---|---|---|---|---|
| 15/7 | 29/7 | 13/8 | 27/8 | 10/9 | 24/9 | 8/10 | |
| D0 | 1.67 | 1.86 | 2.07 | 1.84 | 1.07 | 1.32 | 0.96a |
| D15 | 1.19 | 1.23 | 1.03 | 0.99 | 0.88 | 1.30 | 0.80b |
| D25 | 1.34 | 0.86 | 0.97 | 0.87 | 1.09 | 0.99 | 0.61b |
| D35 | 0.84 | 1.01 | 1.03 | 1.13 | 1.12 | 0.86 | 0.65b |
表1 根长密度在水平位置上的变化动态(mm·cm-3)
Table 1 Dynamic changes of RLD at different horizontal placements (mm·cm-3)
| 水平位置 Placement | 日/月 Day/month | ||||||
|---|---|---|---|---|---|---|---|
| 15/7 | 29/7 | 13/8 | 27/8 | 10/9 | 24/9 | 8/10 | |
| D0 | 1.67 | 1.86 | 2.07 | 1.84 | 1.07 | 1.32 | 0.96a |
| D15 | 1.19 | 1.23 | 1.03 | 0.99 | 0.88 | 1.30 | 0.80b |
| D25 | 1.34 | 0.86 | 0.97 | 0.87 | 1.09 | 0.99 | 0.61b |
| D35 | 0.84 | 1.01 | 1.03 | 1.13 | 1.12 | 0.86 | 0.65b |
| 土层深度 Depth (cm) | 日/月 Day/month | ||||||
|---|---|---|---|---|---|---|---|
| 15/7 | 29/7 | 13/8 | 27/8 | 10/9 | 24/9 | 8/10 | |
| 10 | 2.99 | 3.50 | 3.25 | 2.72 | 1.70 | 1.08 | 0.89 |
| 20 | 4.93 | 2.38 | 3.24 | 2.20 | 1.91 | 1.94 | 0.95 |
| 30 | 2.73 | 1.36 | 1.57 | 1.39 | 1.33 | 1.50 | 0.78 |
| 40 | 0.93 | 0.97 | 0.94 | 1.10 | 1.13 | 0.54 | 0.58 |
| 50 | 0.38 | 1.11 | 1.18 | 0.81 | 0.71 | 1.00 | 1.07 |
| 60 | 0.14 | 0.61 | 1.03 | 0.57 | 1.12 | 1.59 | 0.69 |
| 70 | 0.13 | 0.64 | 0.23 | 0.88 | 0.71 | 0.87 | 0.96 |
| 80 | 0.28 | 0.63 | 0.12 | 0.65 | 0.52 | 0.82 | 0.66 |
| 90 | 0.06 | 0.53 | 0.25 | 0.90 | 0.53 | 0.90 | 0.60 |
| 100 | 0.07 | 0.69 | 0.97 | 0.87 | 0.75 | 0.93 | 0.40 |
表2 根长密度在深度层次上的变化动态 (mm·cm-3)
Table 2 Dynamic changes of RLD at different soil layers(mm·cm-3)
| 土层深度 Depth (cm) | 日/月 Day/month | ||||||
|---|---|---|---|---|---|---|---|
| 15/7 | 29/7 | 13/8 | 27/8 | 10/9 | 24/9 | 8/10 | |
| 10 | 2.99 | 3.50 | 3.25 | 2.72 | 1.70 | 1.08 | 0.89 |
| 20 | 4.93 | 2.38 | 3.24 | 2.20 | 1.91 | 1.94 | 0.95 |
| 30 | 2.73 | 1.36 | 1.57 | 1.39 | 1.33 | 1.50 | 0.78 |
| 40 | 0.93 | 0.97 | 0.94 | 1.10 | 1.13 | 0.54 | 0.58 |
| 50 | 0.38 | 1.11 | 1.18 | 0.81 | 0.71 | 1.00 | 1.07 |
| 60 | 0.14 | 0.61 | 1.03 | 0.57 | 1.12 | 1.59 | 0.69 |
| 70 | 0.13 | 0.64 | 0.23 | 0.88 | 0.71 | 0.87 | 0.96 |
| 80 | 0.28 | 0.63 | 0.12 | 0.65 | 0.52 | 0.82 | 0.66 |
| 90 | 0.06 | 0.53 | 0.25 | 0.90 | 0.53 | 0.90 | 0.60 |
| 100 | 0.07 | 0.69 | 0.97 | 0.87 | 0.75 | 0.93 | 0.40 |
| 品种 Cultivar | 距棉行的水平距离 Placement from cotton row | 平均 Mean* | |||
|---|---|---|---|---|---|
| 0 cm | 15 cm | 25 cm | 35 cm | ||
| `中棉所29' `CRI29' | 0.56 | 0.52 | 0.49 | 0.49 | 0.52a |
| `中棉所32' `CRI32' | 0.51 | 0.44 | 0.41 | 0.41 | 0.44b |
| `中棉所35' `CRI35' | 0.48 | 0.44 | 0.40 | 0.39 | 0.43b |
| `中棉所37' `CRI37' | 0.45 | 0.37 | 0.34 | 0.32 | 0.36c |
| 平均 Mean** | 0.50d | 0.44e | 0.41e | 0.40e | 0.43 |
表3 不同基因型和水平位置上棉花根系直径的变化 (mm)
Table 3 The changes of root diameter with different cotton genotypes and horizontal placements (mm)
| 品种 Cultivar | 距棉行的水平距离 Placement from cotton row | 平均 Mean* | |||
|---|---|---|---|---|---|
| 0 cm | 15 cm | 25 cm | 35 cm | ||
| `中棉所29' `CRI29' | 0.56 | 0.52 | 0.49 | 0.49 | 0.52a |
| `中棉所32' `CRI32' | 0.51 | 0.44 | 0.41 | 0.41 | 0.44b |
| `中棉所35' `CRI35' | 0.48 | 0.44 | 0.40 | 0.39 | 0.43b |
| `中棉所37' `CRI37' | 0.45 | 0.37 | 0.34 | 0.32 | 0.36c |
| 平均 Mean** | 0.50d | 0.44e | 0.41e | 0.40e | 0.43 |
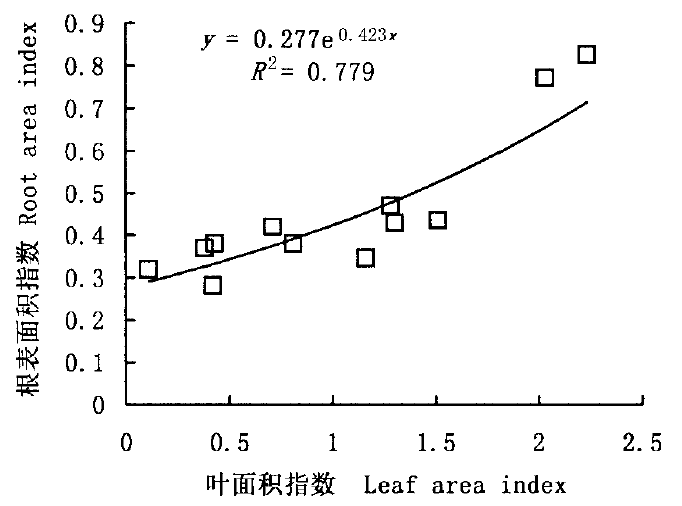
图2 棉花根表面积指数与叶面积指数的关系
Fig.2 The relationship of root area index to leaf area index in cotton
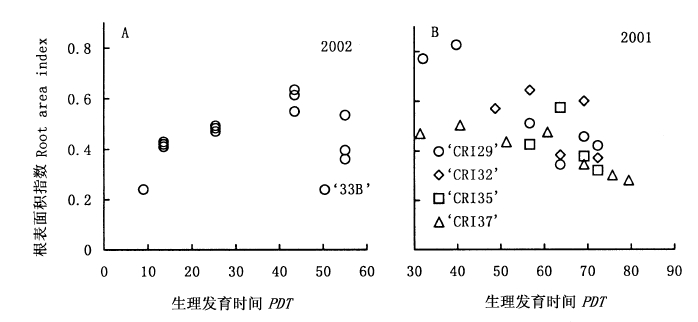
图3 不同基因型不同年份下棉花根表面积指数随生育进程的变化动态
Fig.3 The dynamic changes of root area index over physiological development time (PDT) in different cotton genotypes and growing years
| 品种 Cultivar | RAImax (cm2·cm-2) | K | Rm PDT-1 | a (cm2·cm-2) | b PDT-1 | R2* | R2** |
|---|---|---|---|---|---|---|---|
| `33B' `中棉所35' `CRI35' `中棉所32' `CRI32' | 0.621 5 | 2.033 | 0.085 5 | 0.993 0 | -0.008 0 | 0.849 | 0.570 0 |
| `中棉所29' `CRI29' | 0.900 0 | 2.110 | 0.121 1 | 1.288 0 | -0.013 0 | 0.901 | 0.895 0 |
| `中棉所37' `CRI37' | 0.501 2 | 1.980 | 0.063 4 | 0.657 6 | -0.004 4 | 0.764 | 0.760 5 |
表4 不同基因型棉花根表面积指数随PDT计算公式参数表
Table 4 The parameters of formula of RAI to PDT for different cotton genotypes
| 品种 Cultivar | RAImax (cm2·cm-2) | K | Rm PDT-1 | a (cm2·cm-2) | b PDT-1 | R2* | R2** |
|---|---|---|---|---|---|---|---|
| `33B' `中棉所35' `CRI35' `中棉所32' `CRI32' | 0.621 5 | 2.033 | 0.085 5 | 0.993 0 | -0.008 0 | 0.849 | 0.570 0 |
| `中棉所29' `CRI29' | 0.900 0 | 2.110 | 0.121 1 | 1.288 0 | -0.013 0 | 0.901 | 0.895 0 |
| `中棉所37' `CRI37' | 0.501 2 | 1.980 | 0.063 4 | 0.657 6 | -0.004 4 | 0.764 | 0.760 5 |
| [1] |
Burgess SSO, Adams MA, Turner NC, Ong CK (1998). Theredistributionofsoilwaterbytreerootsystems. Oecologia, 115,306-311.
DOI URL |
| [2] | Burke JJ, Upchurch DR (1995). Cottonrootingpatternsinre lationtosoiltemperaturesandthermalkineticwindows. A gronomyJournal, 87,1210-1216. |
| [3] | Gong YS (龚元石), Li BG (李保国) (1996). Sensibilityofthefieldwaterbudgetmodeltowaterextractionfunctionbyrootsandevapotranspirationform. ResearchofSoilandWaterConservation (水土保持研究), 3,1-7. (inChinesewithEnglishabstract). |
| [4] | Kramer PJ TranslatedbyXu XD (许旭旦), Tang ZC (汤章城), Wang WL (王万里), Lu XH (陆宪辉) (1989). Wa terRelationsofPlants (植物水分关系). SciencePress, Beijing,169~175. (inChinese). |
| [5] | Li YB (李亚兵), Zhang LZ (张立桢) (1999). TheapplicationofDT_SCANinstudyofcottonroots. ChineseCotton (中国棉花), 26,37-38. (inChinese). |
| [6] | McMichael BL (1980). Waterstressadaptation.In:HeskethJD, JonesJDeds. PredictingPhotosynthesisforEcosystemModels.CRCPress, USA,183-204. |
| [7] | McMichael BL, Upchurch DR, Burke JJ (1996). Soiltempera turederivedpredictionofrootdensityincotton. Environ mentalExperimentBotany, 36,303-312. |
| [8] | McMichael BL, Quisenberry JE (1991). Geneticvariationforroot_shootrelationshipsamongcottongermplasm. Environ mentalExperimentBotany, 31,461-470. |
| [9] | McMichael BL, Upchurch DR, Taylor HM (1992). Transparentwalltechniquesforstudyingrootgrowthandfunctioninsoil. JournalofPlantNutrition, 15,753-762. |
| [10] | Russell RS (1977). PlantRootSystems:TheirFunctionsandInteractionwithSoil. TheEnglishLanguageBookSocietyandMcGrow_HillBookCompany (UK) Limited (ELBS) Press, Maidenhead, Berkshire, England,9-27. |
| [11] | Stirzaker RJ, Passioura JB (1996). Thewaterrelationsoftheroot_soilinterface. Plant, CellandEnvironment, 19,201-208. |
| [12] | Taylor HM, Klepper B (1978). Theroleofrootingcharacteris ticinthesupplyofwatertoplants. AdvancesinAgronomy, 30,99-128. |
| [13] | Taylor HM, Upchurch DR, McMichael BL (1991). Applica tionandlimitationofrhizotronsandminirhizotronsforrootstudies. In:KeisterDL, CreganPBeds.TheRhizosphereandPlantGrowth.KluwerAcdamicPublishers, UK,91-97. |
| [14] | Taylor HM, Klepper B (1974). Waterrelationsofcotton.I.Rootgrowthandwateruseasrelatedtotopgrowthandsoilwatercontent. AgronomyJournal, 66,584-588. |
| [15] | Zhang LZ (张立桢), Cao WX (曹卫星), Zhang SP (张思平) (2003). Simulationmodelforcottondevelopmentstagesbasedonphysiologicaldevelopmenttime. CottonScience (棉花学报), 15,97-103. (inChinesewithEnglishabstract). |
| [16] | Zhang LZ (张立桢), Li YB (李亚兵), Wang GP (王桂平), Zhu QL (朱巧玲) (1998). Therootgrowth, developmentanddistributionofcottonwithvegetativebranches. ActaGossypiiSinica (棉花学报), 6,322-328. (inChinesewithEnglishabstract). |
| [1] | 冯旭飞, 雷长英, 张玉洁, 向导, 杨明凤, 张旺锋, 张亚黎. 棉花花铃期叶片氮分配对光合氮利用效率的影响[J]. 植物生态学报, 2023, 47(11): 1600-1610. |
| [2] | 高文童, 张春艳, 董廷发, 胥晓. 丛枝菌根真菌对不同性别组合模式下青杨雌雄植株根系生长的影响[J]. 植物生态学报, 2019, 43(1): 37-45. |
| [3] | 雒珺瑜, 刘传亮, 张帅, 王春义, 吕丽敏, 李春花, 李付广, 崔金杰. 转RRM2基因棉生长势和产量及对棉田节肢动物群落的影响[J]. 植物生态学报, 2014, 38(7): 785-794. |
| [4] | 张超, 占东霞, 张鹏鹏, 张亚黎, 罗宏海, 张旺锋. 棉花苞叶光呼吸和PSII热耗散对土壤水分的响应[J]. 植物生态学报, 2014, 38(4): 387-395. |
| [5] | 武辉, 戴海芳, 张巨松, 焦晓玲, 刘翠, 石俊毅, 范志超, 阿丽艳·肉孜. 棉花幼苗叶片光合特性对低温胁迫及恢复处理的响应[J]. 植物生态学报, 2014, 38(10): 1124-1134. |
| [6] | 陶先萍, 罗宏海, 杨海, 丁全盛, 张亚黎, 张旺锋. 根域限制下水氮供应对膜下滴灌棉花根系及叶片衰老特性的影响[J]. 植物生态学报, 2013, 37(3): 256-267. |
| [7] | 李维, 张亚黎, 胡渊渊, 杨美森, 吴洁, 张旺锋. 田间条件下棉花幼叶光合特性及光保护机制[J]. 植物生态学报, 2012, 36(7): 662-670. |
| [8] | 刘瑞显, 陈兵林, 王友华, 郭文琦, 周治国. 氮素对花铃期干旱再复水后棉花根系生长的影响[J]. 植物生态学报, 2009, 33(2): 405-413. |
| [9] | 张亚黎, 罗宏海, 张旺锋, 樊大勇, 何在菊, 白慧东. 土壤水分亏缺对陆地棉花铃期叶片光化学活性和激发能耗散的影响[J]. 植物生态学报, 2008, 32(3): 681-689. |
| [10] | 黄刚, 赵学勇, 苏延桂. 科尔沁沙地3种草本植物根系生长动态[J]. 植物生态学报, 2007, 31(6): 1161-1167. |
| [11] | 吴华兵, 朱艳, 田永超, 姚霞, 刘晓军, 周治国, 曹卫星. 棉花冠层高光谱参数与叶片氮含量的定量关系[J]. 植物生态学报, 2007, 31(5): 903-909. |
| [12] | 张志山, 李新荣, 张景光, 王新平, 赵金龙, 陈应武. 用Minirhizotrons观测柠条根系生长动态[J]. 植物生态学报, 2006, 30(3): 457-464. |
| [13] | 杨兴洪, 邹琦, 赵世杰. 遮荫和全光下生长的棉花光合作用和叶绿素荧光特征[J]. 植物生态学报, 2005, 29(1): 8-15. |
| [14] | 张旺锋, 王振林, 余松烈, 李少昆, 房建, 童文崧. 种植密度对新疆高产棉花群体光合作用、冠层结构及产量形成的影响[J]. 植物生态学报, 2004, 28(2): 164-171. |
| [15] | 白文明, 左强, 黄元仿, 李保国. 乌兰布和沙区紫花苜蓿根系生长及吸水规律的研究[J]. 植物生态学报, 2001, 25(1): 35-41. |
| 阅读次数 | ||||||
|
全文 |
|
|||||
|
摘要 |
|
|||||
Copyright © 2022 版权所有 《植物生态学报》编辑部
地址: 北京香山南辛村20号, 邮编: 100093
Tel.: 010-62836134, 62836138; Fax: 010-82599431; E-mail: apes@ibcas.ac.cn, cjpe@ibcas.ac.cn
备案号: 京ICP备16067583号-19