
植物生态学报 ›› 2012, Vol. 36 ›› Issue (10): 1106-1119.DOI: 10.3724/SP.J.1258.2012.01106
宋创业1,*( ), 刘慧明2, 刘高焕3, 黄翀3
收稿日期:2011-07-14
接受日期:2012-05-08
出版日期:2012-07-14
发布日期:2012-09-26
通讯作者:
宋创业
作者简介: E-mail: songcy@ibcas.ac.cn
SONG Chuang-Ye1,*(), LIU Hui-Ming2, LIU Gao-Huan3, HUANG Chong3
Received:2011-07-14
Accepted:2012-05-08
Online:2012-07-14
Published:2012-09-26
Contact:
SONG Chuang-Ye
摘要:
为了采用广义加法模型整合数字高程模型和遥感数据进行植被分布的预测, 并探索耦合环境变量和遥感数据作为预测变量是否能够有效地提高植被分布预测的精度, 选择海拔、坡度、至黄河最近距离、至海岸线最近距离, 以及从SPOT5遥感影像中提取的光谱变量作为预测变量, 采用广义加法模型整合环境变量和光谱变量, 建立植被分布预测模型。研究设置3种建模情景(以环境变量作为预测变量, 以光谱变量作为预测变量, 综合使用环境变量与光谱变量作为预测变量)对黄河三角洲的优势植被类型的分布进行了预测, 并对预测结果采用偏差分析、受试者工作特征曲线和野外采样点对比等3种方法进行了验证。结果表明: (1)基于广义加法模型的植被分布预测方法具有一定的实用性, 可以较为准确地预测植被的分布; 盖度较高的植被类型预测精度较高, 盖度较低的植被类型预测精度较低, 植物群落结构的特点是出现这些差异的主要原因; 综合使用环境变量和光谱变量作为预测变量的模型, 预测精度高于单独以环境变量或者光谱变量作为预测变量的模型。(2)环境变量、光谱变量大多被选入模型, 二者均对植被分布预测有重要的作用; 同一预测变量在不同植被类型的预测模型中的贡献不同, 这与植被的光谱、环境特征差异有关; 同一预测变量在不同的建模情景下对模型的贡献不同, 环境变量与光谱变量的耦合效应可能是导致预测变量对模型的贡献出现变化的原因。
宋创业, 刘慧明, 刘高焕, 黄翀. 采用广义加法模型整合数字高程模型和遥感数据进行植被分布预测. 植物生态学报, 2012, 36(10): 1106-1119. DOI: 10.3724/SP.J.1258.2012.01106
SONG Chuang-Ye, LIU Hui-Ming, LIU Gao-Huan, HUANG Chong. Applying generalized additive model to integrate digital elevation model and remotely sensed data to predict the vegetation distribution. Chinese Journal of Plant Ecology, 2012, 36(10): 1106-1119. DOI: 10.3724/SP.J.1258.2012.01106
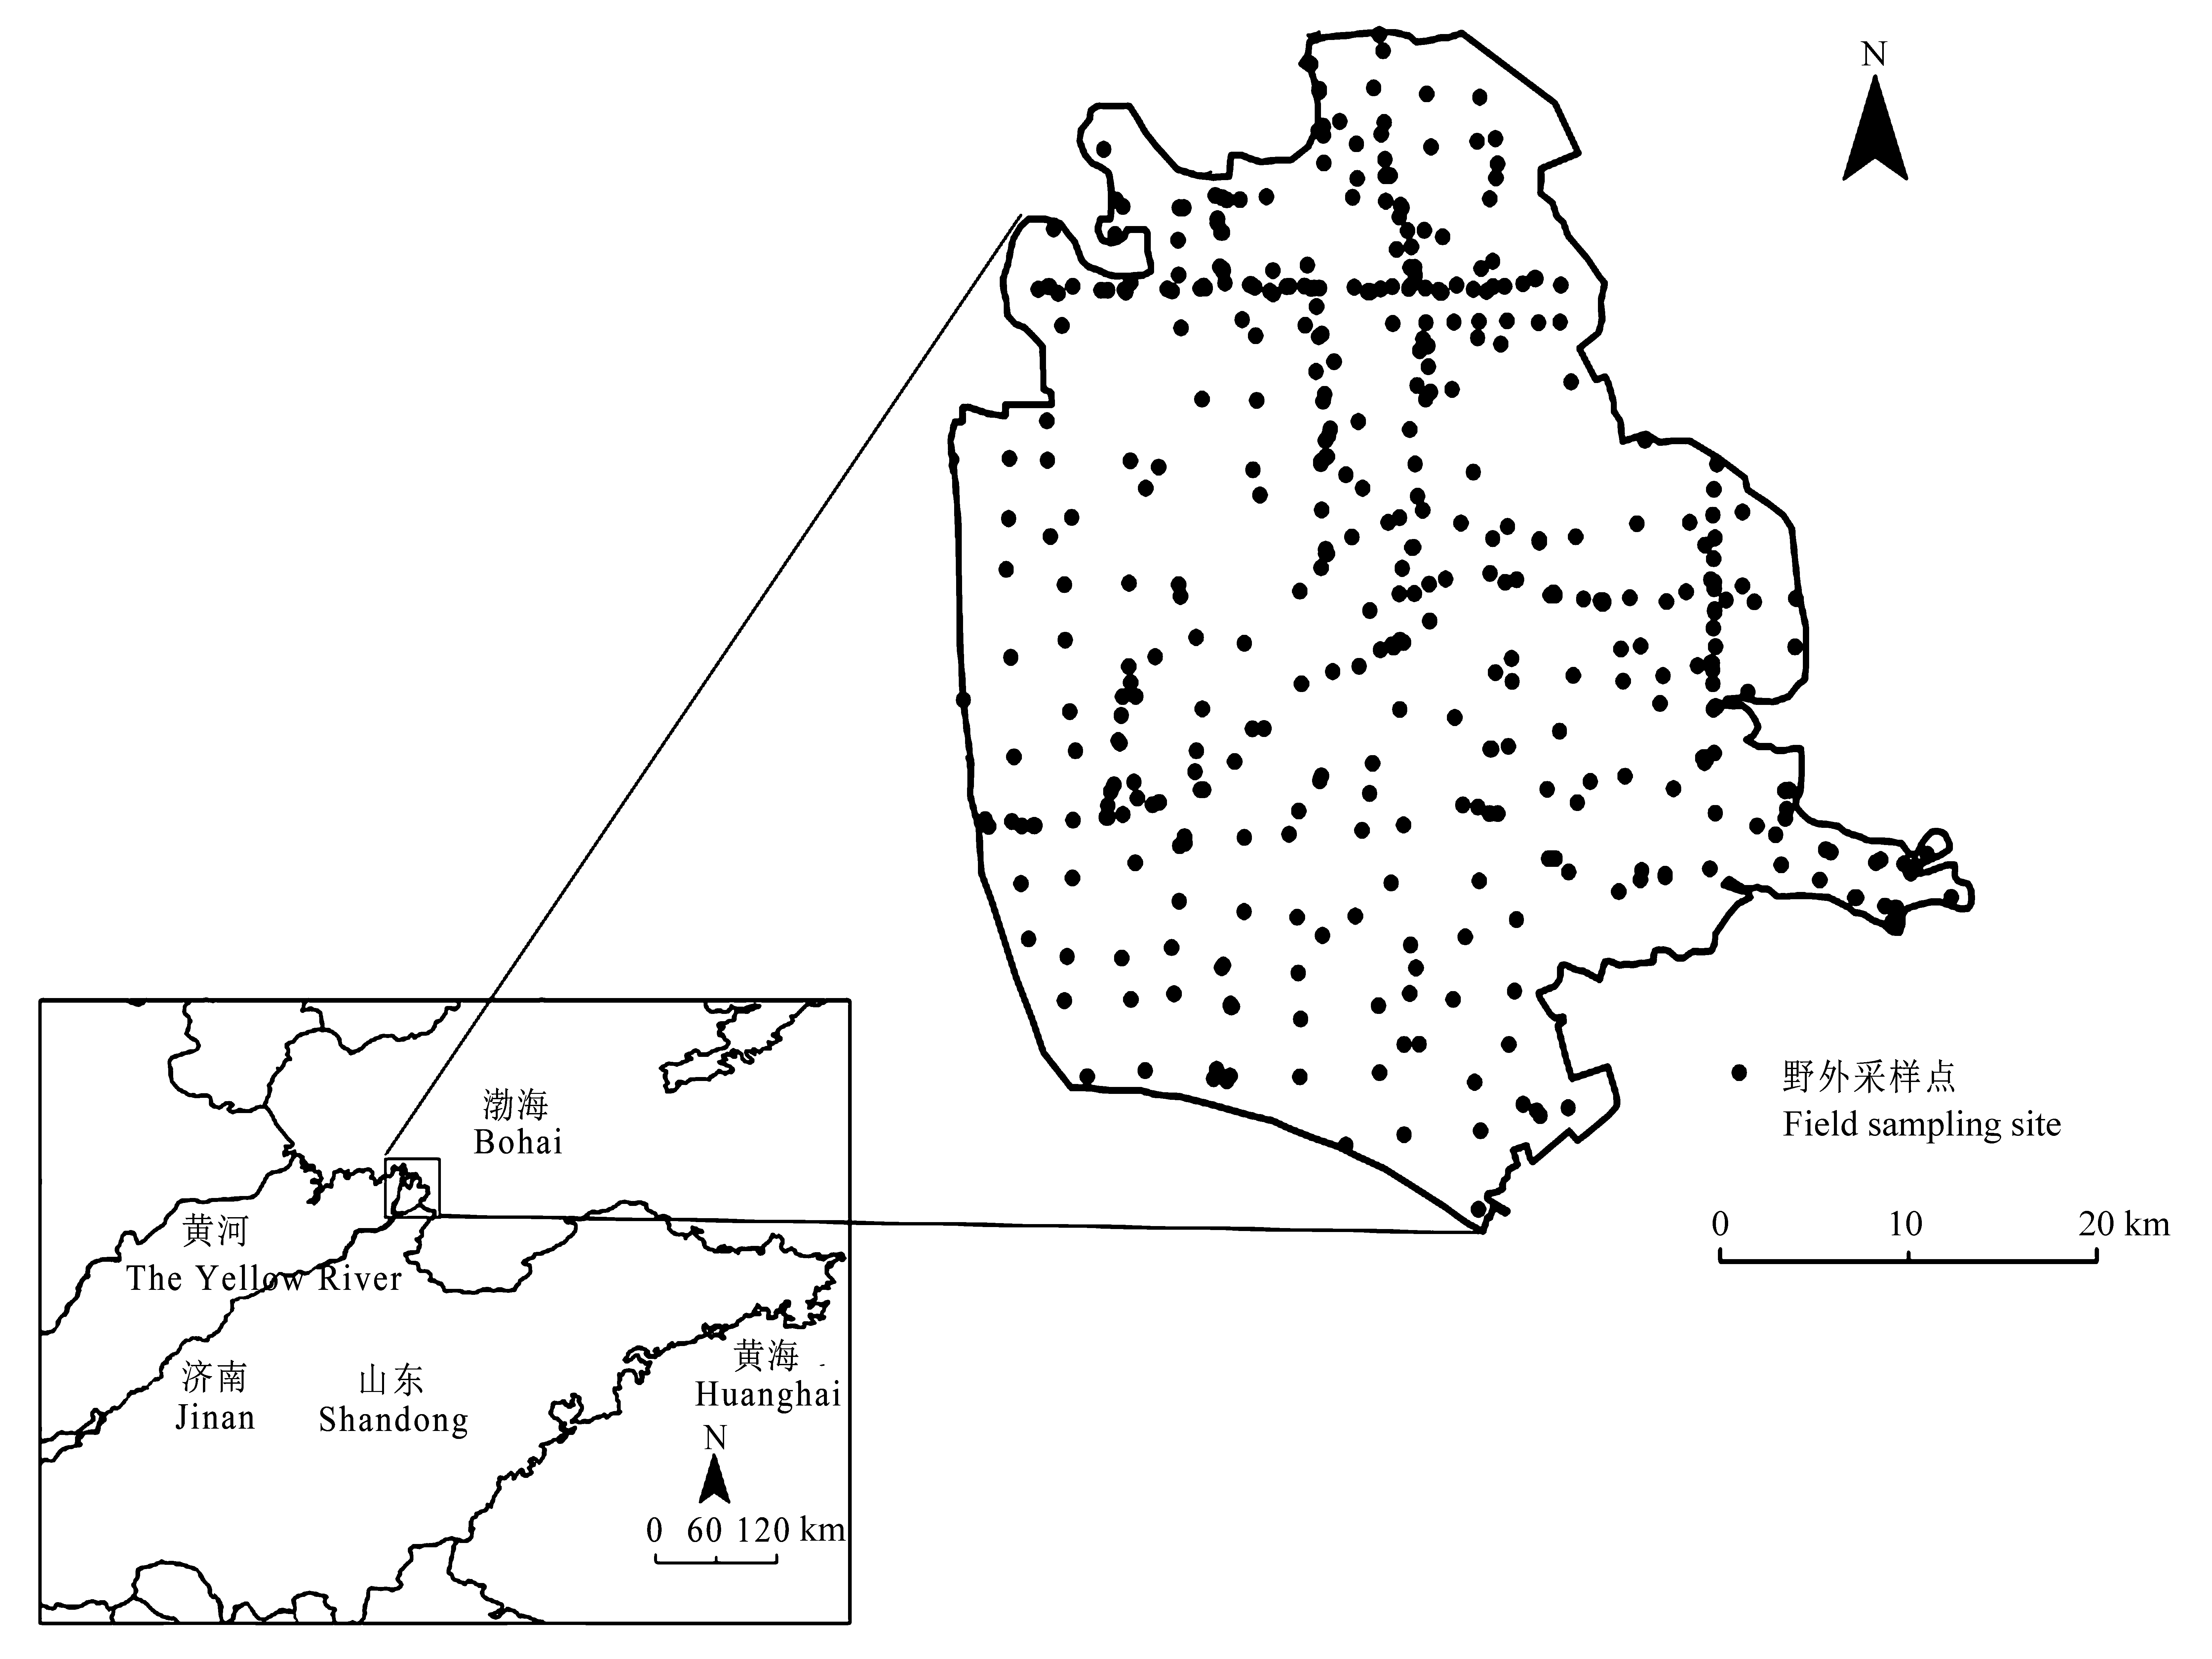
图1 黄河三角洲的位置及野外采样点分布图。
Fig. 1 Map of location of the Yellow River Delta and distribution of field sampling sites.
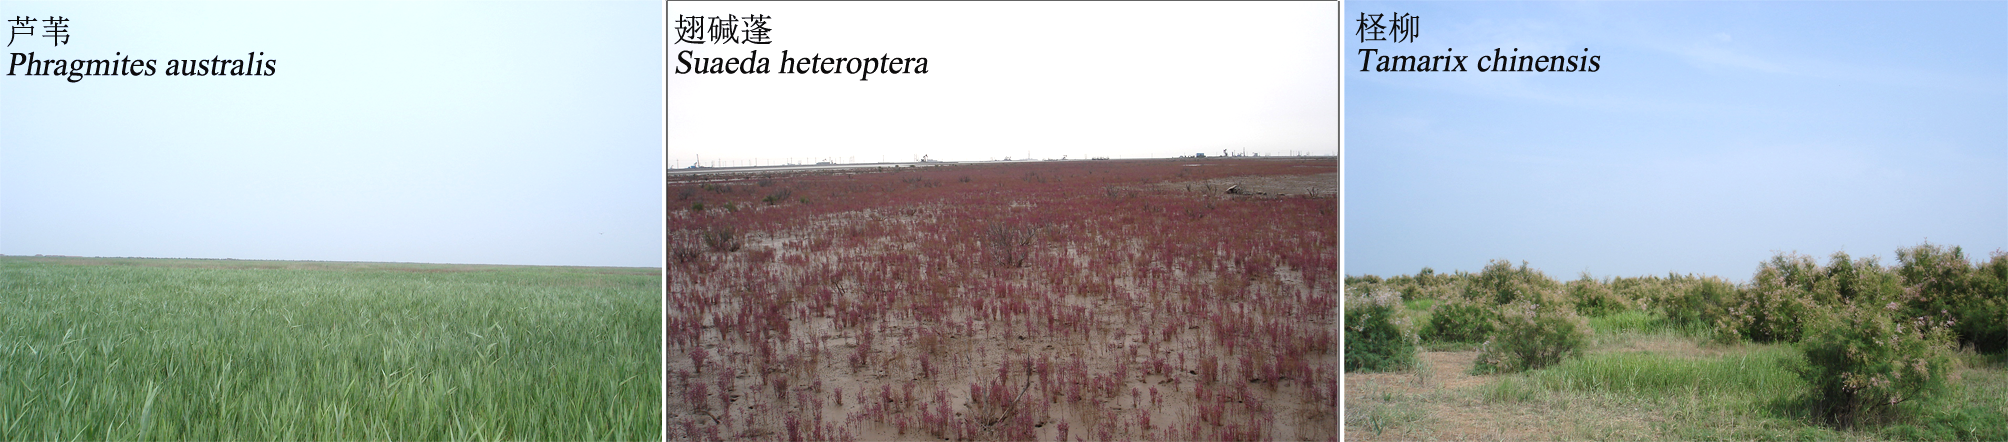
图2 黄河三角洲的主要植被类型。
Fig. 2 Main vegetation types of the Yellow River Delta.
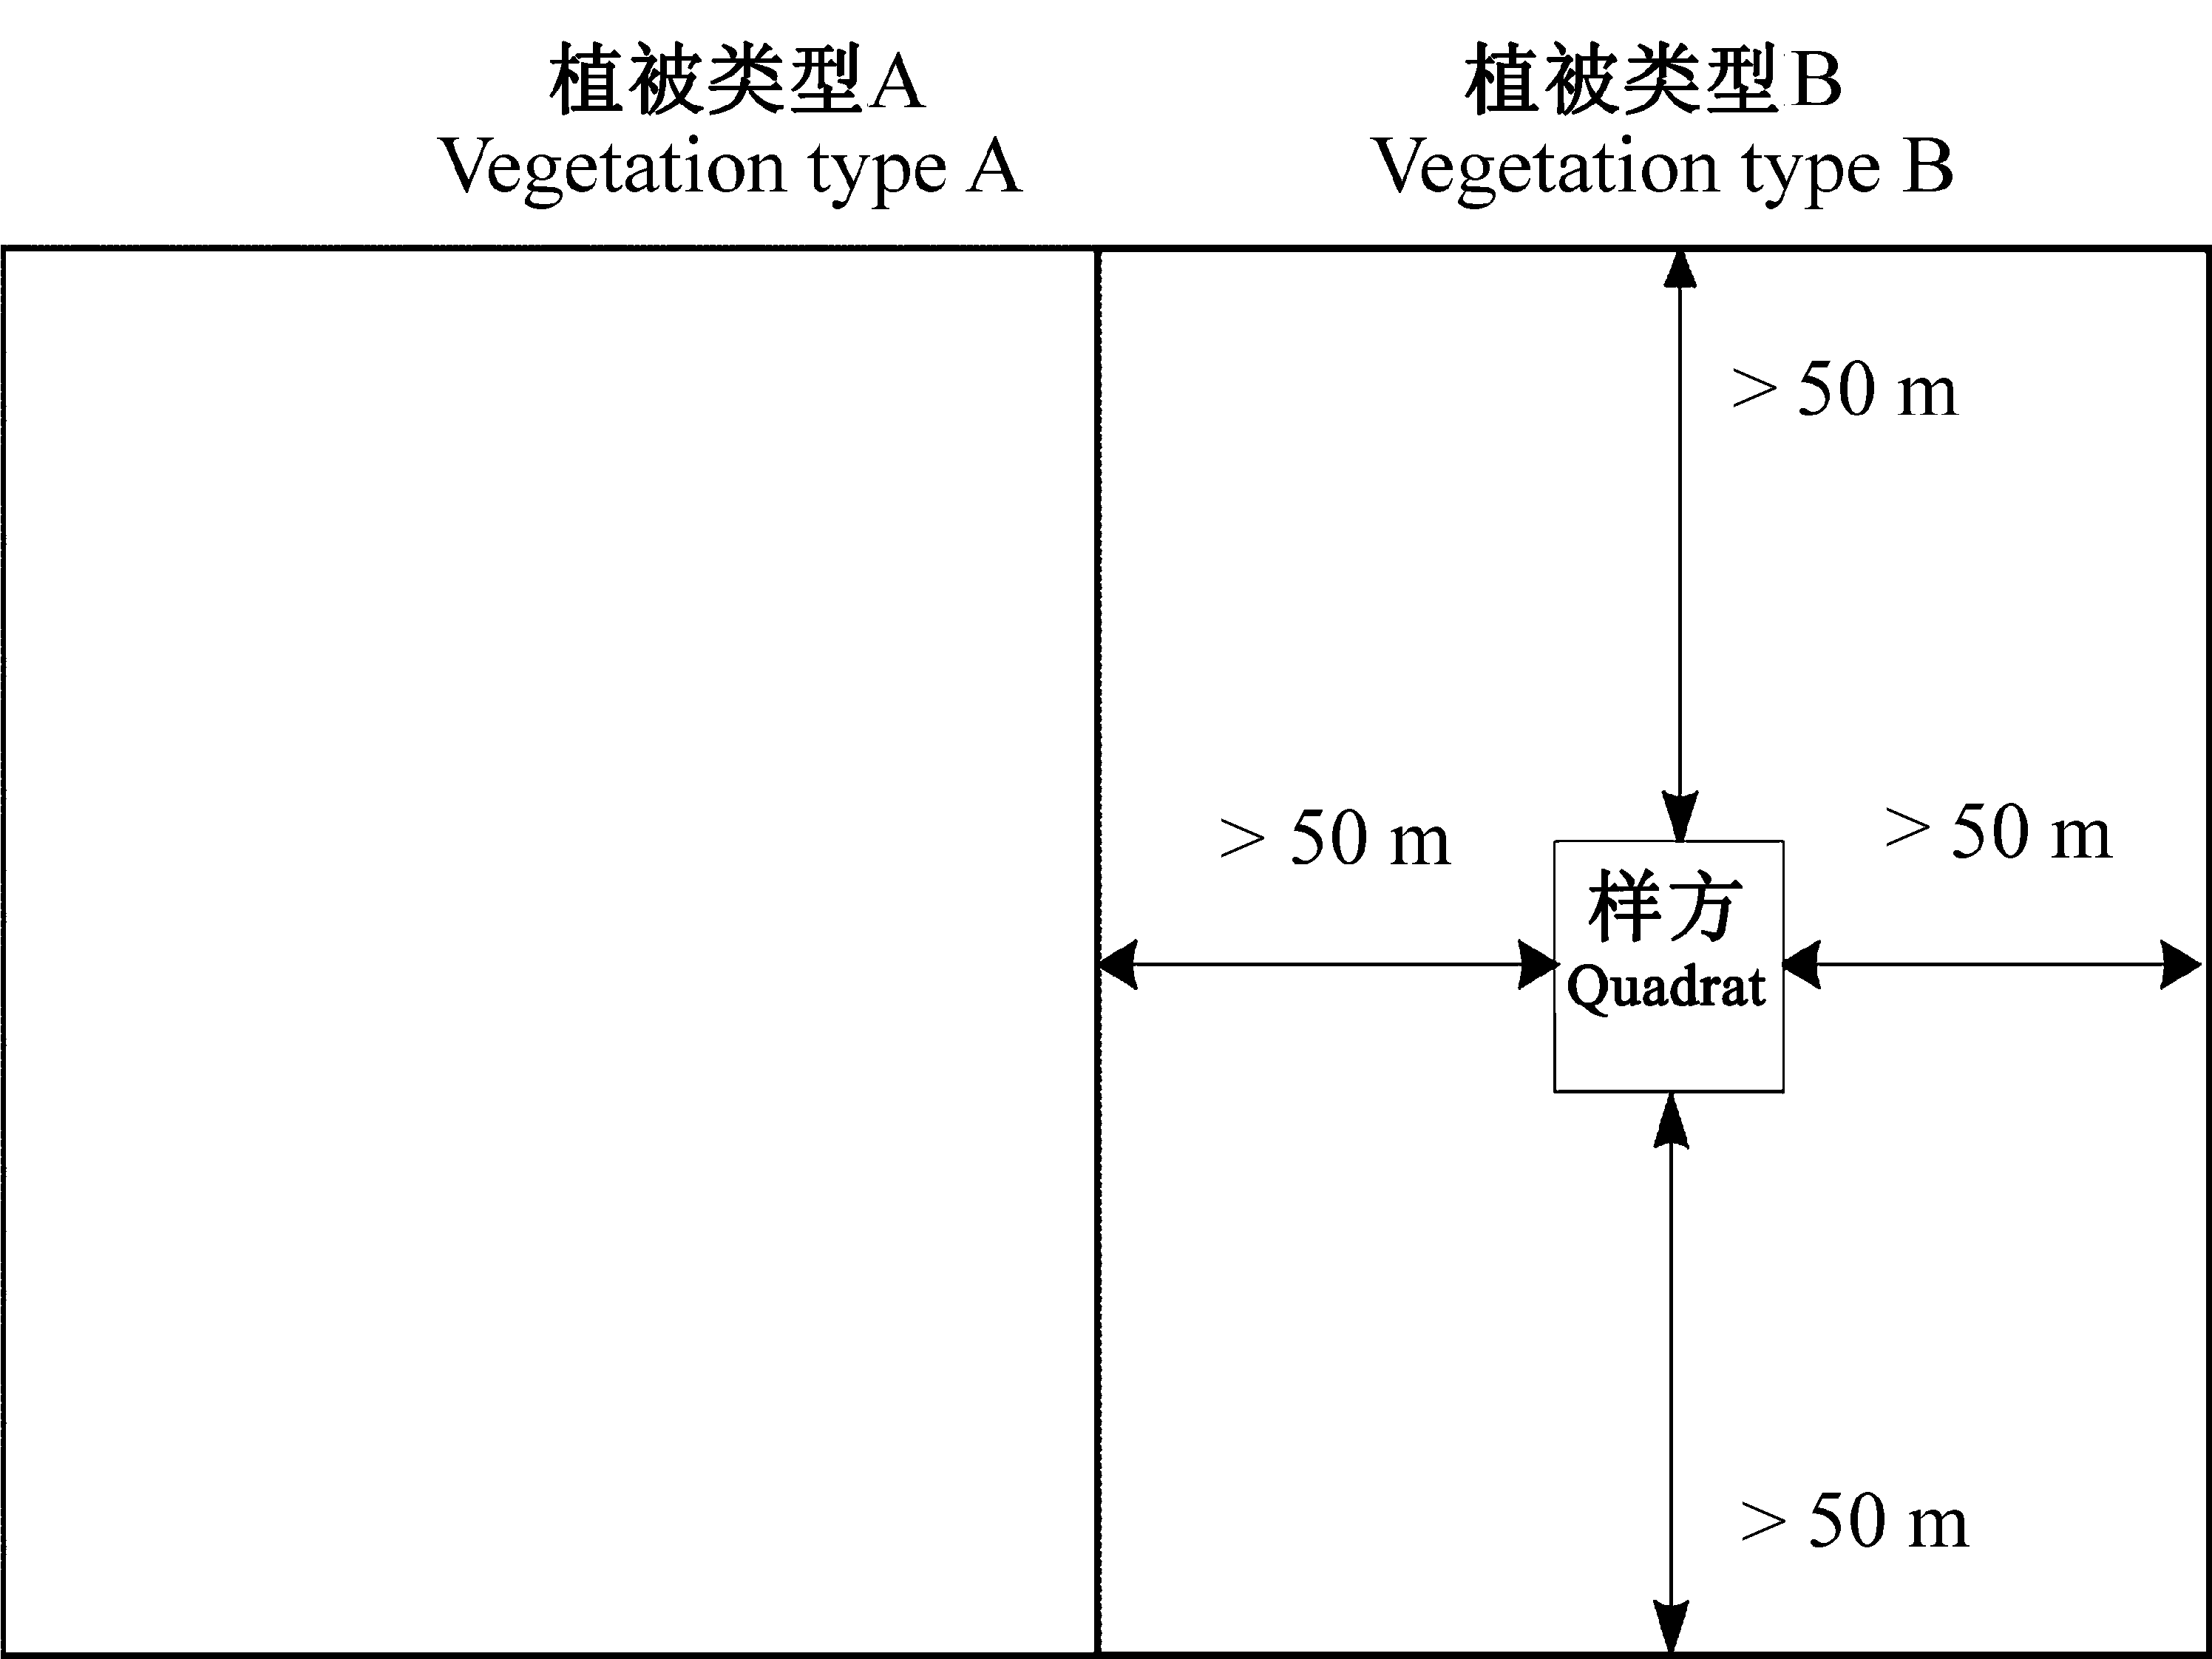
图3 样方设置方法示意图。
Fig. 3 Diagram of quadrat setting method.
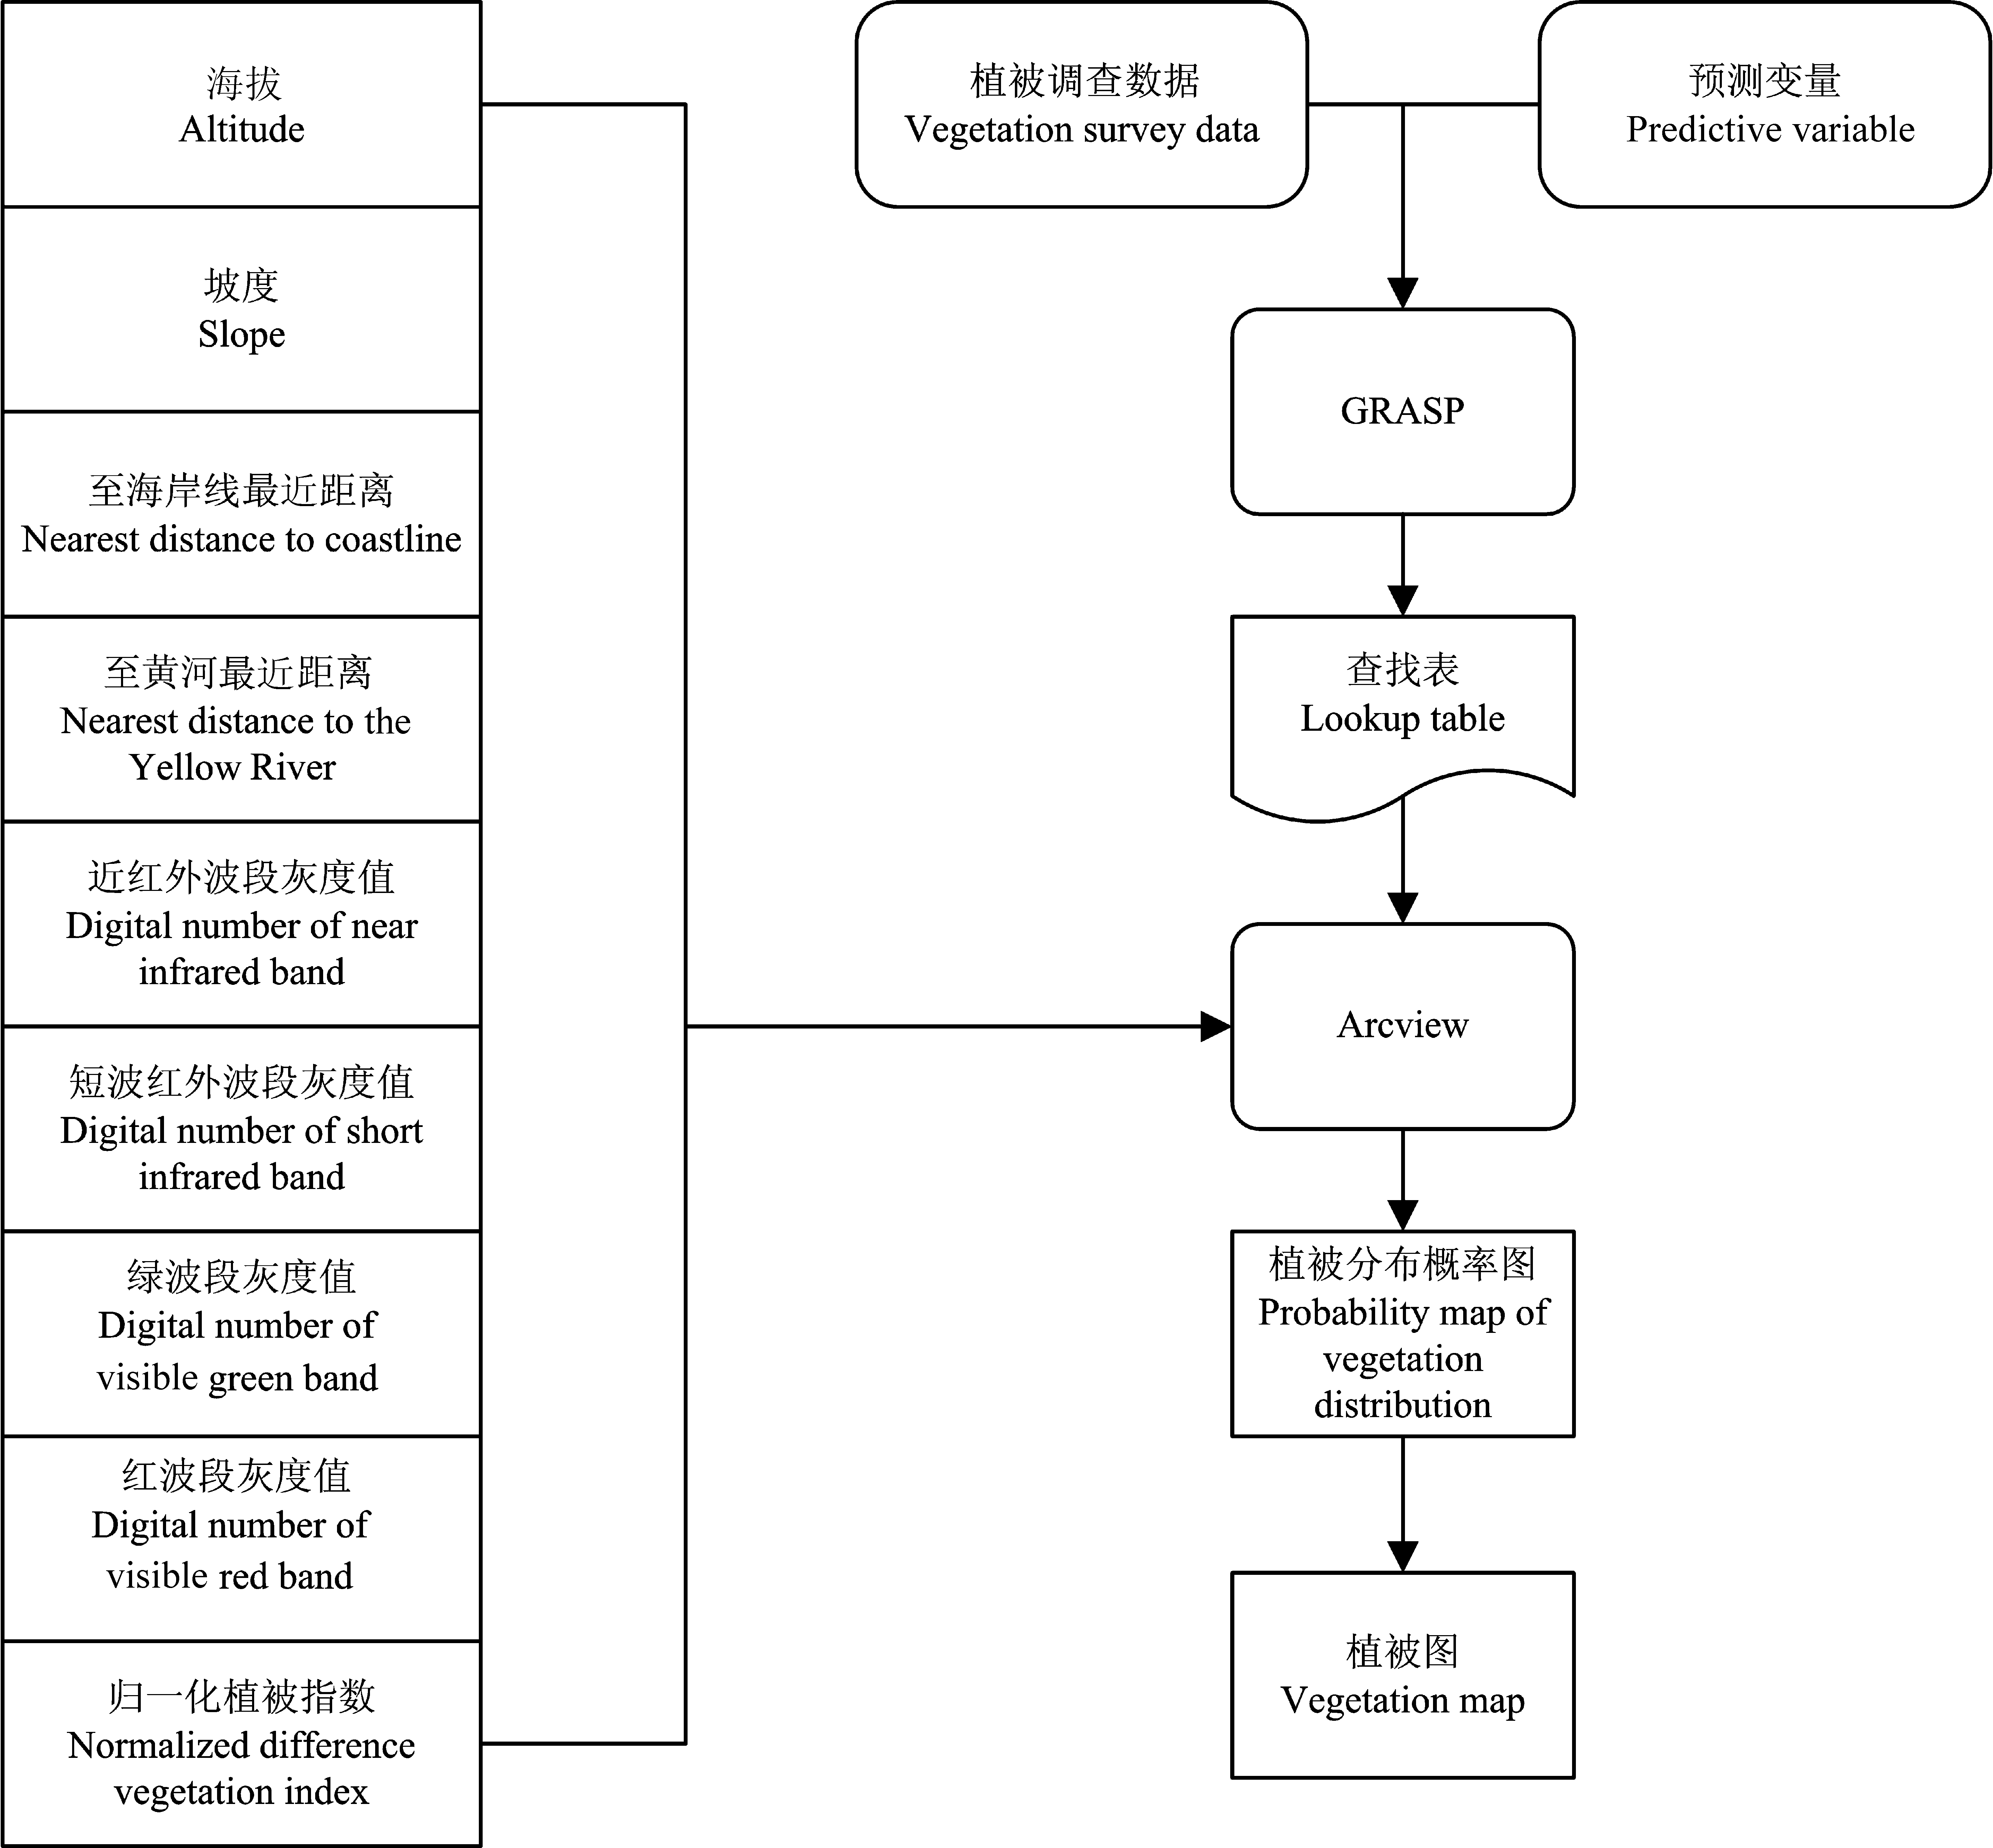
图4 植被类型识别和空间分布预测流程。GRASP, 广义回归分析与空间预测。
Fig. 4 Procedure of vegetation type identification and spatial distribution prediction. GRASP, generalized regression analysis and spatial prediction.
| 变量 Variable | 柽柳灌丛 Tamarix chinensis shrub | 芦苇草甸 Phragmites australis meadow | 翅碱蓬群落 Suaeda heteroptera community |
|---|---|---|---|
| 海拔 Altitude (m) | 2.31 ± 0.91a | 1.42 ± 0.50b | 1.72 ± 0.77c |
| 坡度 Slope (°) | 0.06 ± 0.06b | 0.04 ± 0.04a | 0.04 ± 0.04a |
| 至海岸线最近距离 Nearest distance to coastline (km) | 11.62 ± 6.73a | 11.97 ± 4.07a | 10.55 ± 6.39b |
| 至黄河最近距离 Nearest distance to the Yellow River (km) | 28.00 ± 9.03a | 24.76 ± 6.06b | 29.40 ± 6.00c |
| 短波红外波段灰度值 Digital number of short infrared band | 77.63 ± 9.77a | 67.66 ± 11.43b | 79.41 ± 14.65c |
| 红波段灰度值 Digital number of visible red band | 69.60 ± 9.49a | 59.95 ± 7.17b | 75.31 ± 13.88c |
| 近红外波段灰度值 Digital number of near infrared band | 66.37 ± 8.52a | 71.80 ± 9.10b | 70.31 ± 9.87c |
| 绿波段灰度值 Digital number of visible green band | 76.47 ± 5.66a | 71.62 ± 4.50b | 79.24 ± 7.03c |
| 归一化植被指数 Normalized difference vegetation index | 124.54 ± 12.09a | 138.78 ± 11.87b | 123.65 ± 15.46c |
表1 3种植被类型的光谱特征及其分布区的环境特征(平均值±标准偏差)
Table 1 Spectral attributes of three vegetation types and environmental characteristics of their distribution range (mean ± SD)
| 变量 Variable | 柽柳灌丛 Tamarix chinensis shrub | 芦苇草甸 Phragmites australis meadow | 翅碱蓬群落 Suaeda heteroptera community |
|---|---|---|---|
| 海拔 Altitude (m) | 2.31 ± 0.91a | 1.42 ± 0.50b | 1.72 ± 0.77c |
| 坡度 Slope (°) | 0.06 ± 0.06b | 0.04 ± 0.04a | 0.04 ± 0.04a |
| 至海岸线最近距离 Nearest distance to coastline (km) | 11.62 ± 6.73a | 11.97 ± 4.07a | 10.55 ± 6.39b |
| 至黄河最近距离 Nearest distance to the Yellow River (km) | 28.00 ± 9.03a | 24.76 ± 6.06b | 29.40 ± 6.00c |
| 短波红外波段灰度值 Digital number of short infrared band | 77.63 ± 9.77a | 67.66 ± 11.43b | 79.41 ± 14.65c |
| 红波段灰度值 Digital number of visible red band | 69.60 ± 9.49a | 59.95 ± 7.17b | 75.31 ± 13.88c |
| 近红外波段灰度值 Digital number of near infrared band | 66.37 ± 8.52a | 71.80 ± 9.10b | 70.31 ± 9.87c |
| 绿波段灰度值 Digital number of visible green band | 76.47 ± 5.66a | 71.62 ± 4.50b | 79.24 ± 7.03c |
| 归一化植被指数 Normalized difference vegetation index | 124.54 ± 12.09a | 138.78 ± 11.87b | 123.65 ± 15.46c |
| 预测变量 Predictive variables | 植被类型 Vegetation type | 样本数 Number of samples | 模型 Model | AUC | D2 |
|---|---|---|---|---|---|
| 环境变量 Environmental variable | 柽柳灌丛 Tamarix chinensis shrub | 56 | s (SP, 4) + s (ALT, 4) + s (DR, 4) | 0.863 | 0.36 |
| 芦苇草甸 Phragmites australis meadow | 48 | s (SP, 4) + s (ALT, 4) + s (DR, 4) + s (DC, 4) | 0.900 | 0.44 | |
| 翅碱蓬群落 Suaeda heteroptera community | 20 | s (SP, 4) + s (ALT, 4) + s (DR, 4) + s (DC, 4) | 0.795 | 0.20 | |
| 光谱变量 Spectral variable | 柽柳灌丛 Tamarix chinensis shrub | 56 | s (DNSIR, 4) + s (DNNIR, 4) + s (DNVG, 4) + s (NDVI, 4) + s (DNVR, 4) | 0.842 | 0.291 |
| 芦苇草甸 Phragmites australis meadow | 48 | s (DNSIR, 4) + s (DNVR, 4) + s (DNNIR, 4) + s (DNVG, 4) + s (NDVI, 4) | 0.855 | 0.335 | |
| 翅碱蓬群落 Suaeda heteroptera community | 20 | s (DNSIR, 4) + s (DNVR, 4) + s (DNNIR, 4) + s (DNVG, 4) + s (NDVI, 4) | 0.797 | 0.268 | |
| 环境变量+光谱变量 Environmental variable + spectral variable | 柽柳灌丛 Tamarix chinensis shrub | 56 | s (SP, 4) + s (ALT, 4) + s (DNSIR, 4) + s (DNVR, 4) + s (DNNIR, 4) + s (DNVG, 4) + s (NDVI, 4) + s (DR, 4) + s (DC, 4) | 0.938 | 0.561 |
| 芦苇草甸 Phragmites australis meadow | 48 | s (SP, 4) + s (ALT, 4) + s (DNSIR, 4) + s (DNVR, 4) + s (DNNIR, 4) + s (DNVG, 4) + s (NDVI, 4) + s (DR, 4) + s (DC, 4) | 0.941 | 0.554 | |
| 翅碱蓬群落 Suaeda heteroptera community | 20 | s (SP, 4) + s (ALT, 4) + s (DNSIR, 4) + s (DNVR, 4) + s (DNNIR, 4) + s (DNVG, 4) + s (NDVI, 4) + s (DR, 4) + s (DC, 4) | 0.884 | 0.412 |
表2 3种植被类型的广义加法模型
Table 2 Generalized additive models of three vegetation types
| 预测变量 Predictive variables | 植被类型 Vegetation type | 样本数 Number of samples | 模型 Model | AUC | D2 |
|---|---|---|---|---|---|
| 环境变量 Environmental variable | 柽柳灌丛 Tamarix chinensis shrub | 56 | s (SP, 4) + s (ALT, 4) + s (DR, 4) | 0.863 | 0.36 |
| 芦苇草甸 Phragmites australis meadow | 48 | s (SP, 4) + s (ALT, 4) + s (DR, 4) + s (DC, 4) | 0.900 | 0.44 | |
| 翅碱蓬群落 Suaeda heteroptera community | 20 | s (SP, 4) + s (ALT, 4) + s (DR, 4) + s (DC, 4) | 0.795 | 0.20 | |
| 光谱变量 Spectral variable | 柽柳灌丛 Tamarix chinensis shrub | 56 | s (DNSIR, 4) + s (DNNIR, 4) + s (DNVG, 4) + s (NDVI, 4) + s (DNVR, 4) | 0.842 | 0.291 |
| 芦苇草甸 Phragmites australis meadow | 48 | s (DNSIR, 4) + s (DNVR, 4) + s (DNNIR, 4) + s (DNVG, 4) + s (NDVI, 4) | 0.855 | 0.335 | |
| 翅碱蓬群落 Suaeda heteroptera community | 20 | s (DNSIR, 4) + s (DNVR, 4) + s (DNNIR, 4) + s (DNVG, 4) + s (NDVI, 4) | 0.797 | 0.268 | |
| 环境变量+光谱变量 Environmental variable + spectral variable | 柽柳灌丛 Tamarix chinensis shrub | 56 | s (SP, 4) + s (ALT, 4) + s (DNSIR, 4) + s (DNVR, 4) + s (DNNIR, 4) + s (DNVG, 4) + s (NDVI, 4) + s (DR, 4) + s (DC, 4) | 0.938 | 0.561 |
| 芦苇草甸 Phragmites australis meadow | 48 | s (SP, 4) + s (ALT, 4) + s (DNSIR, 4) + s (DNVR, 4) + s (DNNIR, 4) + s (DNVG, 4) + s (NDVI, 4) + s (DR, 4) + s (DC, 4) | 0.941 | 0.554 | |
| 翅碱蓬群落 Suaeda heteroptera community | 20 | s (SP, 4) + s (ALT, 4) + s (DNSIR, 4) + s (DNVR, 4) + s (DNNIR, 4) + s (DNVG, 4) + s (NDVI, 4) + s (DR, 4) + s (DC, 4) | 0.884 | 0.412 |
| 预测变量 Predictive variables | 坡度 Slope | 海拔 Altitude | 至海岸线 最近距离 Nearest distance to coastline | 至黄河 最近距离 Nearest distance to the Yellow River | 短波红 外波段 灰度值 Digital number of short infrared band | 红波段灰度值 Digital number of visible red band | 近红外 波段灰 度值 Digital number near infrared band | 绿波段灰度值 Digital number of visible green band | 归一化 植被指数 Normalized difference vegetation index | |
|---|---|---|---|---|---|---|---|---|---|---|
| 环境变量 Environmental variable | 柽柳灌丛 Tamarix chinensis shrub | 49.5 | 248.1 | - | 171.6 | - | - | - | - | - |
| 芦苇草甸 Phragmites australis meadow | 130.1 | 83.5 | 96.9 | 228.3 | - | - | - | - | - | |
| 翅碱蓬群落 Suaeda heteroptera community | 36.4 | 116.8 | 74.9 | 175.5 | - | - | - | - | - | |
| 光谱变量 Spectral variable | 柽柳灌丛 Tamarix chinensis shrub | - | - | - | - | 91.1 | 70.9 | 16.2 | 59.2 | 23.4 |
| 芦苇草甸 Phragmites australis meadow | - | - | - | - | 38.2 | 23.5 | 39.8 | 33.9 | 33.4 | |
| 翅碱蓬群落 Suaeda heteroptera community | - | - | - | - | 20.6 | 79.3 | 45.9 | 54.5 | 43.8 | |
| 环境变量+ 光谱变量 Environmental variable + spectral variable | 柽柳灌丛 Tamarix chinensis shrub | 40.2 | 130.3 | 7.6 | 37.4 | 20.7 | 61.2 | 26.2 | 42.5 | 36.6 |
| 芦苇草甸 Phragmites australis meadow | 84.8 | 57.8 | 95.1 | 107.7 | 17.3 | 22.5 | 7.1 | 40.7 | 29.5 | |
| 翅碱蓬群落 Suaeda heteroptera community | 34.9 | 96.5 | 57.5 | 97.1 | 15.4 | 64.7 | 40.1 | 32.8 | 77.7 |
表3 预测变量对广义加法模型的贡献
Table 3 Contribution of predictive variables to the generalized additive models
| 预测变量 Predictive variables | 坡度 Slope | 海拔 Altitude | 至海岸线 最近距离 Nearest distance to coastline | 至黄河 最近距离 Nearest distance to the Yellow River | 短波红 外波段 灰度值 Digital number of short infrared band | 红波段灰度值 Digital number of visible red band | 近红外 波段灰 度值 Digital number near infrared band | 绿波段灰度值 Digital number of visible green band | 归一化 植被指数 Normalized difference vegetation index | |
|---|---|---|---|---|---|---|---|---|---|---|
| 环境变量 Environmental variable | 柽柳灌丛 Tamarix chinensis shrub | 49.5 | 248.1 | - | 171.6 | - | - | - | - | - |
| 芦苇草甸 Phragmites australis meadow | 130.1 | 83.5 | 96.9 | 228.3 | - | - | - | - | - | |
| 翅碱蓬群落 Suaeda heteroptera community | 36.4 | 116.8 | 74.9 | 175.5 | - | - | - | - | - | |
| 光谱变量 Spectral variable | 柽柳灌丛 Tamarix chinensis shrub | - | - | - | - | 91.1 | 70.9 | 16.2 | 59.2 | 23.4 |
| 芦苇草甸 Phragmites australis meadow | - | - | - | - | 38.2 | 23.5 | 39.8 | 33.9 | 33.4 | |
| 翅碱蓬群落 Suaeda heteroptera community | - | - | - | - | 20.6 | 79.3 | 45.9 | 54.5 | 43.8 | |
| 环境变量+ 光谱变量 Environmental variable + spectral variable | 柽柳灌丛 Tamarix chinensis shrub | 40.2 | 130.3 | 7.6 | 37.4 | 20.7 | 61.2 | 26.2 | 42.5 | 36.6 |
| 芦苇草甸 Phragmites australis meadow | 84.8 | 57.8 | 95.1 | 107.7 | 17.3 | 22.5 | 7.1 | 40.7 | 29.5 | |
| 翅碱蓬群落 Suaeda heteroptera community | 34.9 | 96.5 | 57.5 | 97.1 | 15.4 | 64.7 | 40.1 | 32.8 | 77.7 |
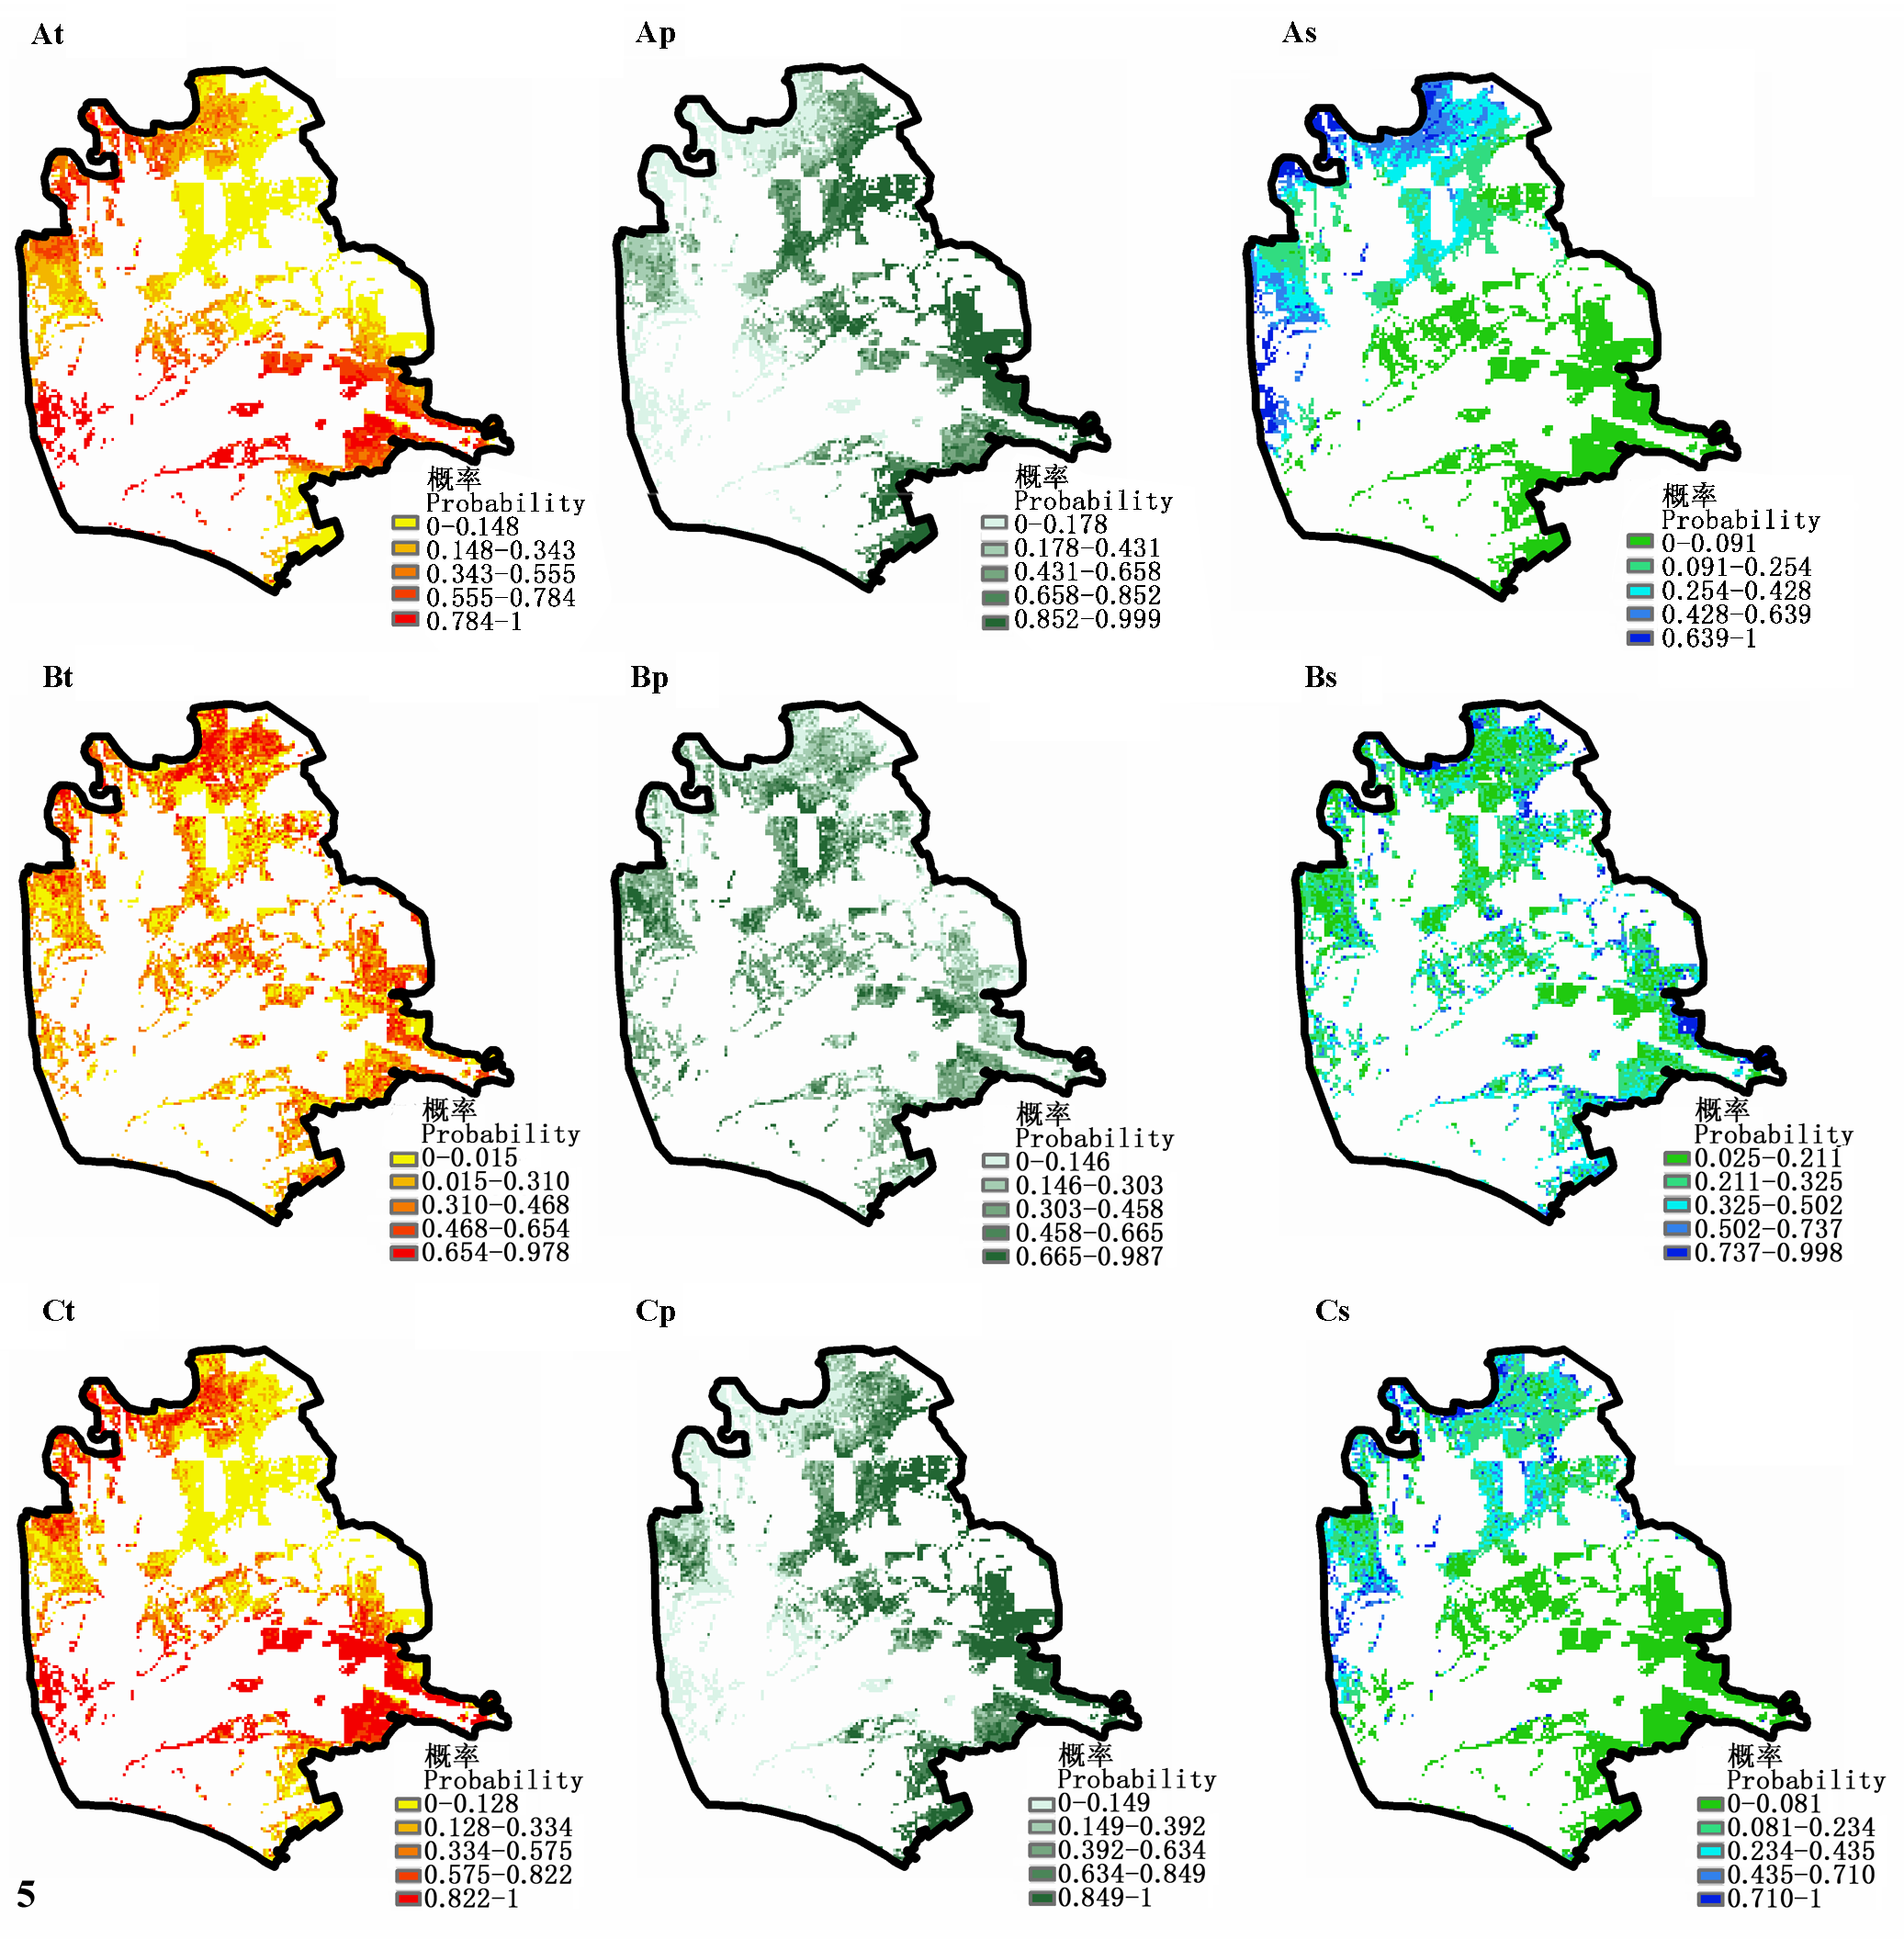
图5 基于广义加法模型预测的3种植被类型分布概率。At、Ap、As分别表示柽柳灌丛、芦苇草甸和翅碱蓬群落在情景A中预测的分布概率; Bt、Bp、Bs分别表示柽柳灌丛、芦苇草甸和翅碱蓬群落在情景B中预测的分布概率; Ct、Cp、Cs分别表示柽柳灌丛、芦苇草甸和翅碱蓬群落在情景C中预测的分布概率。情景A是以环境变量作为预测变量; 情景B是以光谱变量作为预测变量; 情景C是以环境变量与光谱变量作为预测变量。
Fig. 5 Predicted distribution probability of three vegetation types based on generalized additive model. At, Ap and As is respectively the predicted distribution probability of Tamarix chinensis shrub, Phragmites australis meadow, Suaeda heteroptera community under scene A; Bt, Bp and Bs is respectively the predicted distribution probability of Tamarix chinensis shrub, Phragmites australis meadow, Suaeda heteroptera community under scene B; Ct, Cp and Cs is respectively the predicted distribution probability of Tamarix chinensis shrub, Phragmites australis meadow, Suaeda heteroptera community under scene C. Scene A, using environmental variables as predictive variables; Scene B, using spectral variables as predictive variables; Scene C, using both environmental variables and spectral variables as predictive variables.
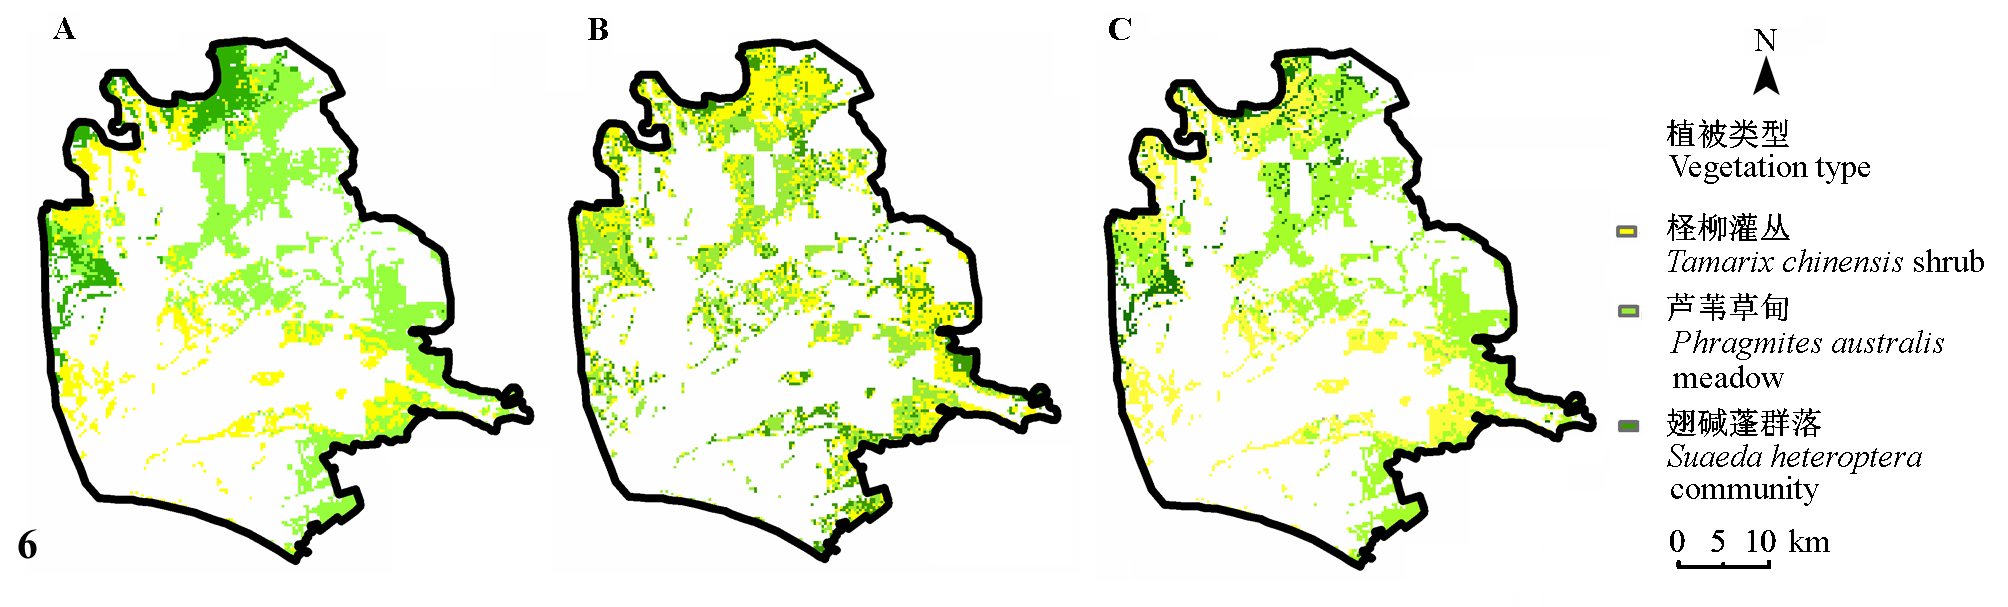
图6 基于广义加法模型预测的3种植被类型分布图。 A, 以环境变量作为预测变量。B, 以光谱变量作为预测变量。C, 以环境变量和光谱变量作为预测变量。
Fig. 6 Predicted distribution map of three vegetation types based on generalized additive models. A, using environmental variables as predictive variables. B, using spectral variables as predictive variables. C, using both environmental variables and spectral variables as predictive variables.
| 预测变量 Predictive variables | 验证样方的植被类型 Vegetation type of the quadrat for validation | 广义加法模型预测的植被类型 Predicted vegetation type by generalized additive model | ||
|---|---|---|---|---|
| 柽柳灌丛 Tamarix chinensis shrub | 芦苇草甸 Phragmites australis meadow | 翅碱蓬群落 Suaeda heteroptera community | ||
| 光谱变量 Spectral variable | 柽柳灌丛 Tamarix chinensis shrub | 36.7% | 43.4% | 19.9% |
| 芦苇草甸 Phragmites australis meadow | 14.7% | 58.9% | 26.4% | |
| 翅碱蓬群落 Suaeda heteroptera community | 18.4% | 30.4% | 51.2% | |
| 环境变量 Environmental variable | 柽柳灌丛 Tamarix chinensis shrub | 34.1% | 37.2% | 28.7% |
| 芦苇草甸 Phragmites australis meadow | 23.1% | 57.7% | 19.2% | |
| 翅碱蓬群落 Suaeda heteroptera community | 23.1% | 22.8% | 54.1% | |
| 环境变量+光谱变量 Environmental variable + spectral variable | 柽柳灌丛 Tamarix chinensis shrub | 52.1% | 30.6% | 17.3% |
| 芦苇草甸 Phragmites australis meadow | 10.5% | 82.7% | 6.8% | |
| 翅碱蓬群落 Suaeda heteroptera community | 16.1% | 16.6% | 67.3% | |
表4 广义加法模型验证结果
Table 4 Validation results of generalized additive model
| 预测变量 Predictive variables | 验证样方的植被类型 Vegetation type of the quadrat for validation | 广义加法模型预测的植被类型 Predicted vegetation type by generalized additive model | ||
|---|---|---|---|---|
| 柽柳灌丛 Tamarix chinensis shrub | 芦苇草甸 Phragmites australis meadow | 翅碱蓬群落 Suaeda heteroptera community | ||
| 光谱变量 Spectral variable | 柽柳灌丛 Tamarix chinensis shrub | 36.7% | 43.4% | 19.9% |
| 芦苇草甸 Phragmites australis meadow | 14.7% | 58.9% | 26.4% | |
| 翅碱蓬群落 Suaeda heteroptera community | 18.4% | 30.4% | 51.2% | |
| 环境变量 Environmental variable | 柽柳灌丛 Tamarix chinensis shrub | 34.1% | 37.2% | 28.7% |
| 芦苇草甸 Phragmites australis meadow | 23.1% | 57.7% | 19.2% | |
| 翅碱蓬群落 Suaeda heteroptera community | 23.1% | 22.8% | 54.1% | |
| 环境变量+光谱变量 Environmental variable + spectral variable | 柽柳灌丛 Tamarix chinensis shrub | 52.1% | 30.6% | 17.3% |
| 芦苇草甸 Phragmites australis meadow | 10.5% | 82.7% | 6.8% | |
| 翅碱蓬群落 Suaeda heteroptera community | 16.1% | 16.6% | 67.3% | |
| 1 | Austin MP ( 1980). Searching for a model for use in vegetation analysis. Vegetatio, 42, 11-21. |
| 2 | Berberoglu S, Curran PJ, Loyd CD, Atkinson PM ( 2007). Texture classification of Mediterranean land cover. International Journal of Applied Earth Observation and Geoinformation, 9, 322-334. |
| 3 | Cawsey EM, Austin MP, Baker BL ( 2002). Regional vegetation mapping in Australia: a case study in the practical use of statistical modelling. Biodiversity and Conservation, 11, 2239-2274. |
| 4 | Chang CC, Lee PF, Bai ML, Lin TT ( 2004). Predicting the geographical distribution of plant communities in complex terrain: a case study in Fushian Experimental Forest, northeastern Taiwan. Ecography, 27, 577-588. |
| 5 | Deering DW ( 1978). Rangeland Reflectance Characteristics Measured by Aircraft and Spacecraft Sensors. PhD dissertation, Texas A & M University, College Station, USA. 338. |
| 6 | Dirnböck T, Dullinger S, Grabherr G ( 2001). A new grassland community in the Eastern Alps (Austria): evidence of environmental distribution limits of endemic plant communities. Phytocoenologia, 31, 521-536. |
| 7 | Dirnböck T, Dullinger S, Grabherr G ( 2003) A regional impact assessment of climate and land use change on alpine vegetation. Journal of Biogeography, 30, 401-418. |
| 8 | Estes LD, Reillo PR, Mwangi AG, Okin GS, Shugart HH ( 2010). Remote sensing of structural complexity indices for habitat and species distribution modeling. Remote Sensing of Environment, 114, 792-804. |
| 9 | Ferrier S, Guisan A ( 2006). Spatial modelling of biodiversity at the community level. Journal of Applied Ecology, 43, 393-404. |
| 10 | Frizzelle BG, Moody A ( 2001). Mapping continuous distribu- tions of land cover: a comparison of maximum-likelihood estimation and artificial neural networks. Photogrammetric Engineering and Remote Sensing, 67, 693-705. |
| 11 | Goward SN, Huemmerich KF, Waring RH ( 1994). Visible-near infrared spectral reflectance of landscape components in western Oregon. Remote Sensing of Environment, 47, 190-203. |
| 12 | Guisan A, Zimmermann NE ( 2000). Predictive habitat distribution models in ecology. Ecological Modelling, 135, 147-186. |
| 13 | Hastie TJ, Tibshirani RJ ( 1990). Generalized Additive Models. Chapman and Hall, London. |
| 14 | He XH ( 赫晓慧), Wen ZM ( 温仲明), Wang JX ( 王金鑫 ) ( 2008). Spatial distribution of major grassland species and its relations to environment in Yanhe River catchment based on generalized additive model. Chinese Journal of Ecology (生态学杂志), 27, 1718-1724. (in Chinese with English abstract) |
| 15 | Hosmer DW, Lemeshow S ( 2000). Applied Logistic Regres- sion. Wiley & Sons, New York. |
| 16 | Leathwick JR ( 2001). New Zealand’s potential forest pattern as predicted from current species-environment relationships. New Zealand Journal of Botany, 39, 447-464. |
| 17 | Lehmann A, Overton JM, Leathwick JR ( 2002). GRASP: generalized regression analysis and spatial prediction. Ecological Modelling, 157, 189-207. |
| 18 | Liu XP ( 刘小平), Li X ( 黎夏), Peng XJ ( 彭晓鹃), Li HB ( 黎海波), He JQ ( 何晋强 ) ( 2007) . Swarm intelligence for classification of remote sensing data. Science in China Series D: Earth Sciences (中国科学D辑: 地球科学), 51, 79-87. (in Chinese) |
| 19 | Olden JD, Joy MK, Death RG ( 2006). Rediscovering the species in community-wide predictive modeling. Ecological Applications, 16, 1449-1460. |
| 20 | Phillips SJ, Dudik M ( 2008). Modeling of species distributions with Maxent: new extensions and a comprehensive evaluation. Ecography, 31, 161-175. |
| 21 | Sanders ME, Dirkse GM, Slim PA ( 2004). Objectifying thematic, spatial and temporal aspects of vegetation mapping for monitoring. Community Ecology, 5, 81-91. |
| 22 | Shen ZH ( 沈泽昊), Zhao J ( 赵俊 ) ( 2007). Prediction of the spatial patterns of species richness based on the plant-topography relationship: an application of GAMs approach. Acta Ecologica Sinica (生态学报), 27, 953-963. (in Chinese with English abstract) |
| 23 | Song CY, Liu GH, Liu QS ( 2009). Spatial and environmental effects on plant communities in the Yellow River Delta, Eastern China. Journal of Forestry Research, 20, 117-122. |
| 24 | Song YC ( 宋永昌 ) (2001). Vegetation Ecology (植被生态学). East China Normal University Press, Shanghai. (in Chinese) |
| 25 | Stow D, Hamada Y, Coulter L, Anguelova Z ( 2008). Monitor- ing shrubland habitat changes through object-based change identification with airborne multispectral imagery. Remote Sensing of Environment, 112, 1051-1061. |
| 26 | Thuiller W ( 2003). BIOMOD-optimizing predictions of species distributions and projecting potential future shifts under global change. Global Change Biology, 9, 1353-1363. |
| 27 | Thuiller W, Brotons L, Araújo MB, Lavorel S ( 2004). Effects of restricting environmental range of data to project current and future species distributions. Ecography, 27, 165-172. |
| 28 | Treitz PM, Howarth PJ, Suffling RC ( 1992). Application of detailed ground information to vegetation mapping with high spatial resolution digital imagery. Remote Sensing of Environment, 42, 65-82. |
| 29 |
Wen ZM ( 温仲明), Jiao F ( 焦峰), Jiao JY ( 焦菊英 ) ( 2008). Prediction and mapping of potential vegetation distribu- tion in Yanhe River catchment in hilly area of Loess Plateau. Chinese Journal of Applied Ecology (应用生态学报), 19, 1897-1904. (in Chinese with English abstract)
URL PMID |
| 30 | White PS, Wilds SP, Stratton DA ( 2001). The distribution of heath balds in the Great Smoky Mountains, North Carolina and Tennessee. Journal of Vegetation Science, 12, 453-466. |
| 31 | Xu XG ( 许学工 ) ( 1997). An analyses on the land structure in the Yellow River Delta. Acta Geographica Sinica (地理学报), 52, 18-26. (in Chinese with English abstract) |
| 32 | Yang CJ ( 杨存建), Zhou CH ( 周成虎 ) ( 2001). Investigation on classification of remote sensing image on basis of knowledge. Geography and Territorial Research (地理学与国土研究), 17, 72-77. (in Chinese with English abstract) |
| 33 | Ye QH ( 叶庆华), Tian GL ( 田国良), Liu GH ( 刘高焕), Ye JM ( 叶景敏), Lou WG ( 娄维国 ) ( 2004). Tupu analysis on the land cover evolving patterns in the new-born wetland of the Yellow River Delta. Geographical Research (地理研究), 23, 257-264. (in Chinese with English abstract) |
| 34 | Zhang JT ( 张金屯 ) (1995). Quantitative Method of Vegetation Ecology (植被数量生态学方法). China Science and Technology Press, Beijing. (in Chinese) |
| 35 | Zhang RQ, Zhu DL ( 2011). Study of land cover classification based on knowledge rules using high-resolution remote sensing images. Expert Systems with Applications, 38, 3647-3652. |
| 36 | Zhao YM ( 赵延茂), Song CS ( 宋朝枢 ) (1995). Scientific Survey of the Yellow River Delta National Nature Reserve (黄河三角洲国家级自然保护区科学考察集). China Forestry Publishing House, Beijing. (in Chinese) |
| 37 | Zhao YS ( 赵英时 ) (2003). The Principle and Method of Analysis of Remote Sensing Application (遥感应用分析原理与方法). Science Press, Beijing. (in Chinese) |
| [1] | 刘宁, 彭守璋, 陈云明. 气候因子对青藏高原植被生长的时间效应[J]. 植物生态学报, 2022, 46(1): 18-26. |
| [2] | 倪铭, 张曦月, 姜超, 王鹤松. 中国西南部地区植被对极端气候事件的响应[J]. 植物生态学报, 2021, 45(6): 626-640. |
| [3] | 张琪, 袁秀亮, 陈曦, 罗格平, 李龙辉. 1982-2012年中亚植被变化及其对气候变化的响应[J]. 植物生态学报, 2016, 40(1): 13-23. |
| [4] | 孙晓鹏, 王天明, 寇晓军, 葛剑平. 黄土高原泾河流域长时间序列的归一化植被指数动态变化及其驱动因素分析[J]. 植物生态学报, 2012, 36(6): 511-521. |
| [5] | 余振, 孙鹏森, 刘世荣. 中国东部南北样带主要植被类型归一化植被指数对气候变化的响应及不同时间尺度的差异性[J]. 植物生态学报, 2011, 35(11): 1117-1126. |
| 阅读次数 | ||||||
|
全文 |
|
|||||
|
摘要 |
|
|||||
Copyright © 2022 版权所有 《植物生态学报》编辑部
地址: 北京香山南辛村20号, 邮编: 100093
Tel.: 010-62836134, 62836138; Fax: 010-82599431; E-mail: apes@ibcas.ac.cn, cjpe@ibcas.ac.cn
备案号: 京ICP备16067583号-19