
植物生态学报 ›› 2017, Vol. 41 ›› Issue (1): 136-146.DOI: 10.17521/cjpe.2016.0026
所属专题: 中国灌丛生态系统碳储量的研究; 生态化学计量
苏凯文1, 陈路红1, 郑伟1, 潘瑶2, 尹华军3, 巩合德1,*( )
)
收稿日期:2016-01-17
接受日期:2016-12-25
出版日期:2017-01-10
发布日期:2017-01-23
通讯作者:
巩合德
作者简介:* 通信作者Author for correspondence (E-mail:基金资助:
Kai-Wen SU1, Lu-Hong CHEN1, Wei ZHENG1, Yao PAN2, Hua-Jun YIN3, He-De GONG1,*()
Received:2016-01-17
Accepted:2016-12-25
Online:2017-01-10
Published:2017-01-23
Contact:
He-De GONG
About author:KANG Jing-yao(1991-), E-mail: 摘要:
碳(C)、氮(N)、磷(P)在植物生长和各种生理调节机能中发挥着重要作用。为研究云南灌丛生态系统C、N、P含量之间的关系以及植物生物量、土壤C、N、P含量与植物C、N、P含量的相互影响, 该研究采用样地调查的方法, 在云南省云南杨梅(Myrica nana)灌丛主要分布区设立了29个样地, 通过测量样地中云南杨梅灌丛C、N、P含量, 系统分析了云南杨梅C、N、P的计量规律。结果显示: 1)研究区域云南杨梅根茎叶的C、N、P含量的平均值分别是45.94%、0.54%、0.03%, 46.32%、0.58%、0.03%和49.05%、1.70%、0.06% (干质量), 其中叶的C、N、P含量均显著高于茎和根。在根中C:N:P为1531:18:1, 在茎中C:N:P为1544:19:1, 而在叶中C:N:P为818:10:1, 反映了云南杨梅不同部位元素计量不同的分配关系; 2)云南杨梅叶片中C含量和N:P值随生物量的增加而降低, 但只有叶片C含量与生物量的相关关系极显著, 而N:P值与生物量的相关关系不显著。叶片中N含量和P含量随生物量的增加而升高, 其中P含量与生物量的相关关系显著, N含量与生物量的相关关系不显著。云南杨梅叶的N:P (34.2)明显大于8, 说明P是云南杨梅生长的限制因素。3)根的C、N、P含量与土壤中的P含量都有显著的相关性, 其中N、P为极显著正相关, C为显著负相关; 茎的C含量与土壤的C、N、P含量都显著负相关, 且N、P含量的相关性极显著, 而茎的P含量与土壤中的P含量极显著正相关; 叶的P含量与土壤的C、N、P含量都极显著正相关, 叶的C含量则与土壤的P含量极显著负相关。该研究结果可为西南高原灌丛生态系统的研究提供数据支持。
苏凯文, 陈路红, 郑伟, 潘瑶, 尹华军, 巩合德. 云南杨梅碳、氮、磷化学计量特征. 植物生态学报, 2017, 41(1): 136-146. DOI: 10.17521/cjpe.2016.0026
Kai-Wen SU, Lu-Hong CHEN, Wei ZHENG, Yao PAN, Hua-Jun YIN, He-De GONG. Carbon, nitrogen and phosphorus stoichiometry of Myrica nana in Yunnan, China. Chinese Journal of Plant Ecology, 2017, 41(1): 136-146. DOI: 10.17521/cjpe.2016.0026
| 样地编号 Site number | 样地地点 Site location | 纬度 Latitude (N) | 经度 Longitude (E) | 海拔 Altitude (m) |
|---|---|---|---|---|
| YN002 | 云南省姚安县 Yao’an,Yunnan | 25.52° | 101.40° | 2 220.6 |
| YN003 | 云南省姚安县 Yao’an,Yunnan | 25.49° | 101.31° | 2 623.1 |
| YN004 | 云南省姚安县 Yao’an,Yunnan | 25.50° | 101.15° | 2 093.3 |
| YN006 | 云南省大姚县 Dayao,Yunnan | 25.66° | 101.15° | 2 258.6 |
| YN010 | 云南省大姚县 Dayao,Yunnan | 25.71° | 101.48° | 2 120.4 |
| YN011 | 云南省大姚县 Dayao,Yunnan | 25.91° | 101.23° | 2 396.0 |
| YN013 | 云南省牟定县 Mouding,Yunnan | 25.45° | 101.46° | 2 037.9 |
| YN016 | 云南省牟定县 Mouding,Yunnan | 25.44° | 101.53° | 2 145.2 |
| YN017 | 云南省牟定县 Mouding,Yunnan | 25.45° | 101.63° | 2 245.0 |
| YN018 | 云南省南华县 Nanhua,Yunnan | 25.33° | 101.03° | 2 567.2 |
| YN019 | 云南省南华县 Nanhua,Yunnan | 25.17° | 101.06° | 2 392.4 |
| YN020 | 云南省南华县 Nanhua,Yunnan | 25.32° | 101.26° | 2 148.2 |
| YN022 | 云南省禄丰县 Lufeng,Yunnan | 25.31° | 102.12° | 2 113.1 |
| YN024 | 云南省禄丰县 Lufeng,Yunnan | 25.31° | 101.90° | 2 199.1 |
| YN025 | 云南省禄丰县 Lufeng,Yunnan | 25.32° | 101.87° | 2 272.3 |
| YN026 | 云南省安宁县 Anning,Yunnan | 24.86° | 102.45° | 2 043.8 |
| YN027 | 云南省安宁县 Anning,Yunnan | 24.82° | 102.42° | 2 123.4 |
| YN028 | 云南省安宁县 Anning,Yunnan | 24.85° | 102.39° | 1 950.0 |
| YN029 | 云南省昆明市 Kunming,Yunnan | 25.14° | 102.61° | 2 183.4 |
| YN030 | 云南省嵩明县 Songming,Yunnan | 25.41° | 103.04° | 2 084.8 |
| YN038 | 云南省昆明市 Kunming,Yunnan | 25.22° | 102.66° | 2 137.5 |
| YN039 | 云南省富民县 Fumin,Yunnan | 25.23° | 102.42° | 2 086.0 |
| YN040 | 云南省富民县 Fumin,Yunnan | 25.28° | 102.63° | 2 214.7 |
| YN041 | 云南省寻甸县 Xundian,Yunnan | 25.54° | 103.39° | 2 060.9 |
| YN044 | 云南省寻甸县 Xundian,Yunnan | 25.52° | 103.38° | 2 008.0 |
| YN050 | 云南省会泽县 Huize,Yunnan | 26.47° | 103.46° | 2 040.0 |
| YN052 | 云南省会泽县 Huize,Yunnan | 26.50° | 103.45° | 2 010.0 |
| YN058 | 云南省师宗县 Shizong,Yunnan | 24.91° | 103.87° | 2 156.0 |
| YN068 | 云南省砚山县 Yanshan,Yunnan | 23.77° | 104.68° | 1 656.0 |
表1 云南29个云南杨梅标准样地的相关信息
Table 1 Characteristics of the 29 study sites of Myrica nana shrub in Yunnan Province
| 样地编号 Site number | 样地地点 Site location | 纬度 Latitude (N) | 经度 Longitude (E) | 海拔 Altitude (m) |
|---|---|---|---|---|
| YN002 | 云南省姚安县 Yao’an,Yunnan | 25.52° | 101.40° | 2 220.6 |
| YN003 | 云南省姚安县 Yao’an,Yunnan | 25.49° | 101.31° | 2 623.1 |
| YN004 | 云南省姚安县 Yao’an,Yunnan | 25.50° | 101.15° | 2 093.3 |
| YN006 | 云南省大姚县 Dayao,Yunnan | 25.66° | 101.15° | 2 258.6 |
| YN010 | 云南省大姚县 Dayao,Yunnan | 25.71° | 101.48° | 2 120.4 |
| YN011 | 云南省大姚县 Dayao,Yunnan | 25.91° | 101.23° | 2 396.0 |
| YN013 | 云南省牟定县 Mouding,Yunnan | 25.45° | 101.46° | 2 037.9 |
| YN016 | 云南省牟定县 Mouding,Yunnan | 25.44° | 101.53° | 2 145.2 |
| YN017 | 云南省牟定县 Mouding,Yunnan | 25.45° | 101.63° | 2 245.0 |
| YN018 | 云南省南华县 Nanhua,Yunnan | 25.33° | 101.03° | 2 567.2 |
| YN019 | 云南省南华县 Nanhua,Yunnan | 25.17° | 101.06° | 2 392.4 |
| YN020 | 云南省南华县 Nanhua,Yunnan | 25.32° | 101.26° | 2 148.2 |
| YN022 | 云南省禄丰县 Lufeng,Yunnan | 25.31° | 102.12° | 2 113.1 |
| YN024 | 云南省禄丰县 Lufeng,Yunnan | 25.31° | 101.90° | 2 199.1 |
| YN025 | 云南省禄丰县 Lufeng,Yunnan | 25.32° | 101.87° | 2 272.3 |
| YN026 | 云南省安宁县 Anning,Yunnan | 24.86° | 102.45° | 2 043.8 |
| YN027 | 云南省安宁县 Anning,Yunnan | 24.82° | 102.42° | 2 123.4 |
| YN028 | 云南省安宁县 Anning,Yunnan | 24.85° | 102.39° | 1 950.0 |
| YN029 | 云南省昆明市 Kunming,Yunnan | 25.14° | 102.61° | 2 183.4 |
| YN030 | 云南省嵩明县 Songming,Yunnan | 25.41° | 103.04° | 2 084.8 |
| YN038 | 云南省昆明市 Kunming,Yunnan | 25.22° | 102.66° | 2 137.5 |
| YN039 | 云南省富民县 Fumin,Yunnan | 25.23° | 102.42° | 2 086.0 |
| YN040 | 云南省富民县 Fumin,Yunnan | 25.28° | 102.63° | 2 214.7 |
| YN041 | 云南省寻甸县 Xundian,Yunnan | 25.54° | 103.39° | 2 060.9 |
| YN044 | 云南省寻甸县 Xundian,Yunnan | 25.52° | 103.38° | 2 008.0 |
| YN050 | 云南省会泽县 Huize,Yunnan | 26.47° | 103.46° | 2 040.0 |
| YN052 | 云南省会泽县 Huize,Yunnan | 26.50° | 103.45° | 2 010.0 |
| YN058 | 云南省师宗县 Shizong,Yunnan | 24.91° | 103.87° | 2 156.0 |
| YN068 | 云南省砚山县 Yanshan,Yunnan | 23.77° | 104.68° | 1 656.0 |
| 变量 Variable | 数量 Number | 平均值 Mean (%) | 中值 Median (%) | 标偏差 Standard deviation | 最大值 Maximum (%) | 最小值 Minimum (%) | |
|---|---|---|---|---|---|---|---|
| C | 根 Root | 84 | 45.94 | 46.03 | 1.05 | 47.83 | 40.96 |
| 茎 Shoot | 83 | 46.32 | 46.48 | 0.69 | 47.74 | 43.89 | |
| 叶 Leaf | 84 | 49.05 | 49.25 | 1.03 | 51.03 | 43.97 | |
| N | 根 Root | 84 | 0.54 | 0.54 | 0.86 | 0.82 | 0.38 |
| 茎 Shoot | 84 | 0.58 | 0.56 | 0.12 | 0.93 | 0.40 | |
| 叶 Leaf | 84 | 1.70 | 1.73 | 0.23 | 2.15 | 0.29 | |
| P | 根 Root | 84 | 0.03 | 0.02 | 0.03 | 0.11 | 0.01 |
| 茎 Shoot | 84 | 0.03 | 0.02 | 0.02 | 0.09 | 0.01 | |
| 叶 Leaf | 84 | 0.06 | 0.05 | 0.02 | 0.14 | 0.03 | |
表2 云南杨梅C、N、P含量统计特征
Table 2 Statistics of carbon (C), nitrogen (N), and phosphorus (P) in Myrica nana
| 变量 Variable | 数量 Number | 平均值 Mean (%) | 中值 Median (%) | 标偏差 Standard deviation | 最大值 Maximum (%) | 最小值 Minimum (%) | |
|---|---|---|---|---|---|---|---|
| C | 根 Root | 84 | 45.94 | 46.03 | 1.05 | 47.83 | 40.96 |
| 茎 Shoot | 83 | 46.32 | 46.48 | 0.69 | 47.74 | 43.89 | |
| 叶 Leaf | 84 | 49.05 | 49.25 | 1.03 | 51.03 | 43.97 | |
| N | 根 Root | 84 | 0.54 | 0.54 | 0.86 | 0.82 | 0.38 |
| 茎 Shoot | 84 | 0.58 | 0.56 | 0.12 | 0.93 | 0.40 | |
| 叶 Leaf | 84 | 1.70 | 1.73 | 0.23 | 2.15 | 0.29 | |
| P | 根 Root | 84 | 0.03 | 0.02 | 0.03 | 0.11 | 0.01 |
| 茎 Shoot | 84 | 0.03 | 0.02 | 0.02 | 0.09 | 0.01 | |
| 叶 Leaf | 84 | 0.06 | 0.05 | 0.02 | 0.14 | 0.03 | |
| 部位 Part | 变量 Variable | 数量 Number | 平均值 Mean | 最大值 Maximum | 最小值 Minimum | 标准偏差 Standard Deviation |
|---|---|---|---|---|---|---|
| 根 Root | C:N | 84 | 86.6 | 120.0 | 57.1 | 13.5 |
| C:P | 84 | 2 559.8 | 5 189.6 | 419.7 | 1 494.8 | |
| N:P | 84 | 29.6 | 70.0 | 5.1 | 17.1 | |
| 茎 Stem | C:N | 83 | 82.2 | 116.3 | 49.9 | 14.5 |
| C:P | 83 | 2 656.2 | 7 235.8 | 514.4 | 1 515.5 | |
| N:P | 83 | 31.9 | 83.76 | 4.95 | 16.7 | |
| 叶 Leaf | C:N | 84 | 30.4 | 153.9 | 23.1 | 14.1 |
| C:P | 84 | 1 012.9 | 1 918.7 | 340.6 | 322.3 | |
| N:P | 84 | 34.2 | 64.6 | 9.1 | 9.8 |
表3 云南杨梅C、N、P化学计量统计特征
Table 3 Stoichiometric characteristic of carbon (C), nitrogen (N), and phosphorus (P) in Myrica nana
| 部位 Part | 变量 Variable | 数量 Number | 平均值 Mean | 最大值 Maximum | 最小值 Minimum | 标准偏差 Standard Deviation |
|---|---|---|---|---|---|---|
| 根 Root | C:N | 84 | 86.6 | 120.0 | 57.1 | 13.5 |
| C:P | 84 | 2 559.8 | 5 189.6 | 419.7 | 1 494.8 | |
| N:P | 84 | 29.6 | 70.0 | 5.1 | 17.1 | |
| 茎 Stem | C:N | 83 | 82.2 | 116.3 | 49.9 | 14.5 |
| C:P | 83 | 2 656.2 | 7 235.8 | 514.4 | 1 515.5 | |
| N:P | 83 | 31.9 | 83.76 | 4.95 | 16.7 | |
| 叶 Leaf | C:N | 84 | 30.4 | 153.9 | 23.1 | 14.1 |
| C:P | 84 | 1 012.9 | 1 918.7 | 340.6 | 322.3 | |
| N:P | 84 | 34.2 | 64.6 | 9.1 | 9.8 |
| 部位 Part | 项目 Element | 根 Root | 茎 Stem | 叶 Leaf | ||||||||
|---|---|---|---|---|---|---|---|---|---|---|---|---|
| C | N | P | C | N | P | C | N | P | ||||
| 根 Root | C | 1 | -0.025 | -0.020 | 0.43** | -0.03 | -0.10 | 0.43** | -0.09 | -0.27* | ||
| N | 1 | 0.080 | -0.27* | 0.20 | 0.25* | -0.23* | 0.20 | 0.42** | ||||
| P | 1 | -0.28* | -0.13 | 0.58** | -0.27* | 0.05 | 0.42** | |||||
| 茎 Stem | C | 1 | 0.14 | -0.53** | 0.65** | 0.01 | -0.57** | |||||
| N | 1 | 0.18 | -0.11 | 0.25* | 0.06 | |||||||
| P | 1 | -0.45** | 0.05 | 0.49** | ||||||||
| 叶 Leaf | C | 1 | 0.18 | -0.47** | ||||||||
| N | 1 | 0.43** | ||||||||||
| P | 1 | |||||||||||
表4 植物不同部位C、N、P含量的相关关系
Table 4 Relationship among carbon (C), nitrogen (N) and phosphorus (P) concentration in different parts of Myrica nana
| 部位 Part | 项目 Element | 根 Root | 茎 Stem | 叶 Leaf | ||||||||
|---|---|---|---|---|---|---|---|---|---|---|---|---|
| C | N | P | C | N | P | C | N | P | ||||
| 根 Root | C | 1 | -0.025 | -0.020 | 0.43** | -0.03 | -0.10 | 0.43** | -0.09 | -0.27* | ||
| N | 1 | 0.080 | -0.27* | 0.20 | 0.25* | -0.23* | 0.20 | 0.42** | ||||
| P | 1 | -0.28* | -0.13 | 0.58** | -0.27* | 0.05 | 0.42** | |||||
| 茎 Stem | C | 1 | 0.14 | -0.53** | 0.65** | 0.01 | -0.57** | |||||
| N | 1 | 0.18 | -0.11 | 0.25* | 0.06 | |||||||
| P | 1 | -0.45** | 0.05 | 0.49** | ||||||||
| 叶 Leaf | C | 1 | 0.18 | -0.47** | ||||||||
| N | 1 | 0.43** | ||||||||||
| P | 1 | |||||||||||
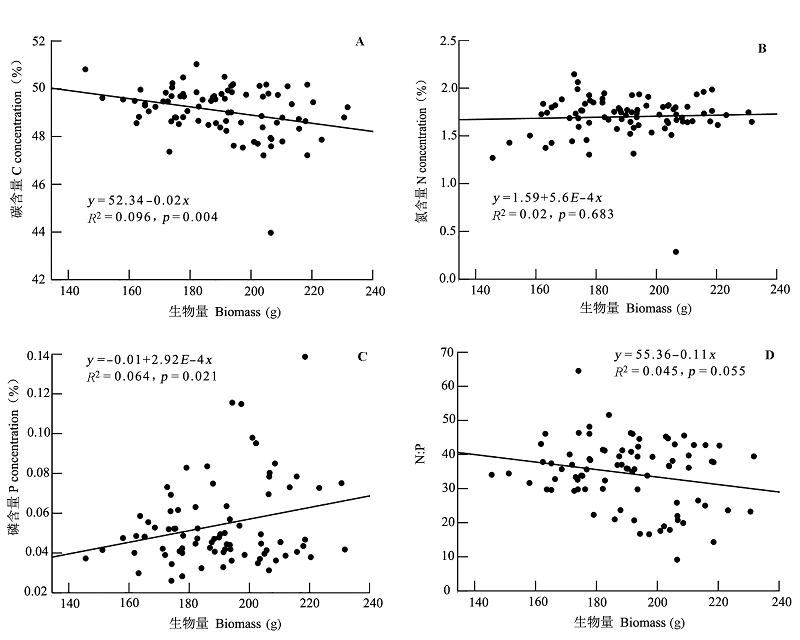
图1 云南杨梅生物量与叶片碳(A)、氮(B)、磷含量(C)及N:P (D)的关系。
Fig. 1 Relationship between biomass and C (A), N (B), and P (C) concentrations, N:P (D) of leaf of Myrica nana.
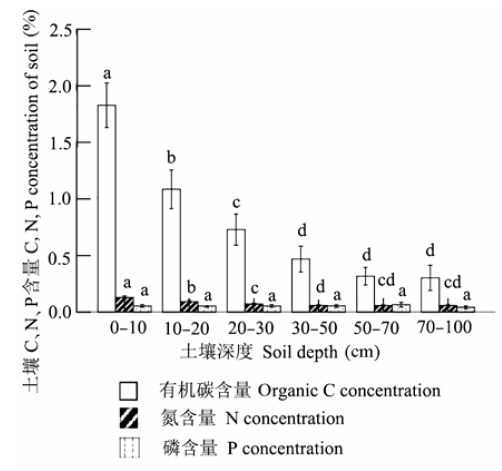
图2 土壤C、N、P含量(平均值±标准偏差)。不同小写字母表示差异显著(p < 0.05)。
Fig. 2 Soil C, N and P concentration (mean ± SD). Different lowercase letters indicate significant differences (p < 0.05).
| 元素 Element | 根 Root | 茎 Stem | 叶 Leaf | |||||||||
|---|---|---|---|---|---|---|---|---|---|---|---|---|
| C | N | P | C | N | P | C | N | P | ||||
| 表层土 Top soil | C | -0.09 | 0.10 | 0.14 | -0.25* | -0.11 | 0.10 | -0.07 | 0.16 | 0.29** | ||
| N | -0.16 | 0.15 | 0.16 | -0.29** | -0.02 | 0.16 | -0.17 | 0.18 | 0.31** | |||
| P | -0.27* | 0.33** | 0.32** | -0.39** | 0.07 | 0.57** | -0.39** | 0.21 | 0.46** | |||
表5 土壤C、N、P含量与云南杨梅C、N、P含量的相关性
Table 5 Correlation between soil and Myrica nana carbon (C), nitrogen (N) and phosphorus (P) concentrations
| 元素 Element | 根 Root | 茎 Stem | 叶 Leaf | |||||||||
|---|---|---|---|---|---|---|---|---|---|---|---|---|
| C | N | P | C | N | P | C | N | P | ||||
| 表层土 Top soil | C | -0.09 | 0.10 | 0.14 | -0.25* | -0.11 | 0.10 | -0.07 | 0.16 | 0.29** | ||
| N | -0.16 | 0.15 | 0.16 | -0.29** | -0.02 | 0.16 | -0.17 | 0.18 | 0.31** | |||
| P | -0.27* | 0.33** | 0.32** | -0.39** | 0.07 | 0.57** | -0.39** | 0.21 | 0.46** | |||
| [1] | Aerts R, Beltman B (2003). Is the relation between nutrient supply and biodiversity co-determined by the type of nutrient limitation?Oikos, 101, 489-498. |
| [2] | Aerts R, Chapin FS III (2000). The mineral nutrition of wild plants revisited: A re-evaluation of processes and patterns.Advances in Ecological Research, 30, 1-67. |
| [3] | Ågren GI (2008). Stoichiometry and nutrition of plant growth in natural communities.Ecology, Evolution, and Systematics, 39, 153-170. |
| [4] | Chen JQ, Zhang LL, Li J, Wen DZ, Peng ST (2014). Carbon, nitrogen and phosphorus stoichiometry of two fern species and their relationships to nutrient availability.Journal of Tropical and Subtropical Botany, 22, 567-575. (in Chinese with English abstract)[陈嘉茜, 张玲玲, 李炯, 温达志, 彭诗涛 (2014). 蕨类植物碳氮磷化学计量特征及其与土壤养分的关系. 热带亚热带植物学报, 22, 567-575.] |
| [5] | Cheng JG, Xie ME (2008). The analysis of regional climate change features over Yunnan in recent 50 years.Progress in Geography, 27, 19-26. (in Chinese with English abstract)[程建刚, 解明恩 (2008). 近50年云南区域气候变化特征分析. 地理科学进展, 27, 19-26.] |
| [6] | Diemer M (2004). The worldwide leaf economics spectrum.Nature, 428, 821-827. |
| [7] | Ding F, Lian PY, Zeng DH (2011). Characteristics of plant leaf nitrogen and phosphorus stoichiometry in relation to soil nitrogen and phosphorus concentrations in Songnen Plain meadow.Chinese Journal of Ecology, 30, 77-81. (in Chinese with English abstract)[丁凡, 廉培勇, 曾德慧 (2011). 松嫩平原草甸三种植物叶片N、P化学计量特征及其与土壤N、P浓度的关系. 生态学杂志, 30, 77-81.] |
| [8] | Editorial Board of Flora of China, Chinese Academy of Sciences (1979). Flora of China. Science Press, Beijing. (in Chinese)[中国科学院中国植物志编辑委员会 (1979). 中国植物志, 科学出版社, 北京.] |
| [9] | Ehleringer JR, Field CB (1993). Scaling Physiological Processes: Leaf to Globe. Academic Press, San Diego, USA. |
| [10] | Elser JJ, Fagan WF, Denno RF, Dobberfuhl DR, Folarin A, Huberty A, Interlandi S, Kilham SS, McCauley E, Schulz KL (2000a). Nutritional constraints in terrestrial and freshwater food webs.Nature, 408, 578-580. |
| [11] | Elser JJ, Fagan WF, Kerkhoff AJ, Swenson NG, Enquist BJ (2010). Biological stoichiometry of plant production: Metabolism, scaling and ecological response to global change. New Phytologist, 186, 593-608. |
| [12] | Elser JJ, Sterner RW, Gorokhova E, Fagan WF, Markow TA, Cotner JB, Harrison JF, Hobbie SE, Odell GM, Weider LW (2000b). Biological stoichiometry from genes to ecosystems.Ecology Letters, 3, 540-550. |
| [13] | Geng Y, Wu Y, He JS (2011). Relationship between leaf phosphorus concentration and soil phosphorus availability across Inner Mongolia grassland.Chinese Journal of Plant Ecology, 35, 1-8. (in Chinese with English abstract)[耿燕, 吴漪, 贺金生 (2011). 内蒙古草地叶片磷含量与土壤有效磷的关系. 植物生态学报, 35, 1-8.] |
| [14] | Gong HD, Cheng XP, Ma YW (2012). Characteristics of biomass distribution in Myrica nana. Nonwood Forest Research, 30(4), 106-108. (in Chinese with English abstract)[巩合德, 程希平, 马月伟 (2012). 云南杨梅灌丛生物量的分配特征. 经济林研究, 30(4), 106-108.] |
| [15] | Güsewell S (2004). N:P ratios in terrestrial plants: Variation and functional significance.New Phytologist, 164, 243-266. |
| [16] | Güsewell S (2005). Nutrient resorption of wetland graminoids is related to the type of nutrient limitation.Functional Ecology, 19, 344-354. |
| [17] | Güsewell S, Bailey KM, Roem WJ, Bedford BL (2005). Nutrient limitation and botanical diversity in wetlands: Can fertilization raise species richness?Oikos, 109, 71-80. |
| [18] | Han WX, Fang JY, Guo DL, Zhang Y (2005). Leaf nitrogen and phosphorus stoichiometry across 753 terrestrial plant species in China.New Phytologist, 168, 377-385. |
| [19] | Han WX, Tang LY, Chen YH, Fang JY (2013). Relationship between the relative limitation and resorption efficiency of nitrogen vs phosphorus in woody plants. PLOS ONE, 8(12), e83366. doi: 10.1371/journal.pone.0083366. |
| [20] | Han WX, Wu Q, Tang LY, Chen YH, Li LP, He JS, Fang JY (2009). Leaf carbon, nitrogen and phosphorus stoichiometry across plant species in Beijing and its periphery.Acta Scientiarum Naturalium Universitatis Pekinensi, 45, 855-860. (in Chinese with English abstract)[韩文轩, 吴漪, 汤璐瑛, 陈雅涵, 李利平, 贺金生, 方精云 (2009). 北京及周边地区植物叶的碳氮磷元素计量特征. 北京大学学报(自然科学版), 45, 855-860.] |
| [21] | Harpole WS, Ngai JT, Cleland EE, Seabloom EW, Borer ET, Bracken MES, Elser JJ, Gruner DS, Hillebrand H, Shurin JB, Smith JE (2011). Nutrient co-limitation of primary producer communities.Ecology Letters, 14, 852-862. |
| [22] | He JJ, Cai GQ, Tian L, Fang HY (2010). Effect of vegetation measures on the soil conservation and factors analysis.Chinese Journal of Soil Science, 41, 706-710. (in Chinese with English abstract)[和继军, 蔡国强, 田磊, 方海燕 (2010). 植被措施对土壤保育的作用及其影响因素分析. 土壤通报, 41, 706-710.] |
| [23] | He JS, Wang L, Flynn DF, Wang XP, Ma WH, Fang JY (2008). Leaf nitrogen:phosphorus stoichiometry across Chinese grassland biomes.Oecologia, 155, 301-10. |
| [24] | Hong JT, Wu JB, Wang XD (2013). Effects of global climate change on the C, N, and P stoichiometry of terrestrial plants.Chinese Journal of Applied Ecology, 24, 2658-2665. (in Chinese with English abstract)[洪江涛, 吴建波, 王小丹 (2013). 全球气候变化对陆地植物碳氮磷生态化学计量学特征的影响. 应用生态学报, 24, 2658-2665.] |
| [25] | Hou XY (1982). Chinese Vegetation Geology and Chemical Content of Dominant Plants. Science Press, Beijing. (in Chinese)[侯学煜 (1982). 中国植被地理及优势植物化学成分. 科学出版社, 北京.] |
| [26] | Huguet V, Batzli JM, Zimpfer JF, Normand P, Dawson JO, Fernandez MP (2001). Diversity and specificity of Frankia strains in nodules of sympatric Myrica gale, Alnus incana, and Shepherdia canadensis determined by rrs gene poly- morphism. Applied and Environmental Microbiology, 67, 2116-2122. |
| [27] | Jackson RB, Banner JL, Jobbágy EG, Pockman WT, Wall DH (2002). Ecosystem carbon loss with woody plant invasion of grasslands.Nature, 418, 623-626. |
| [28] | Koerselman W, Meuleman AFM (1996). The vegetation N:P ratio: A new tool to detect the nature of nutrient limitation.Journal of Applied Ecology, 33, 1441-1450. |
| [29] | Li J, Shi YL, Chen ZW (2011). Research on phosphorus in southern red soils of in China.Chinese Journal of Soil Science, 42, 763-768. (in Chinese with English abstract)[李杰, 石元亮, 陈智文 (2011). 我国南方红壤磷素研究概况. 土壤通报, 42, 763-768.] |
| [30] | Liu GH, Ma KM, Fu BJ, Guan WB, Kang YX, Zhou JY, Liu SL (2003). Above ground biomass of main shrubs in dry valley of Minjing river. Acta Ecologica Sinica, 23, 1757-1764. (in Chinese with English abstract)[刘国华, 马克明, 傅伯杰, 关文彬, 康永祥, 周建云, 刘世梁(2003). 岷江干旱河谷主要灌丛类型地上生物量研究. 生态学报, 23, 1757-1764.] |
| [31] | Marschner H (1995). Mineral Nutrition of Higher Plants. Academic Press, New York. |
| [32] | Mcgroddy ME, Daufresne T, Hedin LO (2004). Scaling of C:N:P stoichiometry in forests worldwide: Implications of terrestrial Redfield-type ratios.Ecology, 85, 2390-2401. |
| [33] | Niklas KJ, Owens T, Reich P, Cobb ED (2005). Nitrogen/ phosphorus leaf stoichiometry and the scaling of plant growth.Ecology Letters, 8, 636-642. |
| [34] | Niu DC, Li Q, Jiang SG, Chang PJ, Fu H (2013). Seasonal variations of leaf C:N:P stoichiometry of six shrubs in desert of China’s Alxa Plateau.Chinese Journal of Plant Ecology, 37, 317-325. (in Chinese with English abstract)[牛得草, 李茜, 江世高, 常佩静, 傅华 (2013). 阿拉善荒漠区6种主要灌木植物叶片C:N:P化学计量比的季节变化. 植物生态学报, 37, 317-325.] |
| [35] | Pan J, Song NP, Wu XD, Yang XG, Chen L, Qu WJ (2015). Effects of different planting-years of artificial Caragana intermedia shrubs on soil organic carbon, nitrogen and phosphorus stoichiometry characteristics in desert steppe. Journal of Zhejiang University (Agriculture & Life Sciences), 41, 160-168. (in Chinese with English abstract)[潘军, 宋乃平, 吴旭东, 杨新国, 陈林, 曲文杰 (2015). 荒漠草原不同种植年限人工柠条林土壤碳氮磷化学计量特征. 浙江大学学报(农业与生命科学版), 41, 160-168.] |
| [36] | Pan P, Gan WF, Ouyang XZ, Xiao X (2014). Relationship between the contents of soil organic carbon, total nitrogen, total phosphorus and soil organic carbon density ofPinus massoniana nature forest. Journal of Northwest Forest University, 29(6), 1-5. (in Chinese with English abstract)[潘鹏, 甘文峰, 欧阳勋志, 肖欣 (2014). 马尾松天然林土壤碳氮磷含量与碳密度的关系. 西北林学院学报, 29(6), 1-5.] |
| [37] | Ren SJ, Yu GR, Jiang CM, Fang HJ, Sun XM (2012). Stoichiometric characteristics of leaf carbon, nitrogen, and phosphorus of 102 dominant species in forest ecosystems along the North-South Transect of East China.Chinese Journal of Applied Ecology, 23, 119-124. (in Chinese with English abstract)[任书杰, 于贵瑞, 姜春明, 方华军, 孙晓敏 (2012). 中国东部南北样带森林生态系统102个优势种叶片碳氮磷化学计量学统计特征. 应用生态学报, 23, 119-124.] |
| [38] | Shao XX, Li WH, Wu M, Yang WY, Jiang KY, Ye XQ (2013). Dynamics of carbon, nitrogen and phosphorus storage of three dominant marsh plants in Hangzhou Bay coastal wetland.Environmental Science, 4, 3451-3457. (in Chinese with English abstract)[邵学新, 李文华, 吴明, 杨文英, 蒋科毅, 叶小齐 (2013). 杭州湾潮滩湿地3种优势植物碳氮磷储量特征研究. 环境科学, 4, 3451-3457.] |
| [39] | Sterner RW, Elser JJ (2002). Ecological Stoichiometry: The Biology of Elements from Molecules to the Biosphere. Princeton University Press, Princeton. |
| [40] | Sturm M, Racine CH, Tape KD (2001). Increasing shrub abundance in the arctic.Nature, 411, 546-547. |
| [41] | van de Waal DB, Verschoor AM, Verspagen JMH, van Donk E, Huisman J (2010). Climate-driven changes in the ecological stoichiometry of aquatic ecosystems.Frontiers in Ecology & the Environment, 8, 145-152. |
| [42] | van der Heijden MGA, Bardgett RD, van Straalen NM (2008). The unseen majority: Soil microbes as drivers of plant diversity and productivity in terrestrial ecosystems.Ecology Letters, 11, 296-310. |
| [43] | Venterink HO, Wassen MJ, Verkroost AWM, de Ruiter PC (2003). Species richness-productivity patterns differ between N-, P-, and K-limited wetlands.Ecology, 84, 2191-2199. |
| [44] | Vitousek PM (1982). Nutrient cycling and nutrient use efficiency.American Naturalist, 119, 553-573. |
| [45] | Vitousek PM, Farrington H (1997). Nutrient limitation and soil development: Experimental test of a biogeochemical theory.Biogeochemistry, 37, 63-75. |
| [46] | von Oheimb G, Power SA, Falk K, Friedrich U, Mohamed A, Krug A, Boschatzke N, Härdtle W (2010). N:P ratio and the nature of nutrient limitation in Calluna-dominated heathlands. Ecosystems, 13, 317-327. |
| [47] | Wang HY, Huang WN (1992). Characteristics of symbiotic nitrogen fixation byMyrica rubra. Fujian Journal of Agricultural Science, 7(2), 48-52. (in Chinese with English abstract)[王慧英, 黄维南 (1992). 杨梅根瘤的共生固氮特性. 福建农业学报, 7(2), 48-52.] |
| [48] | Wang JY, Wang SQ, Li RL, Yan JH, Sha LQ, Han SJ (2011). C:N:P stoichiometric characteristics of four forest types’ dominant tree species in China.Chinese Journal of Plant Ecology, 35, 587-595. (in Chinese with English abstract)[王晶苑, 王绍强, 李纫兰, 闫俊华, 沙丽清, 韩士杰 (2011). 中国四种森林类型主要优势植物的C:N:P化学计量学特征. 植物生态学报, 35, 587-595.] |
| [49] | Wang SQ, Yu GR (2008). Ecological stoichiometry charac- teristics of ecosystem carbon, nitrogen and phosphorus elements.Acta Ecologica Sinica, 8, 3937-3947. (in Chinese with English abstract)[王绍强, 于贵瑞 (2008). 生态系统碳氮磷元素的生态化学计量学特征. 生态学报, 8, 3937-3947.] |
| [50] | Wright IJ, Reich PB, Westoby M (2001). Strategy shifts in leaf physiology, structure and nutrient content between species of high- and low-rainfall and high- and low-nutrient habitats.Functional Ecology, 15, 423-434. |
| [51] | Wu PF, Ma QX (2009). Research advances in the mechanisms of high nutrient use efficiency in plants.Acta Ecologica Sinica, 29, 427-437. (in Chinese with English abstract)[吴鹏飞, 马祥庆 (2009). 植物养分高效利用机制研究进展. 生态学报, 29, 427-437.] |
| [52] | Wu XL, Gu XP (1994). A study on the characteristics ofMyrica rubra in nodulation and nitrogen fixation. Forest Research, 3, 306-310. (in Chinese with English abstract)[吴晓丽, 顾小平 (1994). 杨梅结瘤固氮特性研究. 林业科学研究, 3, 306-310.] |
| [53] | Xie HT, He XD, You WX, Yu D, Liu HF, Wang JL, Gu S, Nie QH, Liang YT, Zhang JL (2016). Effects of ecological stoichiometry on biomass and species diversity of the Artemisia ordosica community in Habahu National Nature Reserve. Acta Ecologica Sinica, 36, 3621-3627. (in Chinese with English abstract)[颉洪涛, 何兴东, 尤万学, 余殿, 刘惠芬, 王金龙, 古松, 聂庆华, 梁玉婷, 张京磊 (2016). 哈巴湖国家级自然保护区油蒿群落生态化学计量特征对群落生物量和物种多样性的影响. 生态学报, 36, 3621-3627.] |
| [54] | Yan BG, Liu GC, Fan B, He GX, Shi LT, Li JC, Ji ZH (2015). Relationships between plant stoichiometry and biomass in an arid-hot valley, Southwest China.Chinese Journal of Plant Ecology, 39, 807-815. (in Chinese with English abstract)[闫帮国, 刘刚才, 樊博, 何光熊, 史亮涛, 李纪潮, 纪中华 (2015). 干热河谷植物化学计量特征与生物量之间的关系. 植物生态学报, 35, 807-815.] |
| [55] | Yan ZB, Kim NY, Han TS, Fang JY, Han WY (2013). Effects of nitrogen and phosphorus fertilization on leaf carbon, nitrogen and phosphorus stoichiometry of Arabidopsis thaliana. Chinese Journal of Plant Ecology, 37, 551-557. (in Chinese with English abstract)[严正兵, 金南瑛, 韩廷申, 方精云, 韩文轩 (2013). 氮磷施肥对拟南芥叶片碳氮磷化学计量特征的影响. 植物生态学报, 37, 551-557.] |
| [56] | Yin XR, Liang CZ, Wang LX, Wang W, Liu ZL, Liu XP (2010). Ecological stoichiometry of plant nutrients at different restoration succession stages in typical steppe of Inner Mongolia, China.Chinese Journal of Plant Ecology, 34, 39-47. (in Chinese with English abstract)[银晓瑞, 梁存柱, 王立新, 王炜, 刘钟龄, 刘小平 (2010). 内蒙古典型草原不同恢复演替阶段植物养分化学计量学. 植物生态学报, 34, 39-47.] |
| [57] | Zeng DH, Chen GS (2005). Ecological stoichiometry: A science to explore the complexity of living systems.Acta Phytoecologica Sinica, 29, 1007-1019. (in Chinese with English abstract)[曾德慧, 陈广生 (2005). 生态化学计量学:复杂生命系统奥秘的探索. 植物生态学报, 29, 1007-1019.] |
| [58] | Zhang WY, Fan JW, Zhong HP, Hu ZM, Song LL, Wang N (2010). The nitrogen: phosphorus stoichiometry of different plant functional groups for dominant species of typical steppes in China.Acta Agrestia Sinica, 18, 503-509. (in Chinese with English abstract)[张文彦, 樊江文, 钟华平, 胡中民, 宋璐璐, 王宁 (2010). 中国典型草原优势植物功能群氮磷化学计量学特征研究. 草地学报, 18, 503-509.] |
| [59] | Zhao Q, Zeng DH (2005). Phosphorus cycling in terrestrial ecosystems and its controlling factors.Acta Phytoe- cologica Sinica, 29, 153-163. (in Chinese with English abstract)[赵琼, 曾德慧 (2005). 陆地生态系统磷素循环及其影响因素. 植物生态学报, 29, 153-163.] |
| [60] | Zhao QG, Huang GQ, Ma YQ (2013). The problems in red soil ecosystem in southern of China and its countermeasures.Acta Ecologica Sinica, 33, 7615-7622. (in Chinese with English abstract)[赵其国, 黄国勤, 马艳芹 (2013). 中国南方红壤生态系统面临的问题及对策. 生态学报, 33, 7615-7622.] |
| [61] | Zheng S, Shangguan Z (2007). Spatial patterns of leaf nutrient traits of the plants in the Loess Plateau of China.Trees, 21, 357-370. |
| [62] | Zheng WJ, Bao WK, Gu B, He X, Leng L (2007). Carbon concentration and its characteristics in terrestrial higher plant.Chinese Journal of Ecology, 26, 307-313. (in Chinese with English abstract)[郑帷婕, 包维楷, 辜彬, 何晓, 冷俐 (2007). 陆生高等植物碳含量及其特点. 生态学杂志, 26, 307-313.] |
| [1] | 韩路 冯宇 李沅楷 王雨晴 王海珍. 地下水埋深对灰胡杨叶片与土壤养分生态化学计量特征及其内稳性的影响[J]. 植物生态学报, 2024, 48(预发表): 0-0. |
| [2] | 韩大勇 李海燕 张维 杨允菲. 松嫩草地全叶马兰种群分株养分的季节运转及衰老过程[J]. 植物生态学报, 2024, 48(预发表): 0-0. |
| [3] | 舒韦维 杨坤 马俊旭 闵惠琳 陈琳 刘士玲 黄日逸 明安刚 明财道 田祖为. 氮添加对红锥不同序级细根形态和化学性状的影响[J]. 植物生态学报, 2024, 48(预发表): 0-0. |
| [4] | 耿雪琪 唐亚坤 王丽娜 邓旭 张泽凌 周莹. 氮添加增加中国陆生植物生物量并降低其氮利用效率[J]. 植物生态学报, 2024, 48(预发表): 0-0. |
| [5] | 龙吉兰 蒋铮 刘定琴 缪宇轩 周灵燕 冯颖 裴佳宁 刘瑞强 周旭辉 伏玉玲. 干旱下植物根系分泌物及其介导的根际激发效应研究进展[J]. 植物生态学报, 2024, 48(预发表): 0-0. |
| [6] | 陈保冬 付伟 伍松林 朱永官. 菌根真菌在陆地生态系统碳循环中的作用[J]. 植物生态学报, 2024, 48(1): 0-0. |
| [7] | 李冰, 朱湾湾, 韩翠, 余海龙, 黄菊莹. 降水量变化下荒漠草原土壤呼吸及其影响因素[J]. 植物生态学报, 2023, 47(9): 1310-1321. |
| [8] | 张英, 张常洪, 汪其同, 朱晓敏, 尹华军. 氮沉降下西南山地针叶林根际和非根际土壤固碳贡献差异[J]. 植物生态学报, 2023, 47(9): 1234-1244. |
| [9] | 韩聪, 母艳梅, 查天山, 秦树高, 刘鹏, 田赟, 贾昕. 2012-2016年宁夏盐池毛乌素沙地黑沙蒿灌丛生态系统通量观测数据集[J]. 植物生态学报, 2023, 47(9): 1322-1332. |
| [10] | 李娜, 唐士明, 郭建英, 田茹, 王姗, 胡冰, 罗永红, 徐柱文. 放牧对内蒙古草地植物群落特征影响的meta分析[J]. 植物生态学报, 2023, 47(9): 1256-1269. |
| [11] | 陈颖洁, 房凯, 秦书琪, 郭彦军, 杨元合. 内蒙古温带草地土壤有机碳组分含量和分解速率的空间格局及其影响因素[J]. 植物生态学报, 2023, 47(9): 1245-1255. |
| [12] | 李伯新, 姜超, 孙建新. CMIP6模式对中国西南部地区植被碳利用率模拟能力综合评估[J]. 植物生态学报, 2023, 47(9): 1211-1224. |
| [13] | 赵艳超, 陈立同. 土壤养分对青藏高原高寒草地生物量响应增温的调节作用[J]. 植物生态学报, 2023, 47(8): 1071-1081. |
| [14] | 吴晨, 陈心怡, 刘源豪, 黄锦学, 熊德成. 增温对森林细根生长、死亡及周转特征影响的研究进展[J]. 植物生态学报, 2023, 47(8): 1043-1054. |
| [15] | 苏炜, 陈平, 吴婷, 刘岳, 宋雨婷, 刘旭军, 刘菊秀. 氮添加与干季延长对降香黄檀幼苗非结构性碳水化合物、养分与生物量的影响[J]. 植物生态学报, 2023, 47(8): 1094-1104. |
| 阅读次数 | ||||||
|
全文 |
|
|||||
|
摘要 |
|
|||||
Copyright © 2022 版权所有 《植物生态学报》编辑部
地址: 北京香山南辛村20号, 邮编: 100093
Tel.: 010-62836134, 62836138; Fax: 010-82599431; E-mail: apes@ibcas.ac.cn, cjpe@ibcas.ac.cn
备案号: 京ICP备16067583号-19