
Chin J Plant Ecol ›› 2007, Vol. 31 ›› Issue (5): 787-793.DOI: 10.17521/cjpe.2007.0100
• Research Articles • Previous Articles Next Articles
YANG Pei-Guo1,2,3, LI Bao-Guo1,*( ), LÜ Yi-Zhong1, WU Shao-Hong2, LI Jing2,3
Received:2006-03-28
Accepted:2006-09-13
Online:2007-03-28
Published:2007-09-30
Contact:
LI Bao-Guo
YANG Pei-Guo, LI Bao-Guo, LÜ Yi-Zhong, WU Shao-Hong, LI Jing. SIMULATION OF NET PRIMARY PRODUCTION IN KAOKAOLAIGOU WATERSHED, CHINA[J]. Chin J Plant Ecol, 2007, 31(5): 787-793.
Add to citation manager EndNote|Ris|BibTeX
URL: https://www.plant-ecology.com/EN/10.17521/cjpe.2007.0100
| 样点号No. of sample | NPP | Rn | W |
|---|---|---|---|
| 1 | 98.69 | 999.11 | 392.29 |
| 2 | 133.32 | 1 038.64 | 424.84 |
| 3 | 140.51 | 1 041.23 | 430.51 |
| 4 | 96.55 | 971.57 | 387.26 |
| 5 | 126.08 | 1 026.20 | 414.14 |
| 6 | 175.51 | 1 112.03 | 446.17 |
| 7 | 109.55 | 1 004.73 | 398.21 |
| 8 | 82.97 | 949.06 | 362.08 |
| 9 | 191.08 | 1 254.39 | 456.32 |
| 10 | 201.08 | 1 298.42 | 488.93 |
| 11 | 122.12 | 1 015.51 | 403.88 |
| 12 | 224.63 | 1 343.38 | 537.18 |
| 13 | 95.38 | 959.90 | 376.00 |
| 14 | 185.77 | 1 176.67 | 448.93 |
| 15 | 145.42 | 1 055.68 | 436.59 |
Table 1 The input data in the line 1
| 样点号No. of sample | NPP | Rn | W |
|---|---|---|---|
| 1 | 98.69 | 999.11 | 392.29 |
| 2 | 133.32 | 1 038.64 | 424.84 |
| 3 | 140.51 | 1 041.23 | 430.51 |
| 4 | 96.55 | 971.57 | 387.26 |
| 5 | 126.08 | 1 026.20 | 414.14 |
| 6 | 175.51 | 1 112.03 | 446.17 |
| 7 | 109.55 | 1 004.73 | 398.21 |
| 8 | 82.97 | 949.06 | 362.08 |
| 9 | 191.08 | 1 254.39 | 456.32 |
| 10 | 201.08 | 1 298.42 | 488.93 |
| 11 | 122.12 | 1 015.51 | 403.88 |
| 12 | 224.63 | 1 343.38 | 537.18 |
| 13 | 95.38 | 959.90 | 376.00 |
| 14 | 185.77 | 1 176.67 | 448.93 |
| 15 | 145.42 | 1 055.68 | 436.59 |
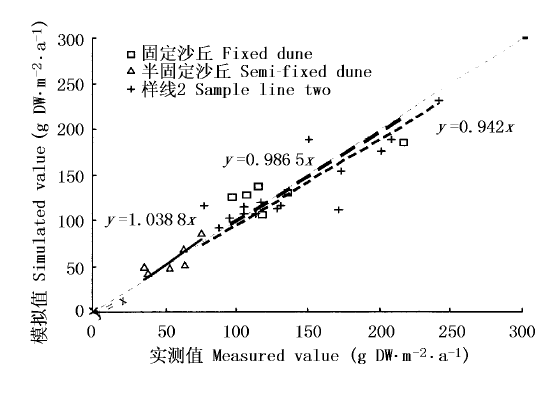
Fig.1 Comparison of simulated values and measured value at different sites in study area
| 名称 Name | 固定沙丘 Fixed dune | 半固定沙丘 Semi-fixed dune | 样线2 Sample line 2 |
|---|---|---|---|
| 相对误差(%) Relative error | 3.79 | 3.22 | 6.27 |
| 偏斜度 Measure of skewness | 4.43 | 0.58 | -12.84 |
Table 2 Relative error and bias of linear regression equation with 1 between measured and simulated value
| 名称 Name | 固定沙丘 Fixed dune | 半固定沙丘 Semi-fixed dune | 样线2 Sample line 2 |
|---|---|---|---|
| 相对误差(%) Relative error | 3.79 | 3.22 | 6.27 |
| 偏斜度 Measure of skewness | 4.43 | 0.58 | -12.84 |
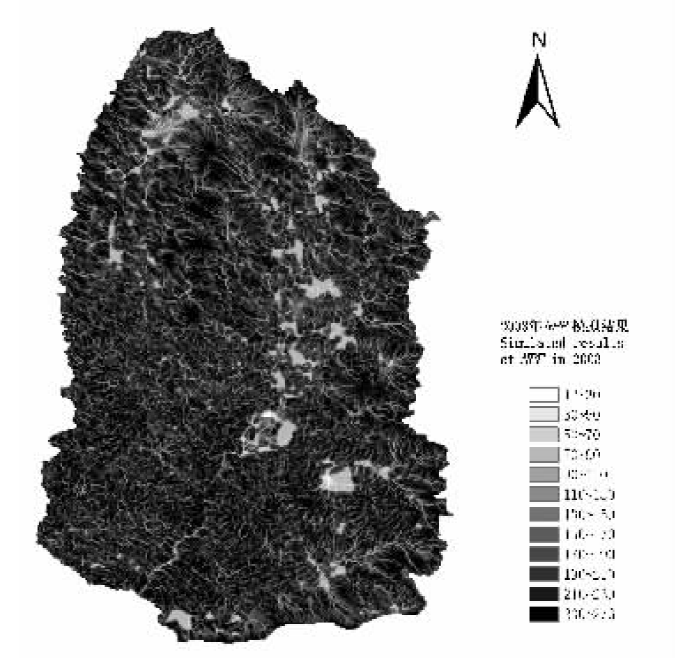
Fig.2 The distribution of net primary production (NPP) (g DW·m-2·a-1) in study area
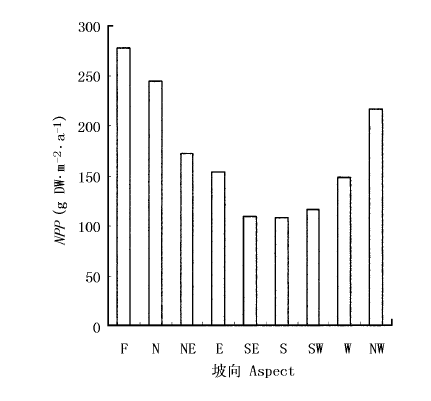
Fig.3 The distribution of net primary production (NPP) on different aspects
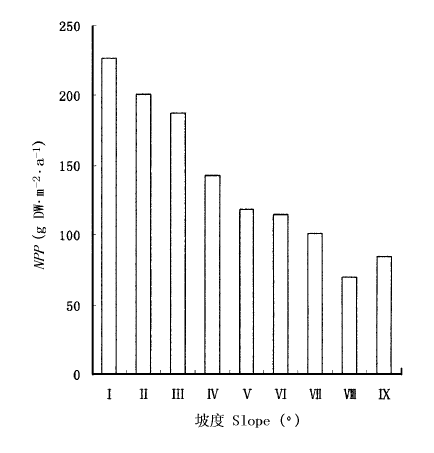
Fig.4 The distribution of net primary production (NPP) in different slopes Ⅰ: 0°~1° Ⅱ: 1°~3° Ⅲ: 3°~5° Ⅳ: 5°~7° Ⅴ: 7°~10° Ⅵ: 10°~15° Ⅶ: 15°~20° Ⅷ: 20°~25° Ⅸ: >25°
| [1] | Dong M (董鸣) (1997). Investigation and Analysis of the Terrestrial Biocommunities (陆地生物群落调查观测与分析). Standards Press of China, Beijing. (in Chinese) |
| [2] | Fang JY (2000). Forest productivity in China and its responses to global climate changes. Acta Phytoecologica Sinica (植物生态学报), 24,513-517. |
| [3] |
Field CB, Behrenfeld MJ, Randerson JT, Falkowski P (1998). Primary production of the biosphere: integrating terrestrial and oceanic components. Science, 281,237-240.
URL PMID |
| [4] | Foley JA (1994). Net primary productivity in the terrestrial bio-sphere: the application of a global model. Journal of Geophysical Resource, 99(D10),20773-20783. |
| [5] | Fu BP (傅抱璞) (1998). The differences and variations in components of radiation budget on underlying surfaces of different topographies. Chinese Journal of Atmospheric Sciences (大气科学), 22,178-190. (in Chinese with English abstract) |
| [6] | Fu BP (傅抱璞) (1983). Mountain Climate (山地气候).Science Press, Beijing,61-72. (in Chinese) |
| [7] | Hou GL (侯光良), You SC (游松才) (1990). To calculate China's plant-climate productive potentialities by Chikuzo model. Journal of Natural Resources (自然资源学报), 5,60-65. (in Chinese with English abstract) |
| [8] | Li DQ (李迪强), Sun CY (孙成永), Zhang XS (张新时) (1998). Modelling the net primary productivity of the natural potential vegetation in China. Acta Botanica Sinica (植物学报), 40,560-566. (in Chinese with English abstract) |
| [9] | Matsushita BK, Yang CF (杨翠芬), Chen J (陈晋), Wang QX (王勤学), Kameyama STS, Tamura MSYK (2004). Accurate estimation of net primary productivity of terrestrial ecosystem at a regional scale. Acta Geographica Sinica (地理学报), 59,80-87. (in Chinese with English abstract) |
| [10] | Meiillo JM, McGuire AD (1993). Global climate change and terrestrial net primary production. Nature, 363,234-240. |
| [11] | Ni J (倪健) (2002). BIOME models: main principles and applications. Acta Phytoecologica Sinica (植物生态学报), 26,481-488. (in Chinese with English abstract) |
| [12] | Niu ZG (牛振国), Li BG (李保国), Zhang FR (张凤荣) (2003). Modeling of soil water replenishment in catchments based on GIS. Journal of Hydraulic Engineering (水利学报), 2,73-77. (in Chinese with English abstract) |
| [13] | Niu ZG (牛振国), Li BG (李保国), Zhang FR (张凤荣), Chen HW (陈焕伟) (2002). A distributed model of reference evapotranspiration based on the DEM. Advances in Water Science (水科学进展), 13,303-307. (in Chinese with English abstract) |
| [14] | Paruelo JM (1997). A NPP estimates from NDVI for the central grassland region of the United States. Ecology, 78,953-958. |
| [15] | Piao SL (朴世龙), Fang JY (方精云), Guo QH (郭庆华) (2001). Application of CASA model to the estimation of Chinese terrestrial net primary productivity. Acta Phytoecologica Sinica (植物生态学报), 25,603-608. (in Chinese with English abstract) |
| [16] | Potter CS (1999). Terrestrial biomass and effects of deforestation on the global carbon cycle-results from a model of primary production using satellite observations. BioScience, 49,769-778. |
| [17] | Potter CS, Randerson JT (1993). Terrestrial ecosystem production: a process model based on global satellite and surface data. Global Biogeochemical Cycles, 7,811-841. |
| [18] | Smith M (1991). Report on the Expert Consultation on Revision of FAO Methodologies for Crop Water Requirements. Land and Water Development Division, Food and Agriculture Organization, Rome, 54. |
| [19] | Sun R (孙睿), Zhu QJ (朱启疆) (2001). Effect of climate change of terrestrial net primary productivity in China. Journal of Remote Sensing (遥感学报), 5,58-61. (in Chinese with English abstract) |
| [20] | Sun R (孙睿), Zhu QJ (朱启疆) (1999). Net primary productivity of terrestrial vegetation—a review on related researches. Chinese Journal of Applied Ecology (应用生态学报), 10,757-760. (in Chinese with English abstract) |
| [21] | Uchijima Z, Seino H (1985). Agroclimatic evaluation of net primary productivity of nature vegetation (1): Chikugo model for evaluating primary productivity. Journal of Agricultural Meteorology, 40,343-352. |
| [22] | Yan SJ (闫淑君), Hong W (洪伟), Wu CZ (吴承祯), Bi XL (毕晓丽) (2001). Modification of natural vegetation NPP model. Acta Agriculturae Universitatis Jiangxiensis (江西农业大学学报), 23,248-252. (in Chinese with English abstract) |
| [23] | Yang YH (杨永辉), Wang ZP (王智平), Sakura YS, Tang CY (唐常源), Shindo SZ (2002). Effects of global warming on productivity and soil moisture in Taihang Mountain: a transplant study. Chinese Journal of Applied Ecology (应用生态学报), 13,667-671. (in Chinese with English abstract) |
| [24] | Zhang H (张洪), Fan ZL (樊自立) (2000). Studies on a NPP model of salinized meadow in the north of Tarim Basin. Acta Phytoecologica Sinica (植物生态学报), 24,13-17. (in Chinese with English abstract) |
| [25] | Zhang JH (张佳华) (2001). Study on models for evaluation primary productivity of natural vegetation and corp yield. Acta Agriculturae Shanghai (上海农业学报), 17,83-89. (in Chinese with English abstract) |
| [26] | Zhang XZ (张宪洲) (1993). The estimation and distribution of net primary productivity of natural vegetation in China. Resources Science (资源科学), 1,15-21. (in Chinese with English abstract) |
| [27] | Zheng YR (郑元润), Zhou GS (周广胜) (2000). A forest vegetation NPP model based on NDVI. Acta Phytoecologica Sinica (植物生态学报), 24,9-12. (in Chinese with English abstract) |
| [28] | Zhou GS (周广胜), Zhang XS (张新时) (1995). A natural vegetation NPP model. Acta Phytoecologica Sinica (植物生态学报), 19,193-200. (in Chinese with English abstract) |
| [29] | Zhou GS (周广胜), Zhang XS (张新时) (1996). Study on NPP of natural vegetation in China under global climate change. Acta Phytoecologica Sinica (植物生态学报), 20,11-19. (in Chinese with English abstract) |
| [30] | Zhou T (周涛), Shi PJ (史培军), Sun R (孙睿), Wang SQ (王绍强) (2004). The impacts of climate change on net ecosystem production in China. Acta Geographica Sinica (地理学报), 59,357-365. (in Chinese with English abstract) |
| [31] | Zhu ZH (朱志辉) (1993). The model of estimating net primary productivity of natural vegetaion. Chinese Science Bulletin (科学通报), 38,1422-1426. (in Chinese with English abstract) |
| Viewed | ||||||
|
Full text |
|
|||||
|
Abstract |
|
|||||
Copyright © 2022 Chinese Journal of Plant Ecology
Tel: 010-62836134, 62836138, E-mail: apes@ibcas.ac.cn, cjpe@ibcas.ac.cn