
Chin J Plant Ecol ›› 2013, Vol. 37 ›› Issue (4): 365-372.DOI: 10.3724/SP.J.1258.2013.00036
• Research Articles • Previous Articles
WANG Yan-Zhe1,2,3,*( ), SHAO Li-Wei1, LIU Xiu-Wei1,3, ZHANG Xiao-Yu1,3, ZHANG Xi-Ying1,**()
Received:2012-07-09
Accepted:2013-02-20
Online:2013-07-09
Published:2013-04-09
Contact:
WANG Yan-Zhe,ZHANG Xi-Ying
WANG Yan-Zhe, SHAO Li-Wei, LIU Xiu-Wei, ZHANG Xiao-Yu, ZHANG Xi-Ying. Optimization of root sampling sites and modeling root length density distribution for wheat and maize[J]. Chin J Plant Ecol, 2013, 37(4): 365-372.
Add to citation manager EndNote|Ris|BibTeX
URL: https://www.plant-ecology.com/EN/10.3724/SP.J.1258.2013.00036
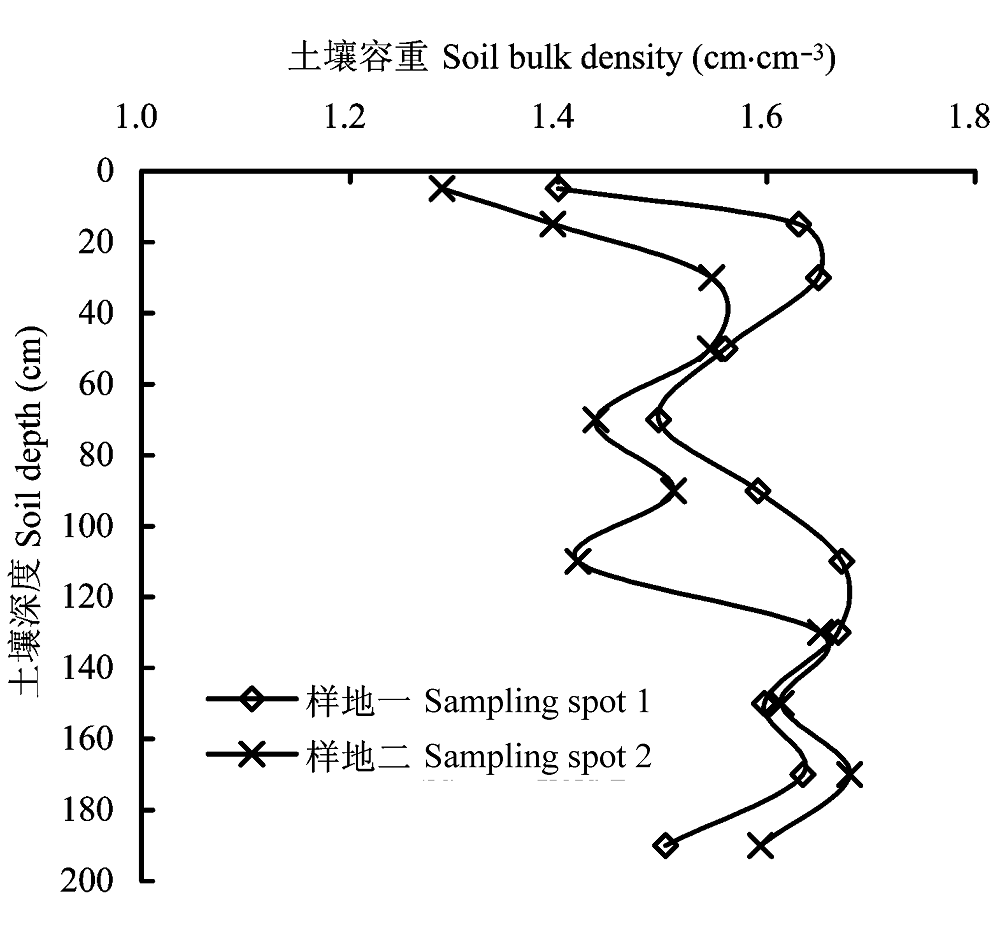
Fig. 1 Soil bulk density (0-200 cm) at the two root sampling spots measured after harvesting of summer maize in 2011.
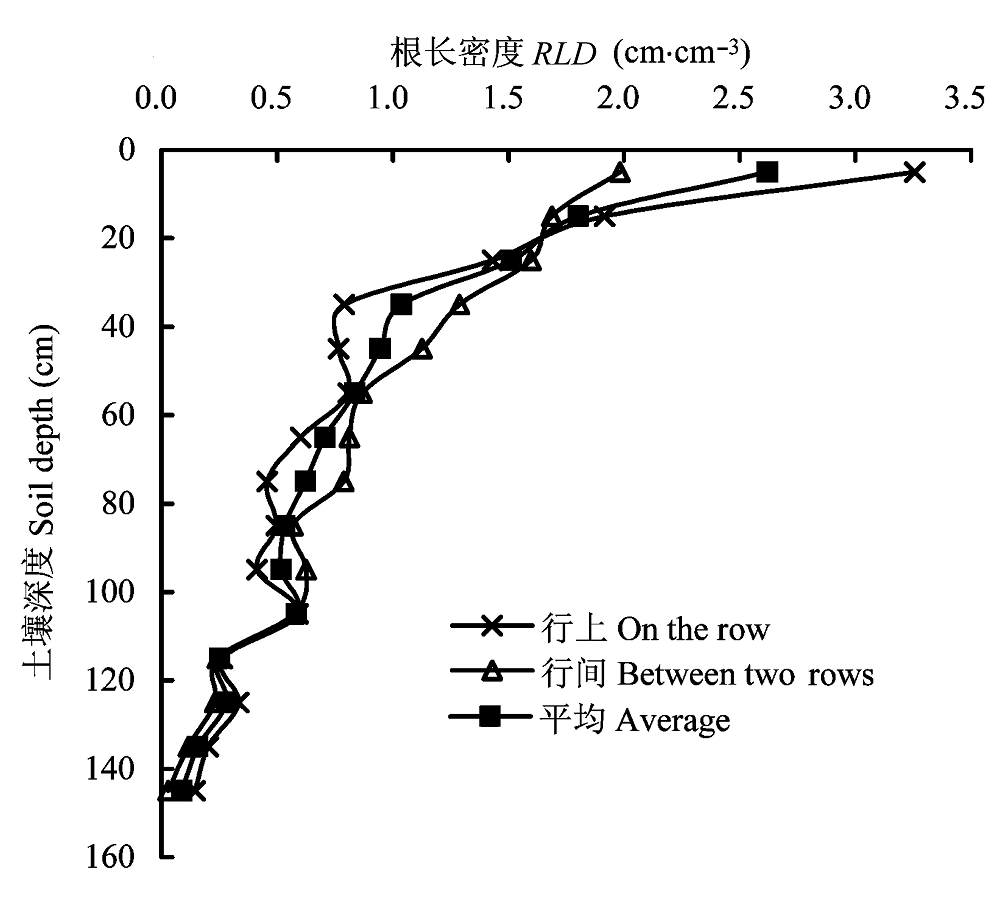
Fig. 2 Root length density (RLD) along the soil profile at different sampling spots under two irrigations conditions for winter wheat.
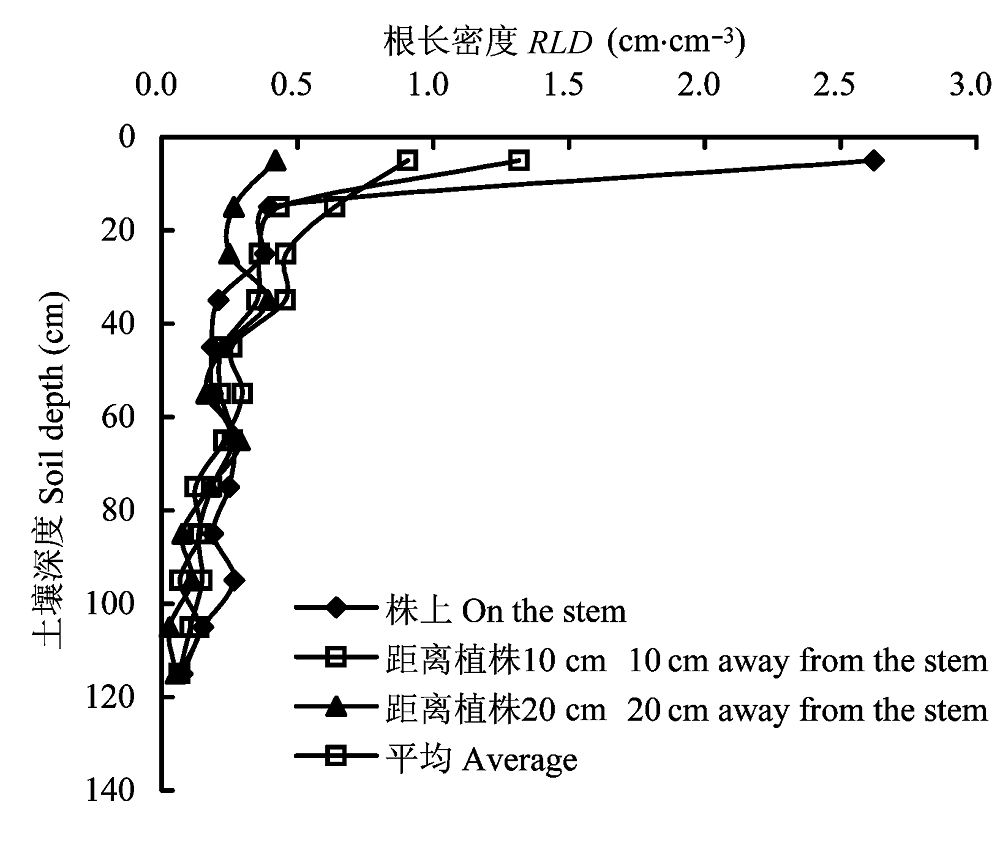
Fig. 3 Root length density (RLD) along the soil profile at different sampling spots for summer maize at grain-fill stage (n = 4).
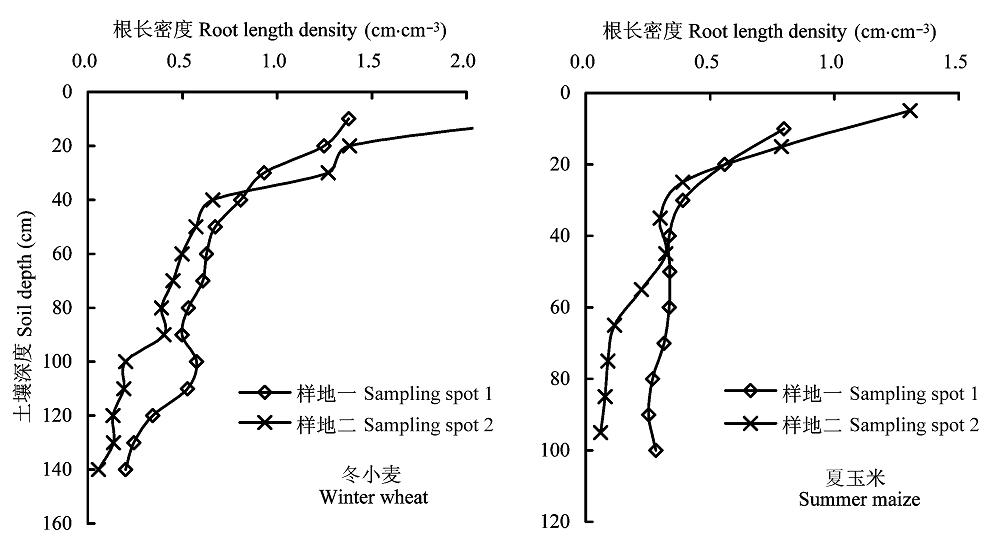
Fig. 4 Root length density along soil profile under different treatments at two sampling spots.
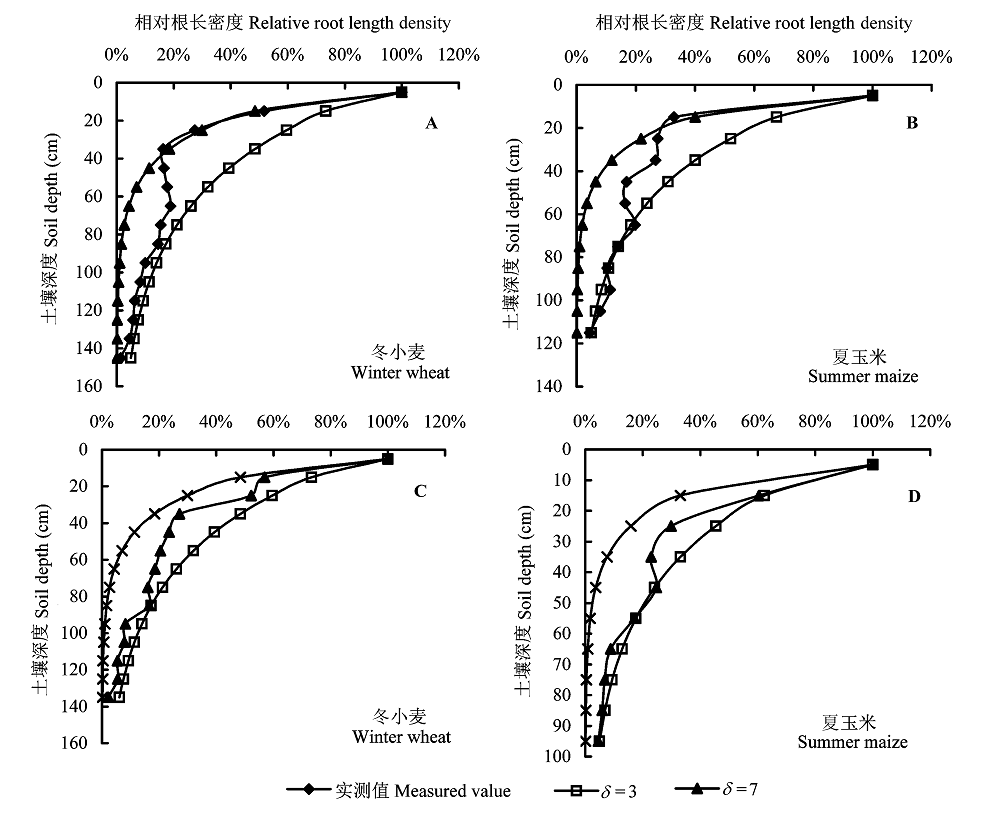
Fig. 5 Measured and simulated relative root length density along soil profile at grain-fill stage for winter wheat and summer maize under well-watered condition using a fixed root distribution coefficient δ in sampling spot 1 (A, B) and sampling spot 2 (C, D).
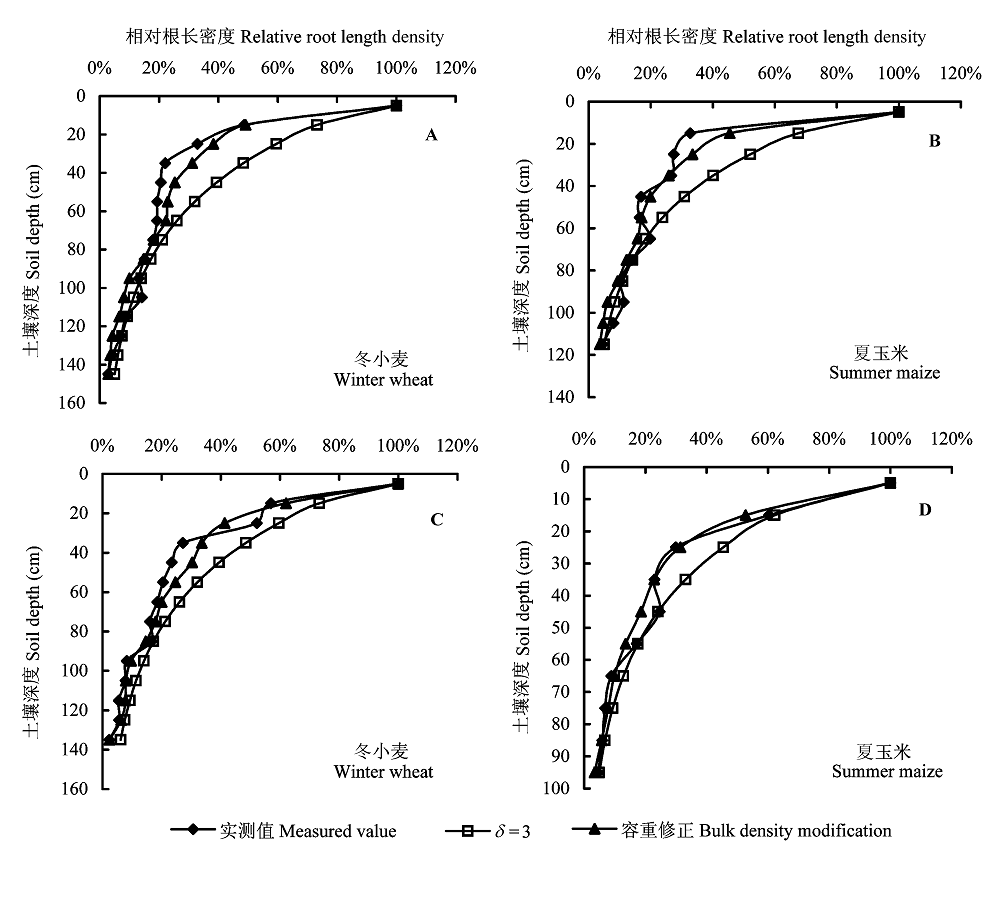
Fig. 6 Measured relative root length density along soil profile at grain-fill stage for winter wheat and summer maize under well-watered condition using a fixed root distribution coefficient (δ = 3) and simulated values with and without bulk density modification in sampling spot 1 (A, B) and sampling spot 2 (C, D).
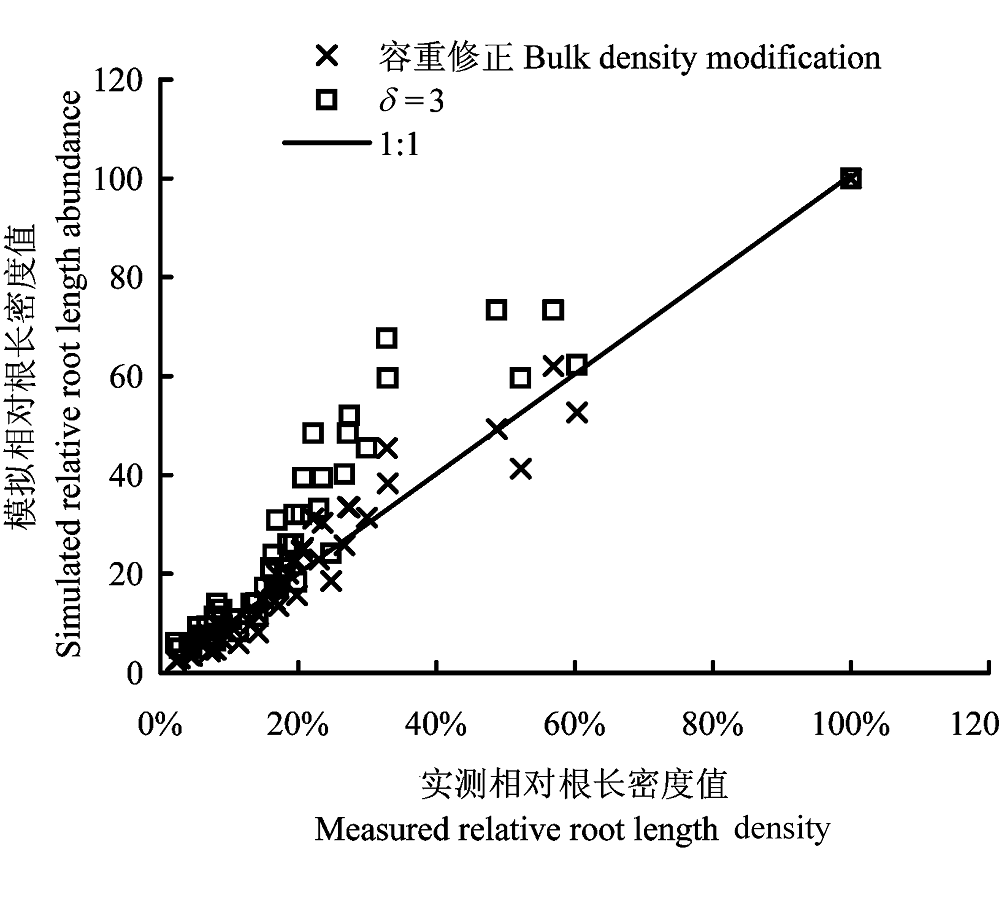
Fig. 7 The relation of measured relative root length density with simulated values (δ = 3) with and without bulk density modification.
| [1] | Batey T (2009). Soil compaction and soil management―a review. Soil Use and Manage, 25, 335-345. |
| [2] | Böhm W (1979). Methods of Studying Root System. Springer Verlag, Berlin. |
| [3] | Cai KZ (2011). Crop Roots Physiological Ecology . Chemical Industry Press, Beijing. (in Chinese) |
| [ 蔡昆争 (2011). 作物根系生理生态学. 化学工业出版社, 北京.] | |
| [4] | Clark LJ, Whalley WR, Barraclough PB (2003). How do roots penetrate strong soil? Plant and Soil, 255, 93-104. |
| [5] | Comas LH, Bauerle TL, Eissenstat DM (2010). Biological and environmental factors controlling root dynamics and function: effects of root ageing and soil moisture. Australian Journal of Grape and Wine Research, 16, 131-137. |
| [6] |
Dupuy L, Gregory PJ, Bengough AG (2010). Root growth models: towards a new generation of continuous approaches. Journal of Experimental Botany, 61, 2131-2143.
URL PMID |
| [7] | Gale MR, Grigal DF (1987). Vertical root distributions of northern tree species in relation to successional status. Canadian Journal of Forest Research, 17, 829-834. |
| [8] | Gerwitz A, Page ER (1974). An empirical mathematical model to describe plant root systems. Journal of Applied Ecology, 14, 312-316. |
| [9] | Li ZX, Chen YQ, Wang QC, Liu KC, Gao WS, Sui P (2012). Influence of planting density on root spatio-temporal dis- tribution of different types of maize under high-yielding cultivation conditions. Acta Agronomica Sinica, 38, 1286-1294. (in Chinese with English abstract) |
| [ 李宗新, 陈源泉, 王庆成, 刘开昌, 高旺盛, 隋鹏 (2012). 高产栽培条件下种植密度对不同类型玉米品种根系时空分布动态的影响. 作物学报, 38, 1286-1294.] | |
| [10] | Liedgens M, Richner W (2001). Minirhizotron observations of the spatial distribution of the maize root system. Agronomy Journal, 93, 1097-1104. |
| [11] | Lipec J, Hatano R (2003). Quantification of compaction effects on soil physical properties and crop growth. Geoderma, 116, 107-136. |
| [12] |
Ma LW, Hoogenboom G, Saseendran SA, Bartling PS, Ahuja LR, Green TR (2009). Effects of estimating soil hydraulic properties and root growth factor on soil water balance and crop production. Agronomy Journal, 101, 572-583.
DOI URL |
| [13] | Mao ZQ, Ning ZR, Liu YH, Zhang KF (2005). Comparative study on two root sampling methods and winter wheat root distribution in soil profile. Chinese Agricultural Science Bulletin, 21, 261-265. (in Chinese with English abstract) |
| [ 毛振强, 宁振荣, 刘云慧, 张克峰 (2005). 两种根系取样方法的对比及冬小麦根系的分布规律. 中国农学通报, 21, 261-265.] | |
| [14] | Morris LA, Ludovici KH, Torreano SJ, Carter EA, Lincoln MC, Will RE (2006). An approach for using general soil physical condition root growth relationships to predict seeding growth response to site preparation tillage in loblolly pine plantations. Forest Ecology and Management, 227, 169-177. |
| [15] | Pedersen A, Zhang KF, Thorup-Kristens K, Jensen LS (2010). Modelling diverse root density dynamics and deep nitrogen uptake—simple approach. Plant and Soil, 326, 493-510. |
| [16] |
Tennant D (1975). A test of a modified line intersect method of estimating root length. Journal of Ecology, 63, 995-1001.
DOI URL |
| [17] | Thorup-Kristensen K (2006). Root growth and nitrogen uptake of carrot, early cabbage, onion and lettuce following a range of green manures. Soil Use and Management, 22, 29-39. |
| [18] | Xiong SP, Wang XC, Li CM, Ma XM, Du SY, Zhang YW, Lin SZ (2011). Responses of the spatial-temporal distribution of winter wheat ( Triticum aestivum) roots and yield to different ratios of nitrogen sources. Chinese Journal of Plant Ecology, 35, 759-768. (in Chinese with English abstract) |
| [ 熊淑萍, 王小纯, 李春明, 马新明, 杜少勇, 张营武, 蔺世召 (2011). 冬小麦根系时空分布动态及产量对不同氮源配施的响应. 植物生态学报, 35, 759-768.] | |
| [19] | Zhang XY (1999). Crop Roots and Soil Water Use. China Meteorological Press, Beijing. (in Chinese) |
| [ 张喜英 (1999). 作物根系与土壤水利用. 气象出版社, 北京.] | |
| [20] | Zhang XY, Pei D, Chen SY (2004). Root growth and soil water utilization of winter wheat in the North China Plain. Hydrological Processes, 18, 2275-2287. |
| [21] | Zhang XY, Shao LW, Sun HY, Chen SY, Wang YZ (2012). Incorporation of soil bulk density in simulating root distribution of winter wheat and maize in two contrasting soils. Soil Science Society of America Journal, 76, 638-647. |
| [1] | XIONG Shu-Ping, CAO Wen-Bo, CAO Rui, ZHANG Zhi-Yong, FU Xin-Lu, XU Sai-Jun, PAN Hu-Qiang, WANG Xiao-Chun, MA Xin-Ming. Effects of horizontal structure on canopy vertical structure, microenvironment and yield of Triticum aestivum [J]. Chin J Plant Ecol, 2022, 46(2): 188-196. |
| [2] | Rui GUO, Ji ZHOU, Fan YANG, Feng LI. Metabolic responses of wheat roots to alkaline stress [J]. Chin J Plant Ecol, 2017, 41(6): 683-692. |
| [3] | Wen-Sai ZHAO, Yong-Lin SUN, Xi-Ping LIU. Effects of drought-rewatering-drought on photosynthesis and growth of maize [J]. Chin J Plan Ecolo, 2016, 40(6): 594-603. |
| [4] | JIN Wan-Yu,LI Ming,HE Yang-Hui,DU Zheng-Gang,SHAO Jun-Jiong,ZHANG Guo-Dong,ZHOU Ling-Yan,ZHOU Xu-Hui. Effects of different levels of nitrogen fertilization on soil respiration during growing season in winter wheat (Triticum aestivum) [J]. Chin J Plan Ecolo, 2015, 39(3): 249-257. |
| [5] | YUAN Guo-Fu, ZHUANG Wei, LUO Yi. Parameterization of water response functions in leaf stomatal conductance model for winter wheat [J]. Chin J Plant Ecol, 2012, 36(5): 463-470. |
| [6] | XIONG Shu-Ping, WANG Xiao-Chun, LI Chun-Ming, MA Xin-Ming, DU Shao-Yong, ZHANG Ying-Wu, LIN Shi-Zhao. Responses of the spatial-temporal distribution of winter wheat (Triticum aestivum) roots and yield to different ratios of nitrogen sources [J]. Chin J Plant Ecol, 2011, 35(7): 759-768. |
| [7] | SHEN Yan, YANG Hui-Ling, HE Wei-Ming. Nutrient availability in habitats affects carbon and nitrogen releases of litter in winter wheat [J]. Chin J Plant Ecol, 2010, 34(5): 498-504. |
| [8] | YE Zi-Piao, YU Qiang. MECHANISM MODEL OF STOMATAL CONDUCTANCE [J]. Chin J Plant Ecol, 2009, 33(4): 772-782. |
| [9] | FENG Yuan-Jiao, WANG Jian-Wu, LUO Shi-Ming. TIMING AND CONCENTRATION EFFECTS ON THE DEFENSE RESPONSE OF ZEA MAYS SEEDLINGS AFTER APPLICATION OF JASMONIC ACID TO LEAVES [J]. Chin J Plant Ecol, 2009, 33(4): 812-823. |
| [10] | FENG Wei, ZHU Yan, YAO Xia, TIAN Yong-Chao, CAO Wei-Xing. MONITORING LEAF DRY WEIGHT AND LEAF AREA INDEX IN WHEAT WITH HYPERSPECTRAL REMOTE SENSING [J]. Chin J Plant Ecol, 2009, 33(1): 34-44. |
| [11] | YE Zi-Piao, YU Qiang. COMPARISON OF NEW AND SEVERAL CLASSICAL MODELS OF PHOTOSYNTHESIS IN RESPONSE TO IRRADIANCE [J]. Chin J Plant Ecol, 2008, 32(6): 1356-1361. |
| [12] | CHEN Xiao-Li, LI Shi-Qing, REN Xiao-Long, QIANG Hong, JI Chun-Rong, YAN Deng-Ming. INFLUENCE OF INCREASED ATMOSPHERIC NH3 ON PHYSIOLOGY INDEX AND BIOMASS OF MAIZE WITH DIFFERENT N EFFICIENCY [J]. Chin J Plant Ecol, 2008, 32(1): 204-211. |
| [13] | DAI Quan-Lin, YUAN Jian-Gang, FANG Wei, YANG Zhong-Yi. DIFFERENCES OF Pb ACCUMULATION AMONG PLANT TISSUES OF 25 ZEA MAYS VARIETIES [J]. Chin J Plant Ecol, 2005, 29(6): 992-999. |
| Viewed | ||||||
|
Full text |
|
|||||
|
Abstract |
|
|||||
Copyright © 2022 Chinese Journal of Plant Ecology
Tel: 010-62836134, 62836138, E-mail: apes@ibcas.ac.cn, cjpe@ibcas.ac.cn