
Chin J Plant Ecol ›› 2013, Vol. 37 ›› Issue (11): 1059-1070.DOI: 10.3724/SP.J.1258.2013.00109
SUN Yun,YU De-Yong( ),LIU Yu-Peng,HAO Rui-Fang
Received:2013-08-05
Accepted:2013-09-29
Online:2013-08-05
Published:2013-11-06
Contact:
YU De-Yong
SUN Yun,YU De-Yong,LIU Yu-Peng,HAO Rui-Fang. Review on detection of critical transition in ecosystems[J]. Chin J Plant Ecol, 2013, 37(11): 1059-1070.
Add to citation manager EndNote|Ris|BibTeX
URL: https://www.plant-ecology.com/EN/10.3724/SP.J.1258.2013.00109
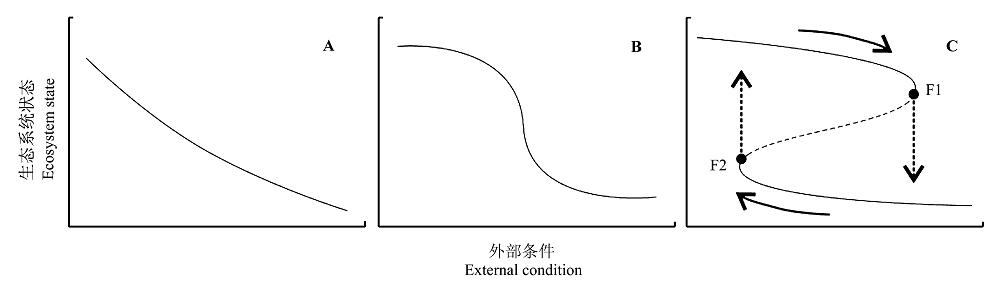
Fig. 1 Different responses of an ecosystem to changes in external conditions. A, Response function curve is smooth and continuous between ecosystem state and external conditions. B, Ecosystem changes profoundly when external conditions approach a critical level. C, Ecosystem has two stable states over a range of conditions. F1 and F2 are transition points of ecosystem. (Cited from Scheffer & Carpenter, 2003)
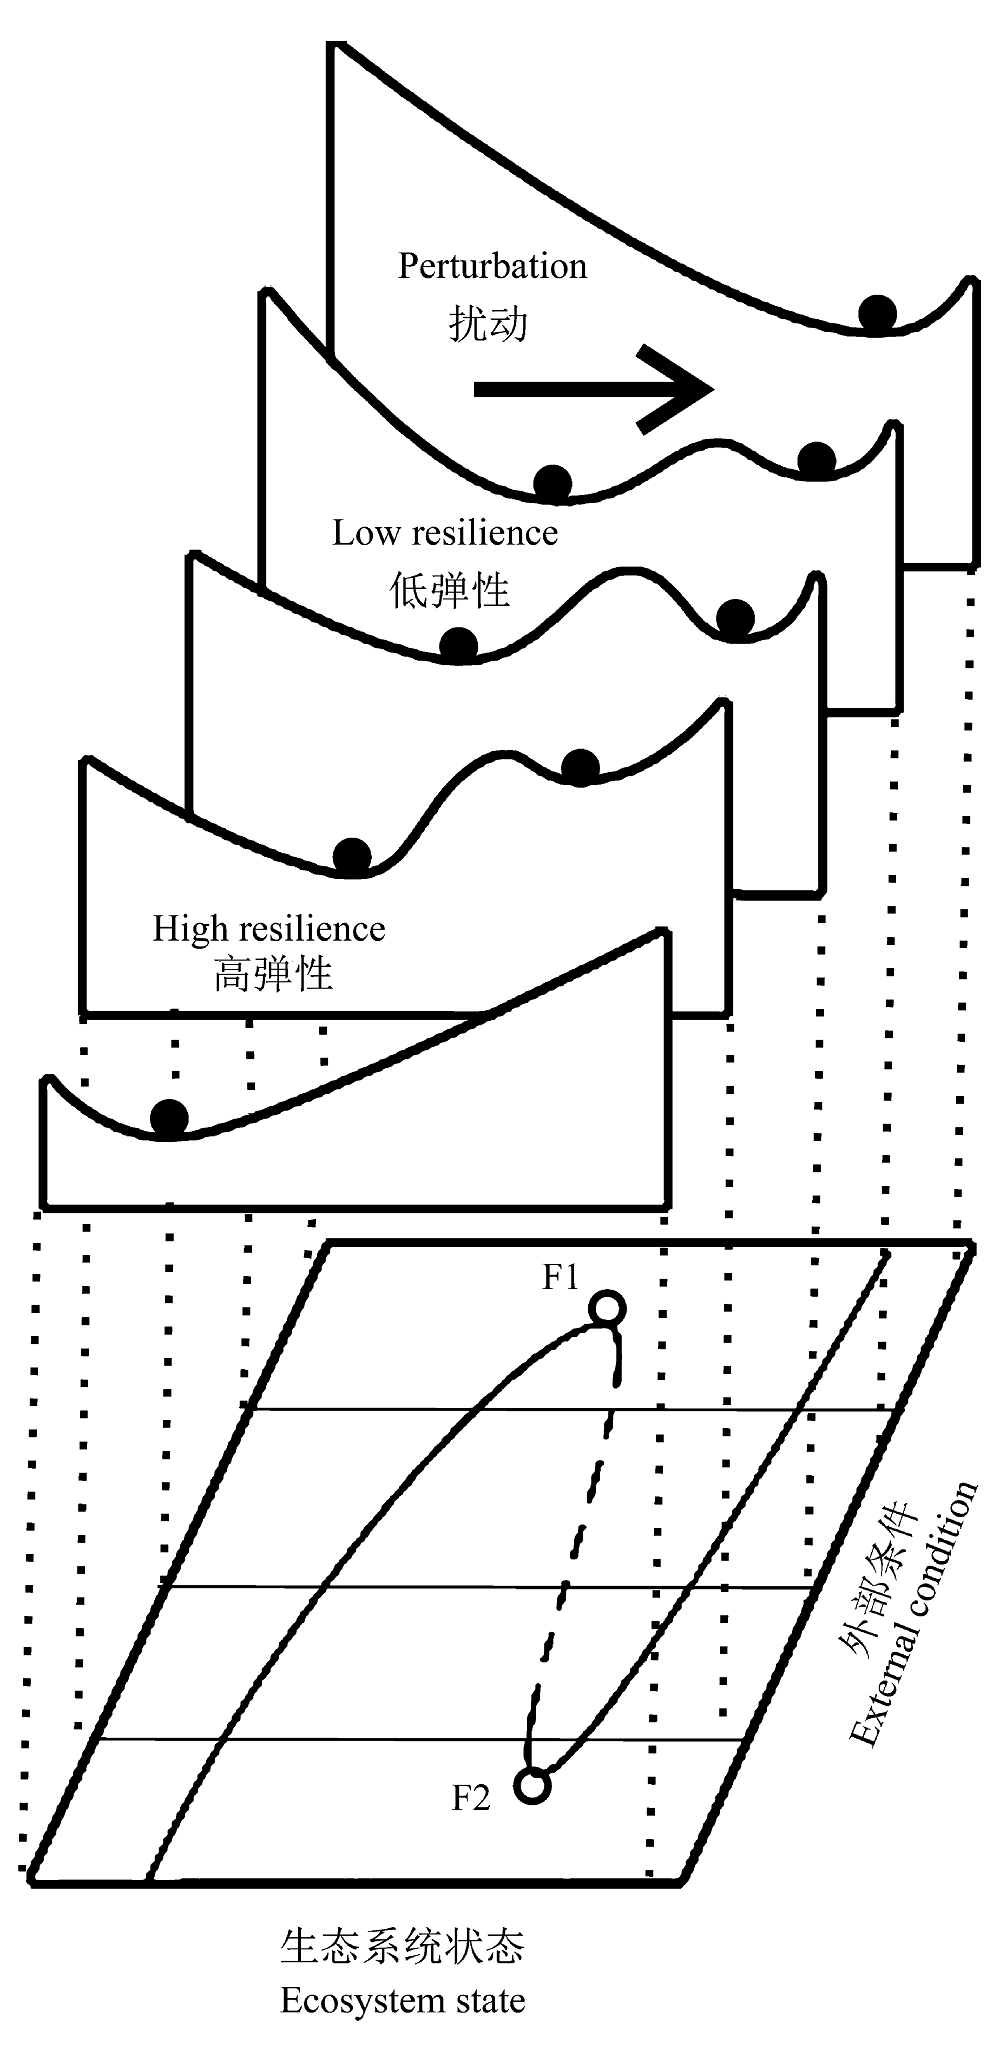
Fig. 2 Effects of external conditions on ecological resilience. F1 and F2 are transition points of ecosystem. (Cited from Scheffer et al., 2001)
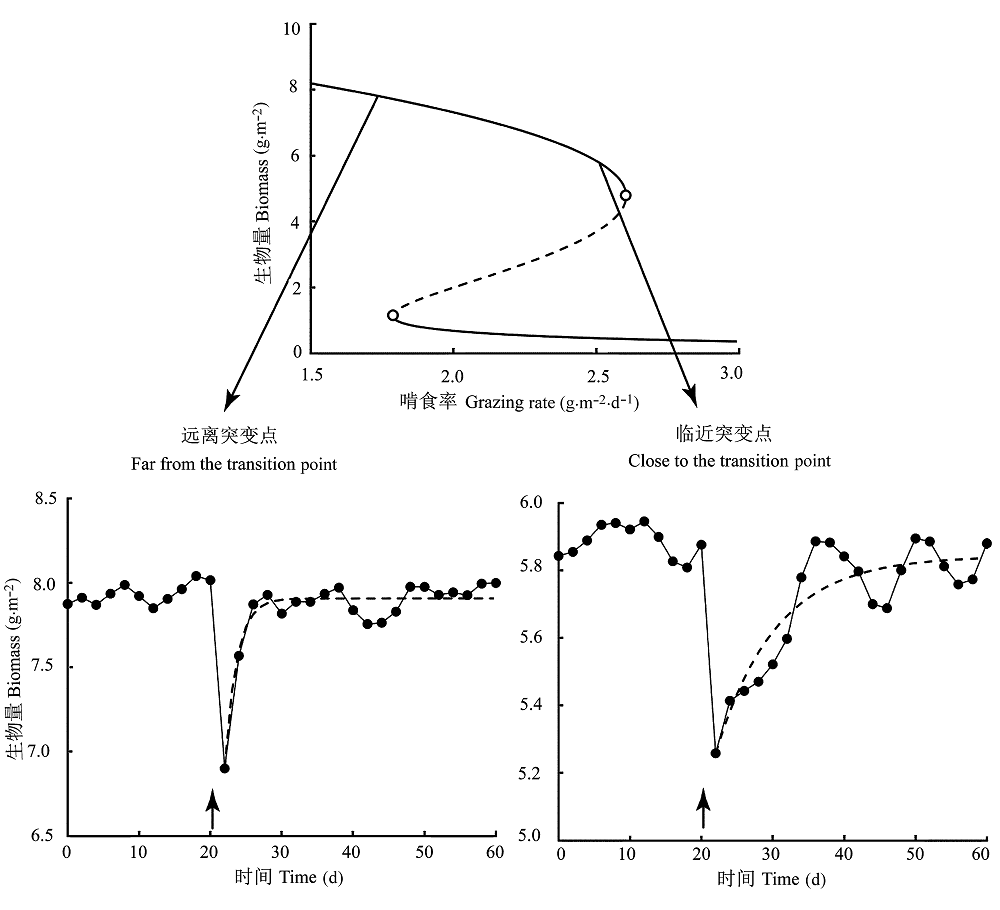
Fig. 3 Recovery ability of ecosystem following perturbation under different circumstances. (Cited from van Nes & Scheffer, 2007)
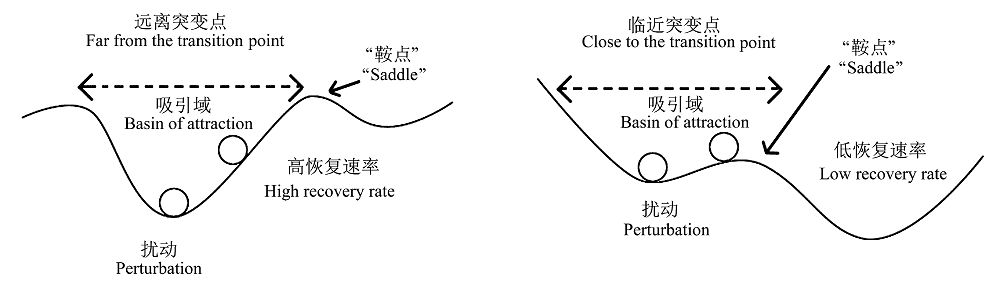
Fig. 4 Ecologically stable landscape under different circumstances. (Synergy Program for Analyzing Resilience and Critical Transitions, 2012)
| 主要突变检测方法 Key methods of detecting critical transition | 主要内容 Main contents | 计算公式 Formula | 局限性 Limitation |
|---|---|---|---|
| 测量恢复时间 Measuring the recovery time | 直接测量系统遭受微小事件扰动时恢复到最初平衡态的时间 Directly measuring the recovery time to equilibrium after a small perturbation | 适用于模拟试验, 对现实生态系统可操作性差 Suitable to simulation experiments, but not feasible in reality | |
| 计算自相关系数、方差, 功率谱分析 Computing autocorrelation and variance, and performing power spectrum analysis | 计算指示系统状态的变量的自相关系数、方差, 对时间序列进行功率谱分析 Computing autocorrelation and variance of the variables that indicate the status of the ecosystem, and analyzing the power spectrum of the time series | $\rho =\frac{E[(\mathop{z}_{t}-\mu )(\mathop{z}_{t+1}-\mu )]}{{}^{\mathop{\mathop{s}_{z}}^{2}}}$ | 数据获取困难和数据处理过程带入的误差和主观性 Difficult to acquire data; error and subjectivity are easily brought to the processing |
| $\mathop{s}^{2}=\frac{1}{n}\sum\limits_{t=1}^{n}{\mathop{(\mathop{z}_{t}-\mu )}^{2}}$ | |||
| μ和sz2分别表示状态变量zt的平均值和方差 μ and sz2 represent the average and variance of zt, respectively | |||
| 计算偏度 Computing the skewness | 由一个描述系统状态变量的时间序列数据计算出偏度绝对值 Computing the absolute value of skewness from the time series of variables that indicate ecosystem state | $\mathop{s}_{k}=\frac{\frac{1}{n}\sum\limits_{t=1}^{n}{\mathop{(\mathop{z}_{t}-\mu )}^{3}}}{\sqrt{\frac{1}{n}\sum\limits_{t=1}^{n}{\mathop{(\mathop{z}_{t}-\mu )}^{2}}}}$ | 偏度计算结果有时候仅反映出外部噪声变化并非生态系统本身状态 Skewness sometimes reflects external noise rather than the ecosystem itself |
| 观察频繁波动 Observing flickering | 计算生态系统状态变量的方差、频率分布的偏度或观察是否出现双峰性 Computing the variance, skewness of frequency distribution of the variables that indicates ecosystem state or observing the bimodality | 适用于出现频繁波动现象的生态系统 Suitable to the ecosystems that flick |
Table 1 Early-warning indicators in ecosystems in temporal dimension
| 主要突变检测方法 Key methods of detecting critical transition | 主要内容 Main contents | 计算公式 Formula | 局限性 Limitation |
|---|---|---|---|
| 测量恢复时间 Measuring the recovery time | 直接测量系统遭受微小事件扰动时恢复到最初平衡态的时间 Directly measuring the recovery time to equilibrium after a small perturbation | 适用于模拟试验, 对现实生态系统可操作性差 Suitable to simulation experiments, but not feasible in reality | |
| 计算自相关系数、方差, 功率谱分析 Computing autocorrelation and variance, and performing power spectrum analysis | 计算指示系统状态的变量的自相关系数、方差, 对时间序列进行功率谱分析 Computing autocorrelation and variance of the variables that indicate the status of the ecosystem, and analyzing the power spectrum of the time series | $\rho =\frac{E[(\mathop{z}_{t}-\mu )(\mathop{z}_{t+1}-\mu )]}{{}^{\mathop{\mathop{s}_{z}}^{2}}}$ | 数据获取困难和数据处理过程带入的误差和主观性 Difficult to acquire data; error and subjectivity are easily brought to the processing |
| $\mathop{s}^{2}=\frac{1}{n}\sum\limits_{t=1}^{n}{\mathop{(\mathop{z}_{t}-\mu )}^{2}}$ | |||
| μ和sz2分别表示状态变量zt的平均值和方差 μ and sz2 represent the average and variance of zt, respectively | |||
| 计算偏度 Computing the skewness | 由一个描述系统状态变量的时间序列数据计算出偏度绝对值 Computing the absolute value of skewness from the time series of variables that indicate ecosystem state | $\mathop{s}_{k}=\frac{\frac{1}{n}\sum\limits_{t=1}^{n}{\mathop{(\mathop{z}_{t}-\mu )}^{3}}}{\sqrt{\frac{1}{n}\sum\limits_{t=1}^{n}{\mathop{(\mathop{z}_{t}-\mu )}^{2}}}}$ | 偏度计算结果有时候仅反映出外部噪声变化并非生态系统本身状态 Skewness sometimes reflects external noise rather than the ecosystem itself |
| 观察频繁波动 Observing flickering | 计算生态系统状态变量的方差、频率分布的偏度或观察是否出现双峰性 Computing the variance, skewness of frequency distribution of the variables that indicates ecosystem state or observing the bimodality | 适用于出现频繁波动现象的生态系统 Suitable to the ecosystems that flick |
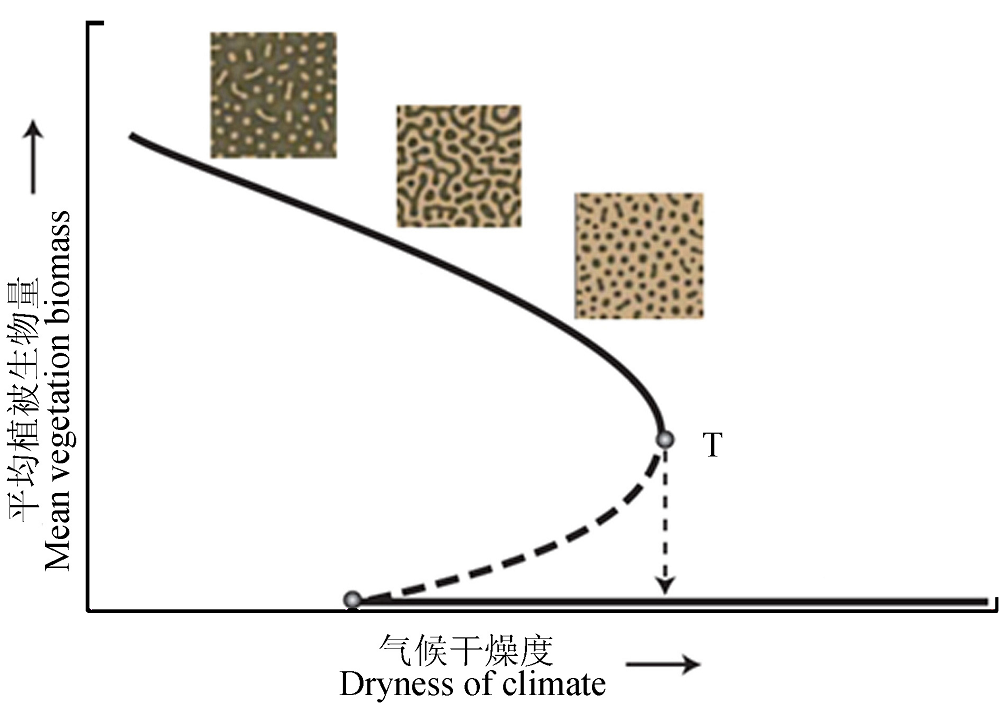
Fig. 5 Dynamical change of ecosystem with self-organized pattern formation. Point T, critical transition from a self-organized patchy state to a barren state. Solid lines represent mean equilibrium densities of vegetation. The three insets represent vegetation pattern: the dark color represents vegetation and the light color represents bare soil. As the bifurcation point for a critical transition into a barren state is approached, the nature of pattern changes from maze-like to spots. (Cited from Rietkerk et al., 2004)
| 主要突变检测方法 Key methods of detecting critical transition | 主要内容 Main contents | 计算公式 Formula | 局限性 Limitation |
|---|---|---|---|
| 计算空间自相关性和方差 Computing spatial autocorrelation and variance | 计算指示系统状态的变量的空间自相关系数和方差 Computing spatial autocorrelation and variance of the variables that indicate the ecosystem state | 数据获取困难和数据处理过程带入的误差和主观性 Difficult to acquire data; error and subjectivity are easily brought to the processing | |
| 观察power law现象 Observing power law | 分析样地斑块大小S与斑块数目N(S), 观察它们的对数是否满足特定的方程 Analyzing the patch size S and number of patches N(S), and see if their logarithm can meet specific equation | N(S)=CS-γ | 适用地区受限, 计算结果受数据计算方式影响大 Restricted to certain areas and the result is greatly influenced by the computation method |
| 观察规则斑块 Observing regular patches | 观察植被斑块是否呈现规则形状 Observing if the vegetation presents regular patches | 难以对斑块进行量化与判断 Difficult to quantify and judge the patches |
Table 2 Early-warning indicators in ecosystems in spatial dimension
| 主要突变检测方法 Key methods of detecting critical transition | 主要内容 Main contents | 计算公式 Formula | 局限性 Limitation |
|---|---|---|---|
| 计算空间自相关性和方差 Computing spatial autocorrelation and variance | 计算指示系统状态的变量的空间自相关系数和方差 Computing spatial autocorrelation and variance of the variables that indicate the ecosystem state | 数据获取困难和数据处理过程带入的误差和主观性 Difficult to acquire data; error and subjectivity are easily brought to the processing | |
| 观察power law现象 Observing power law | 分析样地斑块大小S与斑块数目N(S), 观察它们的对数是否满足特定的方程 Analyzing the patch size S and number of patches N(S), and see if their logarithm can meet specific equation | N(S)=CS-γ | 适用地区受限, 计算结果受数据计算方式影响大 Restricted to certain areas and the result is greatly influenced by the computation method |
| 观察规则斑块 Observing regular patches | 观察植被斑块是否呈现规则形状 Observing if the vegetation presents regular patches | 难以对斑块进行量化与判断 Difficult to quantify and judge the patches |
| [1] |
Aguiar MR, Sala OE (1999). Patch structure, dynamics and implications for the functioning of arid ecosystems. Trends in Ecology & Evolution, 14, 273-277.
DOI URL PMID |
| [2] |
Berglund N, Gentz B (2002). Metastability in simple climate models: pathwise analysis of slowly driven Langevin equations. Stochastics and Dynamics, 2, 327-356.
DOI URL |
| [3] |
Biggs R, Carpenter SR, Brock WA (2009). Turning back from the brink: detecting an impending regime shift in time to avert it. Proceedings of the National Academy of Sciences of the United States of America, 106, 826-831.
DOI URL PMID |
| [4] |
Bjørnstad ON, Grenfell BT (2001). Noisy clockwork: time series analysis of population fluctuations in animals. Science, 293, 638-643.
URL PMID |
| [5] |
Carpenter SR (2005). Eutrophication of aquatic ecosystems: bistability and soil phosphorus. Proceedings of the National Academy of Sciences of the United States of America, 102, 10002-10005.
URL PMID |
| [6] |
Carpenter SR, Brock WA (2006). Rising variance: a leading indicator of ecological transition. Ecology Letters, 9, 311-318.
URL PMID |
| [7] |
Carpenter SR, Cole JJ, Pace ML, Batt R, Brock WA, Cline T, Coloso J, Hodgson JR, Kitchell JF, Seekell DA (2011). Early warnings of regime shifts: a whole-ecosystem experiment. Science, 332, 1079-1082.
DOI URL PMID |
| [8] |
Carpenter SR, Ludwig D, Brock WA (1999). Management of eutrophication for lakes subject to potentially irreversible change. Ecological Applications, 9, 751-771.
DOI URL |
| [9] |
Dai L, Korolev KS, Gore J (2013). Slower recovery in space before collapse of connected populations. Nature, 496, 355-358.
DOI URL PMID |
| [10] |
Dakos V, Kéfi S, Rietkerk M, van Nes EH, Scheffer M (2011). Slowing down in spatially patterned ecosystems at the brink of collapse. The American Naturalist, 177, E153-E166.
DOI URL PMID |
| [11] |
Dakos V, van Nes EH, Donangelo R, Fort H, Scheffer M (2010). Spatial correlation as leading indicator of catastrophic shifts. Theoretical Ecology, 3, 163-174.
DOI URL |
| [12] |
deMenocal P, Guilderson T, Adkins J, Sarnthein M, Baker L, Yarusinsky M, Ortiz J (2000). Abrupt onset and termination of the African Humid Period: rapid climate responses to gradual insolation forcing. Quaternary Science Reviews, 19, 347-361.
DOI URL |
| [13] |
deYoung B, Barange M, Beaugrand G, Harris R, Perry RI, Scheffer M, Werner F (2008). Regime shifts in marine ecosystems: detection, prediction and management. Trends in Ecology & Evolution, 23, 402-409.
DOI URL PMID |
| [14] |
Donangelo R, Fort H, Dakos V, Scheffer M, van Nes EH (2010). Early warnings for catastrophic shifts in ecosystems: comparison between spatial and temporal indicators. International Journal of Bifurcation and Chaos, 20, 315-321.
DOI URL |
| [15] |
Dunne JA, Williams RJ, Martinez ND (2002). Network structure and biodiversity loss in food webs: robustness increases with connectance. Ecology Letters, 5, 558-567.
DOI URL |
| [16] |
Ellner S, Turchin P (1995). Chaos in a noisy world: new methods and evidence from time-series analysis. The American Naturalist, 145, 343-375.
DOI URL |
| [17] | Feng JF, Wang HL, Zhu L (2009). Review on alternative stable states in ecosystems. Ecology and Environmental Sciences, 18, 1553-1559. (in Chinese with English Abstract) |
| [ 冯剑丰, 王洪礼, 朱琳 (2009). 生态系统多稳态研究进展. 生态环境学报, 18, 1553-1559.] | |
| [18] |
Guttal V, Jayaprakash C (2008). Changing skewness: an early warning signal of regime shifts in ecosystems. Ecology Letters, 11, 450-460.
DOI URL PMID |
| [19] |
Guttal V, Jayaprakash C (2009). Spatial variance and spatial skewness: leading indicators of regime shifts in spatial ecological systems. Theoretical Ecology, 2, 3-12.
DOI URL |
| [20] | Held H, Kleinen T (2004). Detection of climate system bifurcations by degenerate fingerprinting. Geophysical Research Letters, 31, doi: 10.1029/2004GL020972. |
| [21] |
Holling CS (1973). Resilience and stability of ecological systems. Annual Review of Ecology and Systematics, 4, 1-23.
DOI URL |
| [22] | Horsthemke W, Lefever R (1984). Noise-Induced Transitions. Springer, Berlin. |
| [23] |
Isbell F, Tilman D, Polasky S, Binder S, Hawthorne P (2013). Low biodiversity state persists two decades after cessation of nutrient enrichment. Ecology Letters, 16, 454-460.
DOI URL PMID |
| [24] |
Ives AR, Dennis B, Cottingham KL, Carpenter SR (2003). Estimating community stability and ecological interactions from time-series data. Ecological Monographs, 73, 301-330.
DOI URL |
| [25] |
Kéfi S, Rietkerk M, Alados CL, Pueyo Y, Papanastasis VP, ElAich A, de Ruiter PC (2007a). Spatial vegetation patterns and imminent desertification in Mediterranean arid ecosystems. Nature, 449, 213-217.
URL PMID |
| [26] |
Kéfi S, Rietkerk M, van Baalen M, Loreau M (2007b). Local facilitation, bistability and transitions in arid ecosystems. Theoretical Population Biology, 71, 367-379.
URL PMID |
| [27] |
Kleinen T, Held H, Petschel-Held G (2003). The potential role of spectral properties in detecting thresholds in the earth system: application to the thermohaline circulation. Ocean Dynamics, 53, 53-63.
DOI URL |
| [28] |
Kuehn C (2011). A mathematical framework for critical transitions: bifurcations, fast-slow systems and stochastic dynamics. Physica D: Nonlinear Phenomena, 240, 1020-1035.
DOI URL |
| [29] |
Lerdau M (2007). A positive feedback with negative consequences. Science, 316, 212-213.
URL PMID |
| [30] |
Levin SA, Segel LA (1985). Pattern generation in space and aspect. SIAM Review, 27, 45-67.
DOI URL |
| [31] |
Lin Y, Han GD, Zhao ML, Chang SX (2010). Spatial vegetation patterns as early signs of desertification: a case study of a desert steppe in Inner Mongolia, China. Landscape Ecology, 25, 1519-1527.
DOI URL |
| [32] |
Luo YQ, Weng ES (2011). Dynamic disequilibrium of the terrestrial carbon cycle under global change. Trends in Ecology & Evolution, 26, 96-104.
DOI URL PMID |
| [33] |
Maestre FT, Escudero A (2009). Is the patch size distribution of vegetation a suitable indicator of desertification processes? Ecology, 90, 1729-1735.
DOI URL PMID |
| [34] |
Mäler KG (2009). Development, ecological resources and their management: a study of complex dynamic systems. European Economic Review, 44, 645-665.
DOI URL |
| [35] |
Massada AB, Gabay O, Perevolotsky A, Carmel Y (2008). Quantifying the effect of grazing and shrub-clearing on small scale spatial pattern of vegetation. Landscape Ecology, 23, 327-339.
DOI URL |
| [36] |
May RM (1977). Thresholds and breakpoints in ecosystems with a multiplicity of stable states. Nature, 269, 471-477.
DOI URL |
| [37] | Millennium Ecosystem Assessment (2005). Ecosystem and Human Well-Being: Synthesis. World Resource Institute, Washington, DC. |
| [38] |
Peters DPC, Pielke RA, Bestelmeyer BT, Allen CD, Munson-McGee S, Havstad KM (2004). Cross-scale interactions, nonlinearities, and forecasting catastrophic events. Proceedings of the National Academy of Sciences of the United States of America, 101, 15130-15135.
DOI URL PMID |
| [39] |
Rietkerk M, Dekker SC, de Ruiter PC, van de Koppel J (2004). Self-organized patchiness and catastrophic shifts in ecosystems. Science, 305, 1926-1929.
DOI URL PMID |
| [40] |
Rietkerk M, van de Koppel J (2008). Regular pattern formation in real ecosystems. Trends in Ecology & Evolution, 23, 169-175.
DOI URL PMID |
| [41] | Scheffer M (1990). Multiplicity of stable states in freshwater systems. Hydrobiologia, 61, 475-486. |
| [42] |
Scheffer M, Bascompte J, Brock WA, Brovkin V, Carpenter SR, Dakos V, Held H, van Nes EH, Rietkerk M, Sugihara G (2009). Early-warning signals for critical transitions. Nature, 461, 53-59.
DOI URL PMID |
| [43] |
Scheffer M, Carpenter SR (2003). Catastrophic regime shifts in ecosystems: linking theory to observation. Trends in Ecology & Evolution, 18, 648-656.
DOI URL |
| [44] |
Scheffer M, Carpenter SR, Foley JA, Folke C, Walker B (2001). Catastrophic shifts in ecosystems. Nature, 413, 591-596.
DOI URL PMID |
| [45] |
Scheffer M, Carpenter SR, Lenton TM, Bascompte J, Brock W, Dakos V, van de Koppel J, van de Leemput IA, Levin SA, van Nes EH (2012). Anticipating critical transitions. Science, 338, 344-348.
URL PMID |
| [46] |
Scheffer M, Hosper SH, Meijer ML, Moss B, Jeppesen E (1993). Alternative equilibria in shallow lakes. Trends in Ecology & Evolution, 8, 275-279.
DOI URL PMID |
| [47] |
Stachowicz JJ (2001). Mutualism, facilitation, and the structure of ecological communities: positive interactions play a critical, but underappreciated, role in ecological communities by reducing physical or biotic stresses in existing habitats and by creating new habitats on which many species depend. BioScience, 51, 235-246.
DOI URL |
| [48] |
Staver AC, Archibald S, Levin SA (2011). The global extent and determinants of savanna and forest as alternative biome states. Science, 334, 230-232.
DOI URL PMID |
| [49] |
Steneck RS, Vavrinec J, Leland AV (2004). Accelerating trophic-level dysfunction in kelp forest ecosystems of the western North Atlantic. Ecosystems, 7, 323-332.
DOI URL |
| [50] | Synergy Program for Analyzing Resilience and Critical Transitions (2012). Early Warning Signals Toolbox. http://www.early-warning-signals.org/?page_id=480. Cited 18 July 2013. |
| [51] |
van Nes EH, Rip WJ, Scheffer M (2007). A theory for cyclic shifts between alternative states in shallow lakes. Ecosystems, 10, 17-28.
DOI URL |
| [52] |
van Nes EH, Scheffer M (2005). Implications of spatial heterogeneity for catastrophic regime shifts in ecosystems. Ecology, 86, 1797-1807.
DOI URL |
| [53] |
van Nes EH, Scheffer M (2007). Slow recovery from perturbations as a generic indicator of a nearby catastrophic shift. The American Naturalist, 169, 738-747.
DOI URL PMID |
| [54] |
Veraart AJ, Faassen EJ, Dakos V, van Nes EH, Lürling M, Scheffer M (2011). Recovery rates reflect distance to a tipping point in a living system. Nature, 481, 357-359.
URL PMID |
| [55] |
von Hardenberg J, Meron E, Shachak M, Zarmi Y (2001). Diversity of vegetation patterns and desertification. Physical Review Letters, 87, 198101.
DOI URL PMID |
| [56] |
Wang R, Dearing JA, Langdon PG, Zhang EL, Yang XD, Dakos V, Scheffer M (2012). Flickering gives early warning signals of a critical transition to a eutrophic lake state. Nature, 492, 419-422.
DOI URL PMID |
| [57] |
Wissel C (1984). A universal law of the characteristic return time near thresholds. Oecologia, 65, 101-107.
DOI URL PMID |
| [58] |
Wu JG (2013). Landscape sustainability science: ecosystem services and human well-being in changing landscapes. Landscape Ecology, 28, 999-1023.
DOI URL |
| [59] | Yu L, Hao BL (1984). Phase Transitions and Critical Phenomena. Science Press, Beijing. (in Chinese) |
| [ 于渌, 郝柏林 (1984). 相变和临界现象. 科学出版社, 北京.] |
| [1] | FANG Ou-Ya, ZHANG Yong, ZHANG Qi, JIA Heng-Feng. Growth responses of Tamarix austromongolica to extreme drought and flood in the upper Yellow River basin [J]. Chin J Plant Ecol, 2021, 45(6): 641-649. |
| [2] | Wang Wei, Liu Zhong-ling, Hao Dun-yuan, Liang Cun-zhu. Research on the Restoring Succession of the Degenerated Grassland in Inner Mongolia II. Analysis of the Restoring Processes [J]. Chin J Plan Ecolo, 1996, 20(5): 460-471. |
| Viewed | ||||||
|
Full text |
|
|||||
|
Abstract |
|
|||||
Copyright © 2022 Chinese Journal of Plant Ecology
Tel: 010-62836134, 62836138, E-mail: apes@ibcas.ac.cn, cjpe@ibcas.ac.cn