
Chin J Plant Ecol ›› 2008, Vol. 32 ›› Issue (2): 328-335.DOI: 10.3773/j.issn.1005-264x.2008.02.009
• Research Articles • Previous Articles Next Articles
Khajeddin SJ1( ), Akbari M1, Karimzadeh HR1, Eghbal MK2
Received:2006-12-20
Accepted:2007-09-26
Online:2008-12-20
Published:2008-03-30
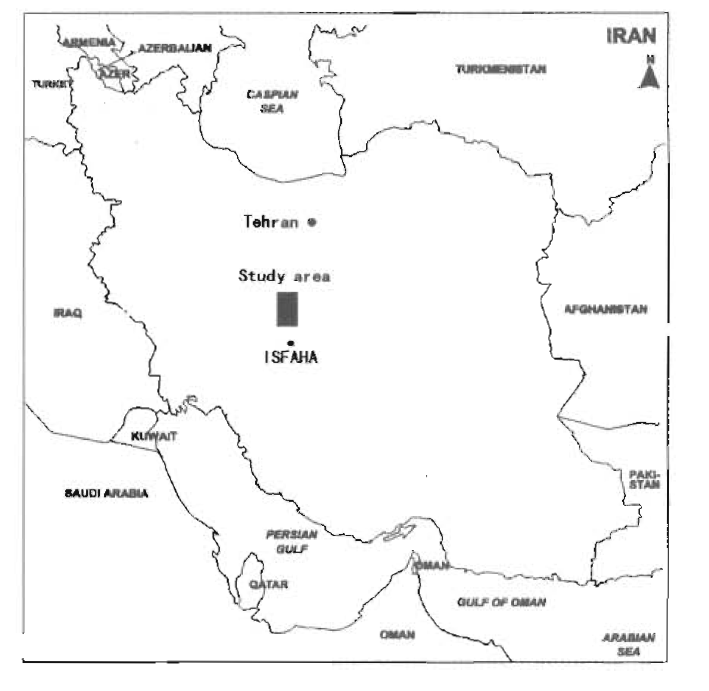
Khajeddin SJ, Akbari M, Karimzadeh HR, Eghbal MK. DETECTING DESERTIFICATION PROCESSES USING TM AND ETM+ DATA, NORTH OF ISFAHAN, IRAN[J]. Chin J Plant Ecol, 2008, 32(2): 328-335.
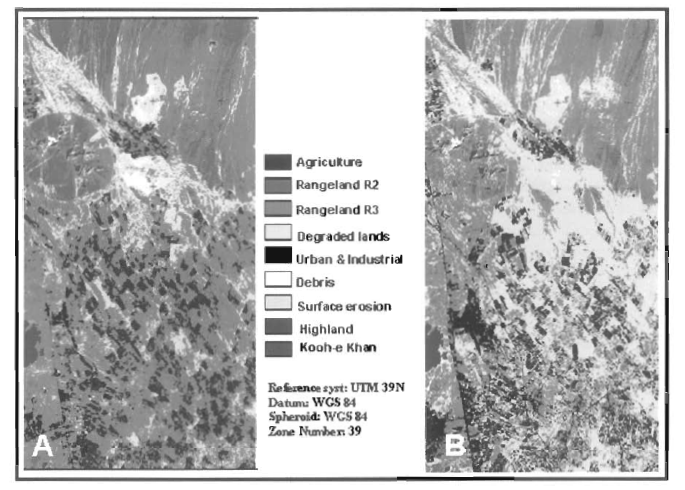
| No. | Land use classes | Symbol | TM (1990)* | ETM+ (2001)* | Change* | |
|---|---|---|---|---|---|---|
| 1 | Agriculture | Agr | 11 488 | 10 254 | -1 234 | -10.74 |
| 2 | Rangeland 2 | R2 | 9 892 | 6 139 | -3 753 | -37.94 |
| 3 | Rangeland 3 | R3 | 43 378 | 22 966 | -20 412 | -47.06 |
| 4 | Degraded | Deg | 17 958 | 40 907 | 22 949 | 127.79 |
| 5 | Urban | Urb | 2 035 | 4 370 | 2 335 | 114.74 |
| 6 | Debris | Deb | 317 | 432 | 115 | 36.27 |
| 7 | Surface erosion | G | 1 024 | 1 024 | - | - |
| 8 | Highland | H | 337 | 337 | - | - |
| 9 | Kooh-e Khan | I | 621 | 621 | - | - |
| Total area | 87 050 | 87 050 | - | - |
| No. | Land use classes | Accuracy | TM | ETM+ | Error | TM | ETM+ |
|---|---|---|---|---|---|---|---|
| 1 | Agriculture | Producer | 30.6 | 74.9 | Omission | R3, U, Deg | R2, R3 |
| Users | 57.9 | 99.8 | Commission | Deg, U | - | ||
| 2 | Rangeland 2 | Producer | 47.5 | 98.7 | Omission | - | - |
| Users | 46.2 | 81.6 | Commission | R3 | Agr | ||
| 3 | Rangeland 3 | Producer | 70.6 | 96.4 | Omission | R2, Deg | - |
| Users | 31.6 | 93.5 | Commission | Deg, U, Agr | - | ||
| 4 | Degraded | Producer | 46.2 | 90.2 | Omission | R3, Agr | - |
| Users | 65.4 | 94.9 | Commission | G, R3 | - | ||
| 5 | Urban | Producer | 49.1 | 93.7 | Omission | R3 | - |
| Users | 84.2 | 99.8 | Commission | Agr | - | ||
| 6 | Debris | Producer | 77 | 100 | Omission | R3 | - |
| Users | 90.7 | 100 | Commission | - | - | ||
| 7 | Surface erosion | Producer | 87.3 | 100 | Omission | Deg | - |
| Users | 100 | 96.3 | Commission | - | - | ||
| 8 | Highland | Producer | 100 | 87.2 | Omission | - | R2 |
| Users | 100 | 97.1 | Commission | - | - | ||
| 9 | Kooh-e Khan | Producer | 100 | 94.9 | Omission | - | - |
| Users | 100 | 97.1 | Commission | - | - | ||
| Overall | 60.4 | 91.9 | |||||
| KHAT | 52.6 | 89.8 |
| Type of changes | Fuzzy analysis | Time series analysis | ||||
|---|---|---|---|---|---|---|
| (%) | (hm2) | (%) | (hm2) | |||
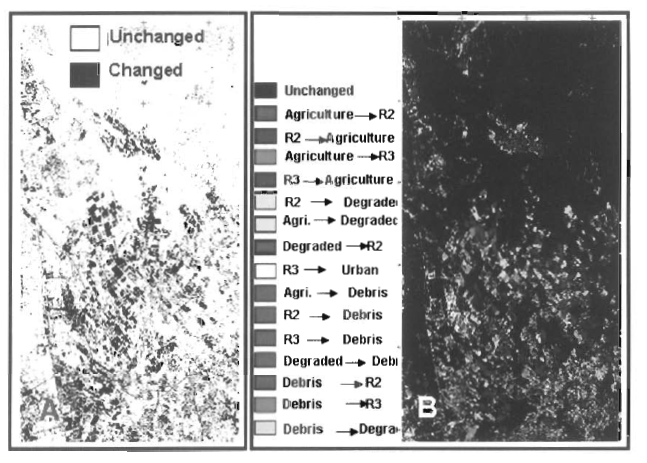
| Unchanged areas | 47% | 41 244 | 45% | 38 817 | ||
| Changed areas | 53% | 45 806 | 55% | 48 233 | ||
| Total | 100% | 87 050 | 100% | 87 050 | ||
| Type of changes | Fuzzy analysis | Time series analysis | ||||
|---|---|---|---|---|---|---|
| (%) | (hm2) | (%) | (hm2) | |||
| Unchanged areas | 47% | 41 244 | 45% | 38 817 | ||
| Changed areas | 53% | 45 806 | 55% | 48 233 | ||
| Total | 100% | 87 050 | 100% | 87 050 | ||
| Agri | R2 | R3 | Deg | Urb | Deb | G | H | I | Total | |
|---|---|---|---|---|---|---|---|---|---|---|
| Agri | 3 943 | 21 | 5 236 | 782 | 211 | 61 | - | - | - | 10 254 |
| R2 | 29 | 3 791 | 2 053 | 192 | 71 | 3 | - | - | - | 6 139 |
| R3 | 1 472 | 4 742 | 14 034 | 2 603 | 100 | 15 | - | - | - | 22 966 |
| Deg | 5 807 | 1 294 | 19 593 | 13 726 | 378 | 109 | - | - | - | 40 907 |
| Urb | 232 | 40 | 2 195 | 578 | 1 268 | 57 | - | - | - | 4 370 |
| Deb | 7 | 3 | 267 | 75 | 7 | 73 | - | - | - | 432 |
| G | - | - | - | - | - | - | 1 024 | - | - | 1 024 |
| H | - | - | - | - | - | - | - | 337 | - | 337 |
| I | - | - | - | - | - | - | - | - | 621 | 621 |
| Total | 11 490 | 9 891 | 43 378 | 17 956 | 2 035 | 318 | 1 024 | 337 | 621 | 87 050 |
| [1] | Alrababah MA, Alhamid MN (2006). Land use/cover classification of arid and semi-arid Mediterranean landscapes using Landsat ETM. International Journal of Remote Sensing, 27, 2703-2718. |
| [2] | Babaev AM, Kharin NG (1999). The monitoring and forecast of desertification processes. In: Babaev AM ed. Desert Problems and Desertification in Central Asia. Springer-Verlag, Berlin, 59-75. |
| [3] | Chen H, Goodenough DG, Dyk A, Mcdonald S, Han T (2004). Change detection with ALI and Landsat satellite data. In: Smits P, Bruzzone L eds. Analysis of Multi-Temporal Remote Sensing Images. World Scientific, London, 89-97. |
| [4] | Dhir RP (1993). Remote sensing in monitoring drought and desertification. In: Sen AK, Kar A eds. Desertification and Its Control in the Thar, Sahara and Sahel Region. Scientific Publishers, Jodhpur, India, 107-118. |
| [5] | Ghassemian-Yazdei MH, Ghyasvand G (1999). Change Detection in TM Images Using Principle Component Analysis and Fuzzy Logic. Proceeding of Surveying, 78 Conference, National Cartographic Center, Tehran, Iran, 1-15. (in Persian) |
| [6] | Goetz SJ, Varlyguin D, Smith AJ, Wright RK, Prince SD, Mazzacato ME, Tringe J, Jantz C, Melchoir B (2004). Application of multi-temporal Landsat data to map and monitor land cover and land use change in the Chesapeake Bay watershed. In: Smits PC, Bruzzone L eds. Analysis of Multi-Temporal Remote Sensing Images. World Scientific, London, 223-232. |
| [7] | Granger A (1984). Desertification, How People Make Deserts, How People Can Stop and Why They Don't. International Institute for Environmental and Development, London, 94. |
| [8] | Harasheh H, Tateishi R (2000). Desertification mapping of west Asia—a GIS and remote sensing application. http://www.gis.development.net/aars/acrs/. |
| [9] | Kral K, Pavlis J (2006). The first detailed land-cover map of Scotra Island by Landsat/ETM+ data. International Journal of Remote Sensing, 27, 3239-3250. |
| [10] | Lillesand TM, Kiefer RW (2000). Remote Sensing and Image Interpretation. John Wiley, New York, 470-615. |
| [11] | Probeck M, Ludwig R, Mauser W (2004). Spectral un-mixing of sub-scale land cover from multi-temporal NOAA-AVHRR imagery using a combined GIS and fuzzy logic approach. In: Smits PC, Bruzzone L eds. Analysis of Multi-Temporal Remote Sensing Images. World Scientific, London, 80-88. |
| [12] | Rama Krishna YS (1993). Climatological analysis of drought situation in Western Rajasthan. In: Sen AK, Kar A eds. Desertification and Its Control in the Thar, Sahara and Sahel Region. Scientific Publishers, Jodhpur, India, 187-203. |
| [13] | Rappenhoner D (1989). Resource Conservation and Desertification Control in the Near East. Deutsche Stifung fur Internationale Entwicklung, Feldafing, Germany, 40-157. |
| [14] | Sen AK (1993). Methodology on the study of monitoring of desertification in India—A Review of some case studies. In: Sen AK, Kar A eds. Desertification and Its Control in the Thar, Sahara and Sahel Region. Scientific Publishers, Jodhpur, India, 187-203. |
| [15] | Sen AK, Sharma KD (1995). Causative Agents Indicators of Monitoring and Desertification in Asia and Pacific Region. Scientific Publishers, Jodhpur, India, 41-58. |
| [16] | Williams LO (2002). An End To Global Warming. Pergamon Elsevier Science, Amsterdam, New York. |
| [17] | Zehtabian GR, Tabatabaei MR (2000). Investigation of Desertification change in Khozestan province by using image processing (IP) and geographic information system (GIS). Biaban, 4, 57-67. (in Persian with English abstract) |
| [18] | Zhang J, Foody GM (1998). A fuzzy classification of sub-urban land covers from remotely sensed imagery. International Journal of Remote Sensing, 19, 2721-2738. |
| Viewed | ||||||
|
Full text |
|
|||||
|
Abstract |
|
|||||
Copyright © 2022 Chinese Journal of Plant Ecology
Tel: 010-62836134, 62836138, E-mail: apes@ibcas.ac.cn, cjpe@ibcas.ac.cn