
Chin J Plant Ecol ›› 2018, Vol. 42 ›› Issue (10): 1009-1021.DOI: 10.17521/cjpe.2018.0063
• Research Articles • Previous Articles Next Articles
LI Li-Yuan1,LI Jun2,TONG Xiao-Juan1,*( ),MENG Ping3,ZHANG Jin-Song3,ZHANG Jing-Ru1
Received:2018-03-27
Online:2018-10-20
Published:2019-01-30
Contact:
Xiao-Juan TONG
Supported by:LI Li-Yuan, LI Jun, TONG Xiao-Juan, MENG Ping, ZHANG Jin-Song, ZHANG Jing-Ru. Simulation on the light-response curves of electron transport rate of Quercus variabilis and Robinia pseudoacacia leaves in the Xiaolangdi area, China[J]. Chin J Plant Ecol, 2018, 42(10): 1009-1021.
Add to citation manager EndNote|Ris|BibTeX
URL: https://www.plant-ecology.com/EN/10.17521/cjpe.2018.0063
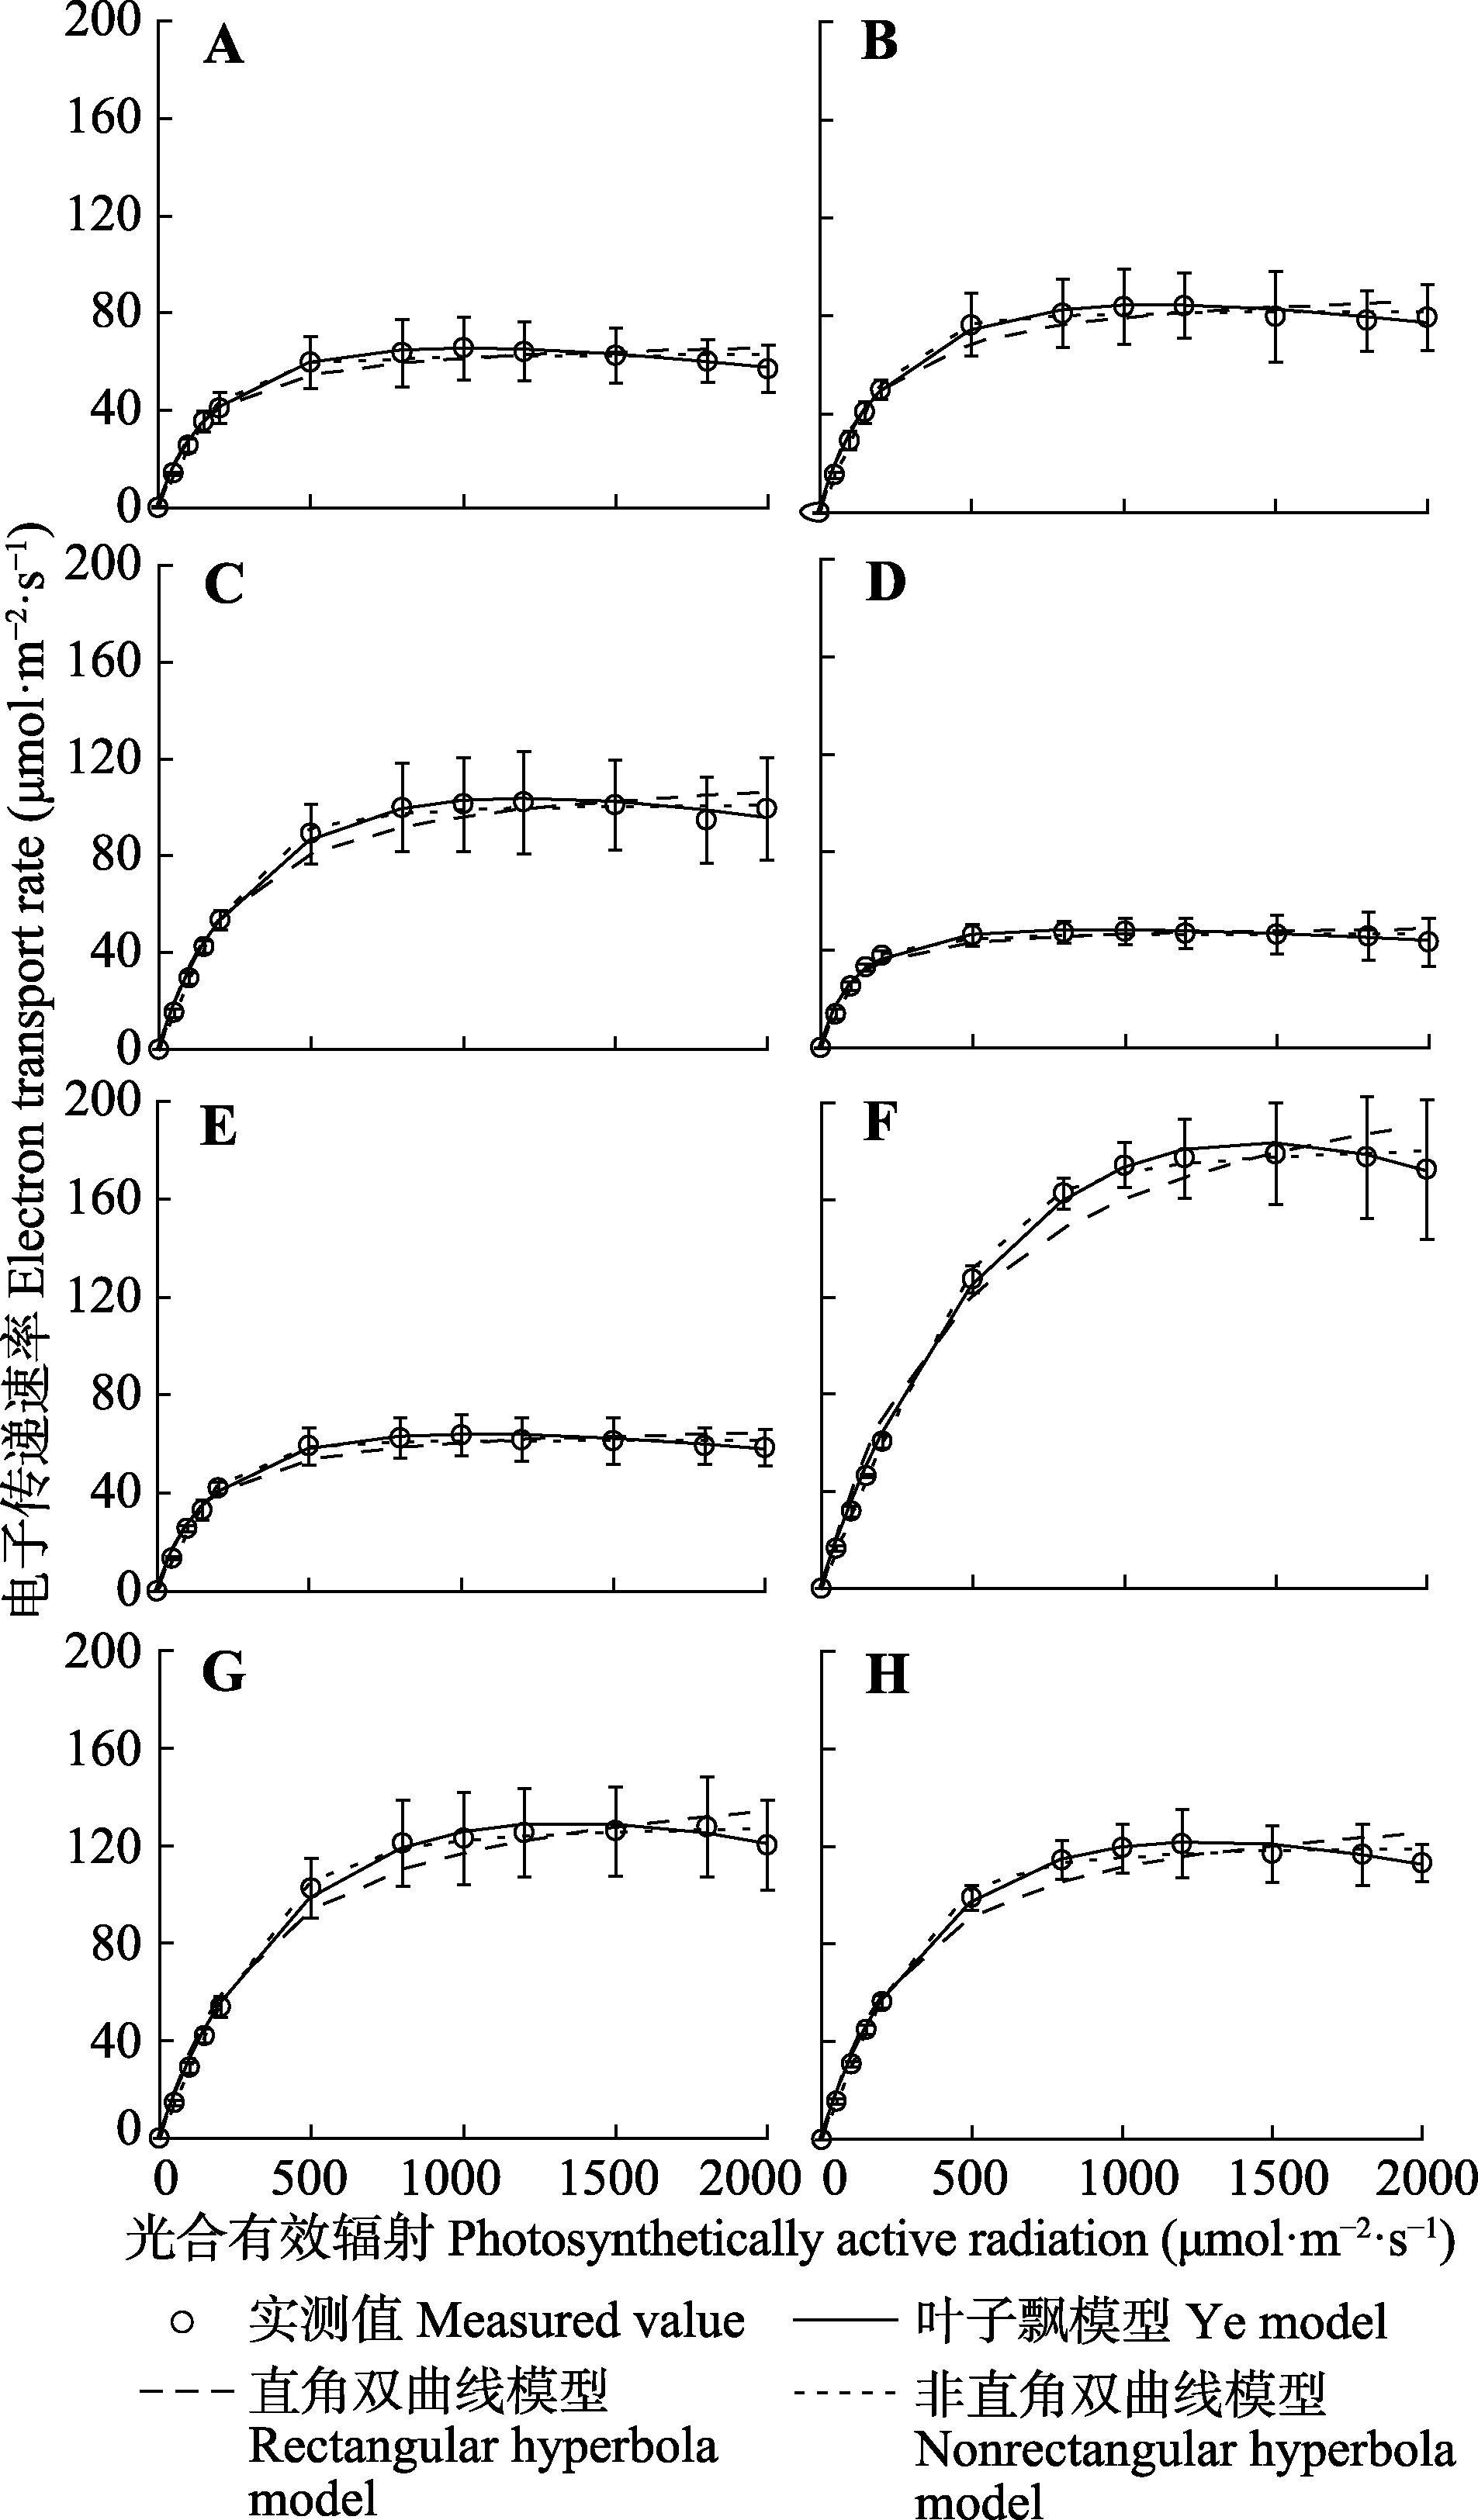
Fig. 1 Electron transport rate light-response curves fitted by different models (rectangular hyperbola, nonrectangular hyperbola and Ye model) for Q. variabilis and R. pseudoacacia (mean ± SE, n = 3). A-D, Q. variabilis in June, July, August and September. E-H, R. pseudoacacia in June, July, August and September.
| 树种 Species | 月份 Month | 模型 Model | α | Isat (μmol·m-2·s-1) | Jmax (μmol·m-2·s-1) | R2 |
|---|---|---|---|---|---|---|
| 栓皮栎 Quercus variabilis | 6月 June | 实测 Measured | - | 1 000 | 65.51 | - |
| 直角双曲线模型 Rectangular hyperbola model | 0.46 ± 0.06 | - | 69.94 ± 5.85 | 0.963 | ||
| 非直角双曲线模型 Nonrectangular hyperbola model | 0.27 ± 0.03 | - | 64.41 ± 4.61 | 0.985 | ||
| 叶子飘模型 Ye model | 0.35 ± 0.03 | 1 042.28 ± 96.81 | 65.23 ± 6.45 | 0.999 | ||
| 7月 July | 实测 Measured | - | 1200 | 84.11 | - | |
| 直角双曲线模型 Rectangular hyperbola model | 0.54 ± 0.05 | - | 89.48 ± 2.60 | 0.971 | ||
| 非直角双曲线模型 Nonrectangular hyperbola model | 0.29 ± 0.04 | - | 79.41 ± 1.48 | 0.994 | ||
| 叶子飘模型 Ye model | 0.41 ± 0.04 | 1 072.50 ± 46.54 | 82.04 ± 2.18 | 0.996 | ||
| 8月 August | 实测 Measured | - | 1 200 | 101.98 | - | |
| 直角双曲线模型 Rectangular hyperbola model | 0.50 ± 0.02 | - | 117.96 ± 7.03 | 0.973 | ||
| 非直角双曲线模型 Nonrectangular hyperbola model | 0.34 ± 0.08 | - | 105.33 ± 2.62 | 0.995 | ||
| 叶子飘模型 Ye model | 0.38 ± 0.02 | 1 184.70 ± 38.30 | 103.60 ± 5.17 | 0.996 | ||
| 9月 September | 实测 Measured | - | 1 000 | 47.55 | - | |
| 直角双曲线模型 Rectangular hyperbola model | 0.57 ± 0.06 | - | 49.94 ± 2.81 | 0.968 | ||
| 非直角双曲线模型 Nonrectangular hyperbola model | 0.28 ± 0.02 | - | 47.02 ± 2.60 | 0.992 | ||
| 叶子飘模型 Ye model | 0.44 ± 0.03 | 990.56 ± 231.06 | 48.20 ± 1.19 | 0.994 | ||
| 刺槐 Robinia pseudoacacia | 6月 June | 实测 Measured | - | 1 000 | 63.57 | - |
| 直角双曲线模型 Rectangular hyperbola model | 0.47 ± 0.03 | - | 68.74 ± 5.31 | 0.970 | ||
| 非直角双曲线模型 Nonrectangular hyperbola model | 0.25 ± 0.01 | - | 62.43 ± 4.79 | 0.987 | ||
| 叶子飘模型 Ye model | 0.36 ± 0.02 | 1 043.59 ± 60.56 | 63.67 ± 4.14 | 0.997 | ||
| 7月 July | 实测 Measured | - | 1500 | 178.89 | - | |
| 直角双曲线模型 Rectangular hyperbola model | 0.50 ± 0.01 | - | 234.74 ± 2.78 | 0.978 | ||
| 非直角双曲线模型 Nonrectangular hyperbola model | 0.30 ± 0.01 | - | 183.35 ± 1.76 | 0.998 | ||
| 叶子飘模型 Ye model | 0.37 ± 0.01 | 1 437.14 ± 24.26 | 182.83 ± 1.21 | 0.998 | ||
| 8月 August | 实测 Measured | - | 1 300 | 127.78 | - | |
| 直角双曲线模型 Rectangular hyperbola model | 0.46 ± 0.02 | - | 156.02 ± 8.13 | 0.976 | ||
| 非直角双曲线模型 Nonrectangular hyperbola model | 0.28 ± 0.02 | - | 129.45 ± 6.91 | 0.997 | ||
| 叶子飘模型 Ye model | 0.36 ± 0.02 | 1 349.56 ± 28.31 | 128.97 ± 6.53 | 0.997 | ||
| 9月 September | 实测 Measured | - | 1 200 | 121.21 | - | |
| 直角双曲线模型 Rectangular hyperbola model | 0.50 ± 0.02 | - | 142.64 ± 5.45 | 0.975 | ||
| 非直角双曲线模型 Nonrectangular hyperbola model | 0.30 ± 0.01 | - | 118.55 ± 5.08 | 0.995 | ||
| 叶子飘模型 Ye model | 0.38 ± 0.01 | 1 275.05 ± 24.58 | 121.47 ± 4.87 | 0.998 |
Table 1 Characteristic parameters of electron transport rate of Quercus variabilis and Robinia pseudoacacia leaves (mean ± SE, n = 3)
| 树种 Species | 月份 Month | 模型 Model | α | Isat (μmol·m-2·s-1) | Jmax (μmol·m-2·s-1) | R2 |
|---|---|---|---|---|---|---|
| 栓皮栎 Quercus variabilis | 6月 June | 实测 Measured | - | 1 000 | 65.51 | - |
| 直角双曲线模型 Rectangular hyperbola model | 0.46 ± 0.06 | - | 69.94 ± 5.85 | 0.963 | ||
| 非直角双曲线模型 Nonrectangular hyperbola model | 0.27 ± 0.03 | - | 64.41 ± 4.61 | 0.985 | ||
| 叶子飘模型 Ye model | 0.35 ± 0.03 | 1 042.28 ± 96.81 | 65.23 ± 6.45 | 0.999 | ||
| 7月 July | 实测 Measured | - | 1200 | 84.11 | - | |
| 直角双曲线模型 Rectangular hyperbola model | 0.54 ± 0.05 | - | 89.48 ± 2.60 | 0.971 | ||
| 非直角双曲线模型 Nonrectangular hyperbola model | 0.29 ± 0.04 | - | 79.41 ± 1.48 | 0.994 | ||
| 叶子飘模型 Ye model | 0.41 ± 0.04 | 1 072.50 ± 46.54 | 82.04 ± 2.18 | 0.996 | ||
| 8月 August | 实测 Measured | - | 1 200 | 101.98 | - | |
| 直角双曲线模型 Rectangular hyperbola model | 0.50 ± 0.02 | - | 117.96 ± 7.03 | 0.973 | ||
| 非直角双曲线模型 Nonrectangular hyperbola model | 0.34 ± 0.08 | - | 105.33 ± 2.62 | 0.995 | ||
| 叶子飘模型 Ye model | 0.38 ± 0.02 | 1 184.70 ± 38.30 | 103.60 ± 5.17 | 0.996 | ||
| 9月 September | 实测 Measured | - | 1 000 | 47.55 | - | |
| 直角双曲线模型 Rectangular hyperbola model | 0.57 ± 0.06 | - | 49.94 ± 2.81 | 0.968 | ||
| 非直角双曲线模型 Nonrectangular hyperbola model | 0.28 ± 0.02 | - | 47.02 ± 2.60 | 0.992 | ||
| 叶子飘模型 Ye model | 0.44 ± 0.03 | 990.56 ± 231.06 | 48.20 ± 1.19 | 0.994 | ||
| 刺槐 Robinia pseudoacacia | 6月 June | 实测 Measured | - | 1 000 | 63.57 | - |
| 直角双曲线模型 Rectangular hyperbola model | 0.47 ± 0.03 | - | 68.74 ± 5.31 | 0.970 | ||
| 非直角双曲线模型 Nonrectangular hyperbola model | 0.25 ± 0.01 | - | 62.43 ± 4.79 | 0.987 | ||
| 叶子飘模型 Ye model | 0.36 ± 0.02 | 1 043.59 ± 60.56 | 63.67 ± 4.14 | 0.997 | ||
| 7月 July | 实测 Measured | - | 1500 | 178.89 | - | |
| 直角双曲线模型 Rectangular hyperbola model | 0.50 ± 0.01 | - | 234.74 ± 2.78 | 0.978 | ||
| 非直角双曲线模型 Nonrectangular hyperbola model | 0.30 ± 0.01 | - | 183.35 ± 1.76 | 0.998 | ||
| 叶子飘模型 Ye model | 0.37 ± 0.01 | 1 437.14 ± 24.26 | 182.83 ± 1.21 | 0.998 | ||
| 8月 August | 实测 Measured | - | 1 300 | 127.78 | - | |
| 直角双曲线模型 Rectangular hyperbola model | 0.46 ± 0.02 | - | 156.02 ± 8.13 | 0.976 | ||
| 非直角双曲线模型 Nonrectangular hyperbola model | 0.28 ± 0.02 | - | 129.45 ± 6.91 | 0.997 | ||
| 叶子飘模型 Ye model | 0.36 ± 0.02 | 1 349.56 ± 28.31 | 128.97 ± 6.53 | 0.997 | ||
| 9月 September | 实测 Measured | - | 1 200 | 121.21 | - | |
| 直角双曲线模型 Rectangular hyperbola model | 0.50 ± 0.02 | - | 142.64 ± 5.45 | 0.975 | ||
| 非直角双曲线模型 Nonrectangular hyperbola model | 0.30 ± 0.01 | - | 118.55 ± 5.08 | 0.995 | ||
| 叶子飘模型 Ye model | 0.38 ± 0.01 | 1 275.05 ± 24.58 | 121.47 ± 4.87 | 0.998 |
| 树种 Species | 月份 Month | 叶位 Leaf position | 拟合/实测 Fitted/measured | α | Isat (μmol·m-2·s-1) | Jmax (μmol·m-2·s-1) | R2 |
|---|---|---|---|---|---|---|---|
| 栓皮栎 Quercus variabilis | 6月 June | 阴生叶 Shaded leaf | 拟合 Fitted | 0.39 ± 0.07 | 1 019.31 ± 55.64 | 55.17 ± 7.31 | 0.993 |
| 实测 Measured | - | 1 000 | 55.49 | - | |||
| 阳生叶 Sunlit leaf | 拟合 Fitted | 0.32 ± 0.01 | 1 075.41 ± 139.41 | 75.66 ± 7.80 | 0.997 | ||
| 实测 Measured | - | 1 000 | 75.53 | - | |||
| 7月 July | 阴生叶 Shaded leaf | 拟合 Fitted | 0.44 ± 0.03 | 981.87 ± 179.95 | 69.97 ± 7.69 | 0.994 | |
| 实测 Measured | - | 1 000 | 68.65 | - | |||
| 阳生叶 Sunlit leaf | 拟合 Fitted | 0.41 ± 0.07 | 1 172.54 ± 172.76 | 95.22 ± 4.41 | 0.996 | ||
| 实测 Measured | - | 1 500 | 94.99 | - | |||
| 8月 August | 阴生叶 Shaded leaf | 拟合 Fitted | 0.40 ± 0.04 | 1 092.35 ± 97.59 | 86.36 ± 7.47 | 0.996 | |
| 实测 Measured | - | 1 000 | 85.40 | - | |||
| 阳生叶 Sunlit leaf | 拟合 Fitted | 0.38 ± 0.02 | 1 246.39 ± 9.25 | 121.32 ± 5.96 | 0.997 | ||
| 实测 Measured | - | 1 200 | 120.60 | - | |||
| 9月 September | 阴生叶 Shaded leaf | 拟合 Fitted | 0.48 ± 0.08 | 736.50 ± 86.71 | 44.07 ± 0.08 | 0.995 | |
| 实测 Measured | - | 1 000 | 43.59 | - | |||
| 阳生叶 Sunlit leaf | 拟合 Fitted | 0.42 ± 0.06 | 1 141.58 ± 119.35 | 53.75 ± 4.93 | 0.991 | ||
| 实测 Measured | - | 1 800 | 53.54 | - | |||
| 刺槐 Robinia pseudoacacia | 6月 June | 阴生叶 Shaded leaf | 拟合 Fitted | 0.37 ± 0.02 | 1 045.23 ± 74.27 | 57.01 ± 6.10 | 0.993 |
| 实测 Measured | - | 1 000 | 57.47 | - | |||
| 阳生叶 Sunlit leaf | 拟合 Fitted | 0.37 ± 0.02 | 1 047.57 ± 76.42 | 70.38 ± 4.50 | 0.997 | ||
| 实测 Measured | - | 1 000 | 69.67 | - | |||
| 7月 July | 阴生叶 Shaded leaf | 拟合 Fitted | 0.38 ± 0.01 | 1 265.91 ± 33.74 | 168.49 ± 5.99 | 0.997 | |
| 实测 Measured | - | 1 000 | 166.75 | - | |||
| 阳生叶 Sunlit leaf | 拟合 Fitted | 0.36 ± 0.02 | 1 654.66 ± 48.58 | 200.67 ± 8.92 | 0.999 | ||
| 实测 Measured | - | 1 800 | 199.69 | - | |||
| 8月 August | 阴生叶 Shaded leaf | 拟合 Fitted | 0.36 ± 0.02 | 1 316.81 ± 39.36 | 112.22 ± 7.87 | 0.997 | |
| 实测 Measured | - | 1 200 | 111.20 | - | |||
| 阳生叶 Sunlit leaf | 拟合 Fitted | 0.37 ± 0.02 | 1 372.99 ± 25.97 | 145.84 ± 9.12 | 0.996 | ||
| 实测 Measured | - | 1 800 | 144.59 | - | |||
| 9月 September | 阴生叶 Shaded leaf | 拟合 Fitted | 0.40 ± 0.01 | 1 240.05 ± 50.69 | 112.46 ± 5.47 | 0.995 | |
| 实测 Measured | - | 1 000 | 111.86 | - | |||
| 阳生叶 Sunlit leaf | 拟合 Fitted | 0.37 ± 0.01 | 1 303.29 ± 46.66 | 130.79 ± 5.67 | 0.998 | ||
| 实测 Measured | - | 1 200 | 133.03 | - |
Table 2 Characteristic parameters of electron transport rate of shaded and sunlit leaves (fitted by Ye model) (mean ± SE, n = 9)
| 树种 Species | 月份 Month | 叶位 Leaf position | 拟合/实测 Fitted/measured | α | Isat (μmol·m-2·s-1) | Jmax (μmol·m-2·s-1) | R2 |
|---|---|---|---|---|---|---|---|
| 栓皮栎 Quercus variabilis | 6月 June | 阴生叶 Shaded leaf | 拟合 Fitted | 0.39 ± 0.07 | 1 019.31 ± 55.64 | 55.17 ± 7.31 | 0.993 |
| 实测 Measured | - | 1 000 | 55.49 | - | |||
| 阳生叶 Sunlit leaf | 拟合 Fitted | 0.32 ± 0.01 | 1 075.41 ± 139.41 | 75.66 ± 7.80 | 0.997 | ||
| 实测 Measured | - | 1 000 | 75.53 | - | |||
| 7月 July | 阴生叶 Shaded leaf | 拟合 Fitted | 0.44 ± 0.03 | 981.87 ± 179.95 | 69.97 ± 7.69 | 0.994 | |
| 实测 Measured | - | 1 000 | 68.65 | - | |||
| 阳生叶 Sunlit leaf | 拟合 Fitted | 0.41 ± 0.07 | 1 172.54 ± 172.76 | 95.22 ± 4.41 | 0.996 | ||
| 实测 Measured | - | 1 500 | 94.99 | - | |||
| 8月 August | 阴生叶 Shaded leaf | 拟合 Fitted | 0.40 ± 0.04 | 1 092.35 ± 97.59 | 86.36 ± 7.47 | 0.996 | |
| 实测 Measured | - | 1 000 | 85.40 | - | |||
| 阳生叶 Sunlit leaf | 拟合 Fitted | 0.38 ± 0.02 | 1 246.39 ± 9.25 | 121.32 ± 5.96 | 0.997 | ||
| 实测 Measured | - | 1 200 | 120.60 | - | |||
| 9月 September | 阴生叶 Shaded leaf | 拟合 Fitted | 0.48 ± 0.08 | 736.50 ± 86.71 | 44.07 ± 0.08 | 0.995 | |
| 实测 Measured | - | 1 000 | 43.59 | - | |||
| 阳生叶 Sunlit leaf | 拟合 Fitted | 0.42 ± 0.06 | 1 141.58 ± 119.35 | 53.75 ± 4.93 | 0.991 | ||
| 实测 Measured | - | 1 800 | 53.54 | - | |||
| 刺槐 Robinia pseudoacacia | 6月 June | 阴生叶 Shaded leaf | 拟合 Fitted | 0.37 ± 0.02 | 1 045.23 ± 74.27 | 57.01 ± 6.10 | 0.993 |
| 实测 Measured | - | 1 000 | 57.47 | - | |||
| 阳生叶 Sunlit leaf | 拟合 Fitted | 0.37 ± 0.02 | 1 047.57 ± 76.42 | 70.38 ± 4.50 | 0.997 | ||
| 实测 Measured | - | 1 000 | 69.67 | - | |||
| 7月 July | 阴生叶 Shaded leaf | 拟合 Fitted | 0.38 ± 0.01 | 1 265.91 ± 33.74 | 168.49 ± 5.99 | 0.997 | |
| 实测 Measured | - | 1 000 | 166.75 | - | |||
| 阳生叶 Sunlit leaf | 拟合 Fitted | 0.36 ± 0.02 | 1 654.66 ± 48.58 | 200.67 ± 8.92 | 0.999 | ||
| 实测 Measured | - | 1 800 | 199.69 | - | |||
| 8月 August | 阴生叶 Shaded leaf | 拟合 Fitted | 0.36 ± 0.02 | 1 316.81 ± 39.36 | 112.22 ± 7.87 | 0.997 | |
| 实测 Measured | - | 1 200 | 111.20 | - | |||
| 阳生叶 Sunlit leaf | 拟合 Fitted | 0.37 ± 0.02 | 1 372.99 ± 25.97 | 145.84 ± 9.12 | 0.996 | ||
| 实测 Measured | - | 1 800 | 144.59 | - | |||
| 9月 September | 阴生叶 Shaded leaf | 拟合 Fitted | 0.40 ± 0.01 | 1 240.05 ± 50.69 | 112.46 ± 5.47 | 0.995 | |
| 实测 Measured | - | 1 000 | 111.86 | - | |||
| 阳生叶 Sunlit leaf | 拟合 Fitted | 0.37 ± 0.01 | 1 303.29 ± 46.66 | 130.79 ± 5.67 | 0.998 | ||
| 实测 Measured | - | 1 200 | 133.03 | - |
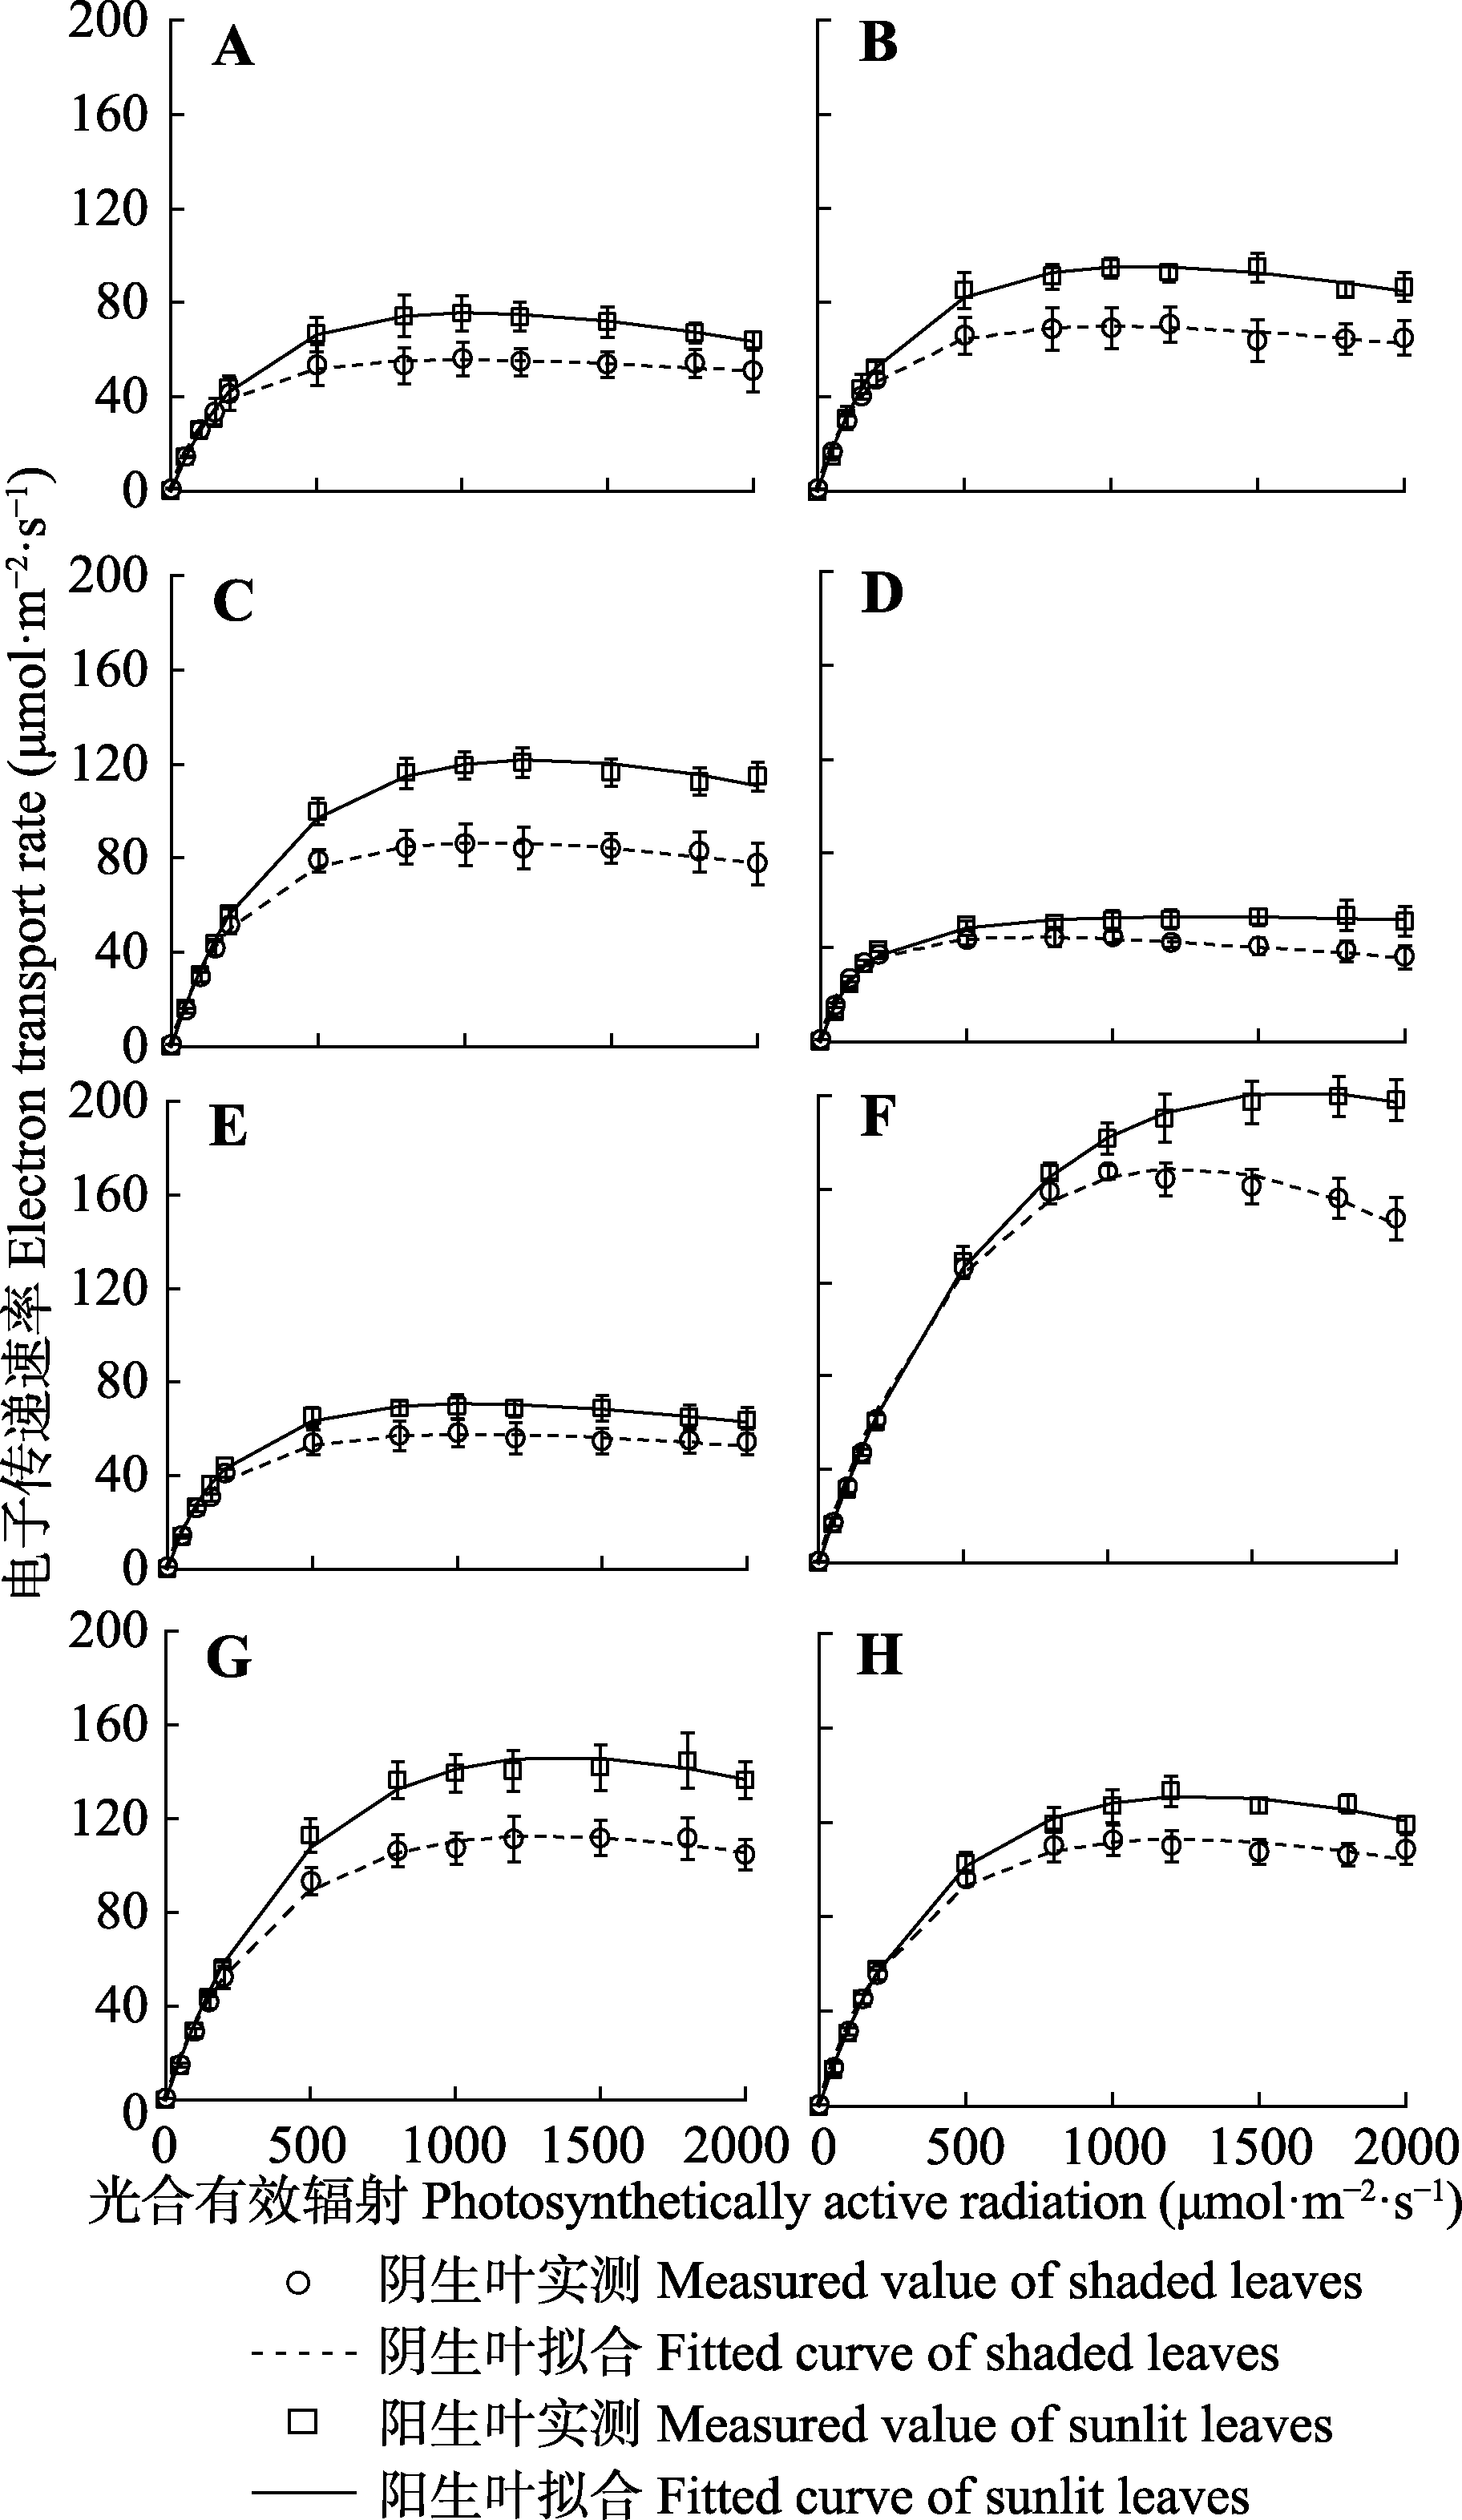
Fig. 2 Electron transport rate light-response curves of shaded and sunlit leaves (fitted by Ye model)(mean ± SE, n = 9). A-D, Q. variabilis in June, July, August and September. E-H, R. pseudoacacia in June, July, August and September.
| 栓皮栎 Quercus variabilis | 刺槐 Robinia pseudoacacia | |||||
|---|---|---|---|---|---|---|
| α | Isat | Jmax | α | Isat | Jmax | |
| Ta | -0.571 | 0.480 | 0.902** | -0.477 | 0.801* | 0.806* |
| SWC | -0.364 | 0.856 | 0.953* | -0.344 | 0.965* | 0.912 |
| Pn | -0.800* | 0.542 | 0.745* | -0.719* | 0.764* | 0.661 |
| Chl | -0.293 | 0.873 | 0.961* | -0.435 | 0.933 | 0.871 |
Table 3 Correlations of characteristic parameters of electron transport rate and bioenvironmental factors in Quercus variabilis and Robinia pseudoacacia
| 栓皮栎 Quercus variabilis | 刺槐 Robinia pseudoacacia | |||||
|---|---|---|---|---|---|---|
| α | Isat | Jmax | α | Isat | Jmax | |
| Ta | -0.571 | 0.480 | 0.902** | -0.477 | 0.801* | 0.806* |
| SWC | -0.364 | 0.856 | 0.953* | -0.344 | 0.965* | 0.912 |
| Pn | -0.800* | 0.542 | 0.745* | -0.719* | 0.764* | 0.661 |
| Chl | -0.293 | 0.873 | 0.961* | -0.435 | 0.933 | 0.871 |
| 1 |
Ambrosio ND, Arena C, Santo AV ( 2006). Temperature response of photosynthesis, excitation energy dissipation and alternative electron sinks to carbon assimilation in Beta vulgaris L. Environmental and Experimental Botany, 55, 248-257.
DOI URL |
| 2 |
Baker NR ( 2008). Chlorophyll fluorescence: A probe of photosynthesis in vivo. Annual Review of Plant Biology, 59, 89-113.
DOI URL |
| 3 |
Baly EC ( 1935). The kinetics of photosynthesis. Proceedings of the Royal Society of London Series B: Biological Sciences, 117, 218-239.
DOI URL |
| 4 | Bernacchi CJ, Morgan PB, Ort DR, Long SP ( 2005). The growth of soybean under free air [CO2] enrichment (FACE) stimulates photosynthesis while decreasing in vivo Rubisco capacity. Planta, 220, 434-446. |
| 5 |
Brading P, Warner ME, Davey P, Smith DJ, Achterberg EP, Suggett DJ ( 2011). Differential effects of ocean acidification on growth and photosynthesis among phylotypes of Symbiodinium (Dinophyceae). Limnology and Oceanography, 56, 927-938.
DOI URL |
| 6 | Caemmerer SV ( 2000). Biochemical Models of Leaf Photosynthesis. CSIRO Publishing, Victoria, Australia. |
| 7 |
Chazdon RL, Pearcy RW, Lee DW, Fetcher N, Mulkey SS ( 1996). Photosynthetic responses of tropical forest plants to contrasting light environments. In: Mulkey SS, Chazdon RL, Smith AP eds. Tropical Forest Plant Ecophysiology. Chapman and Hall, New York. 5-55.
DOI URL |
| 8 |
Chen Y, Xu DQ ( 2006). Two patterns of leaf photosynthetic responses to irradiance transition from saturating to limiting one in some plant species. New Phytologist, 169, 789-798.
DOI URL PMID |
| 9 |
Ding JX, Zou J, Tang LS, Liu WG ( 2015). Photosynthetic characteristics of three different life-form plants in the desert-oasis ecotone of Keriya River Basin. Acta Ecologica Sinica, 35, 733-741.
DOI URL |
|
[ 丁俊祥, 邹杰, 唐立松, 刘卫国 ( 2015). 克里雅河流域荒漠-绿洲交错带3种不同生活型植物的光合特性. 生态学报, 35, 733-741.]
DOI URL |
|
| 10 |
Eichelmann H, Oja V, Peterson RB, Laisk A ( 2011). The rate of nitrite reduction in leaves as indicated by O2 and CO2 exchange during photosynthesis. Journal of Experimental Botany, 62, 2205-2215.
DOI URL PMID |
| 11 |
Ferrier-Pagès C, Tambutté E, Zamoum T, Segonds N, Merle PL, Bensoussan N, Allemand D, Garrabou J, Tambutté S ( 2009). Physiological response of the symbiotic gorgonian Eunicella singularis to a longterm temperature increase. Journal of Experimental Biology, 212, 3007-3015.
DOI URL PMID |
| 12 |
Fila G, Badeck FW, Meyer S, Cerovic Z, Ghashghaie J ( 2006). Relationships between leaf conductance to CO2 diffusion and photosynthesis in micropropagated grapevine plants, before and after ex vitro acclimatization. Journal of Experimental Botany, 57, 2687-2695.
DOI URL PMID |
| 13 |
Flexas J, Barón M, Bota J, Ducruet JM, Gallé A, Galmés J, Jiménez M, Pou A, Ribas-Carbó M, Sajnani C, Tomàs M, Medrano H ( 2009). Photosynthesis limitations during water stress acclimation and recovery in the drought-adapted Vitis hybrid Richter-110 (V. berlandieri var. rupestris). Journal of Experimental Botany, 60, 2361-2377.
DOI URL PMID |
| 14 |
Govindjee ( 2002). A role for a light-harvesting antenna complex of photosystem II in photoprotection. Plant Cell, 14, 1663-1668.
DOI URL PMID |
| 15 |
Guo W, Zhan SY, Yin H, Li XY, Lü X, Yang L, Wang Y ( 2016). Effect of enhanced UV-B radiation on photosynthetic electron transport and light response characteristics of japonica. Journal of Nanjing Agricultural University, 39, 603-610.
DOI URL |
|
[ 郭巍, 战莘晔, 殷红, 李雪莹, 吕晓, 杨璐, 王一 ( 2016). UV-B辐射增强对粳稻光合电子传递与光响应特性的影响. 南京农业大学学报, 39, 603-610.]
DOI URL |
|
| 16 |
Harley PC, Thomas RB, Reynolds JF, Strainet BR ( 1992). Modelling photosynthesis of cotton grown in elevated CO2. Plant, Cell & Environment, 15, 271-282.
DOI URL |
| 17 |
Harrison WG, Platt T ( 1986). Photosynthesis-irradiance relationships in polar and temperate phytoplankton populations. Polar Biology, 5, 153-164.
DOI URL |
| 18 | Hu WH, Ye ZP, Yan XH, Yang XS ( 2017). PSII function and intrinsic characteristics of light-harvesting pigment molecules for sun- and shading-leaf in Magnolia grandiflora during overwintering. Bulletin of Botanical Research, 37, 281-287. |
| [ 胡文海, 叶子飘, 闫小红, 杨旭升 ( 2017). 越冬期广玉兰阳生叶和阴生叶PSII功能及捕光色素分子内禀特性的比较研究. 植物研究, 37, 281-287.] | |
| 19 |
Jian ZY, Wang WQ, Meng L, Xu GF, Wang QL, Li WD, Yu JB ( 2010). Comparison of photosynthetic and fluorescence characteristics among taxa in Paeonia sect. Paeonia. Chinese Journal of Plant Ecology, 34, 1463-1471.
DOI URL |
|
[ 简在友, 王文全, 孟丽, 许桂芳, 王秋玲, 李卫东, 俞敬波 ( 2010). 芍药组内不同类群间光合特性及叶绿素荧光特性比较. 植物生态学报, 34, 1463-1471.]
DOI URL |
|
| 20 |
Joao S, Rui S ( 2004). Can chlorophyll fluorescence be used to estimate photosynthetic production in the seagrass Zosteranoltii. Marine Biology & Ecology, 307, 207-216.
DOI URL |
| 21 |
Kang HJ, Li H, Tao YL, Zhang HL, Quan W, Ouyang Z ( 2015). Discussion on simultaneous measurements of leaf gas exchange and chlorophyll fluorescence for estimating photosynthetic electron allocation. Acta Ecologica Sinica, 35, 1217-1224.
DOI URL |
|
[ 康华靖, 李红, 陶月良, 张海利, 权伟, 欧阳竹 ( 2015). 气体交换与荧光同步测量估算植物光合电子流的分配. 生态学报, 35, 1217-1224.]
DOI URL |
|
| 22 | Larcher W ( 1995). Physiological Plant Ecology. Springer- Verlag Press, Berlin, Heidelberg. |
| 23 |
Lawlor DW, Cornic G ( 2002). Photosynthetic carbon assimilation and associated metabolism in relation to water deficits in higher plants. Plant, Cell & Environment, 25, 275-294.
DOI URL PMID |
| 24 | Li YX, Shen SH, Li L, Wang XM, Zhang FC, Han XM ( 2012). Effects of soil moisture on leaf gas exchange and chlorophyll fluorescence parameters of winter wheat during its late growth stage. Chinese Journal of Ecology, 31, 74-80. |
| [ 李永秀, 申双和, 李丽, 汪秀敏, 张富存, 韩小梅 ( 2012). 土壤水分对冬小麦生育后期叶片气体交换及叶绿素荧光参数的影响. 生态学杂志, 31, 74-80.] | |
| 25 | Liu JJ, Li JY, Zhang JG ( 2015). Influences of drought stress on photosynthetic characteristics and water use efficiency of 4 tree species under elevated CO2 concentration. Forest Research, 28, 339-345. |
| [ 刘娟娟, 李吉跃, 张建国 ( 2015). 高CO2浓度和干旱胁迫对4种树苗光合特性的影响. 林业科学研究, 28, 339-345.] | |
| 26 |
Long SP, Bernacchi CJ ( 2003). Gas exchange measurements, what can they tell us about the underlying limitations to photosynthesis? Procedures and sources of error. Journal of Experimental Botany, 54, 2393-2401.
DOI URL PMID |
| 27 |
Luo WC, Zeng FJ, Liu B, Zhang LG, Liu Z, Song C, Peng SL, Peng HQ ( 2013). Photosynthetic and physiological characteristics of introduced plants at the desert-oasis ecotone. Acta Prataculturae Sinica, 22, 273-280.
DOI URL |
|
[ 罗维成, 曾凡江, 刘波, 张利刚, 刘镇, 宋聪, 彭守兰, 彭慧清 ( 2013). 绿洲-沙漠过渡带引种植物光合生理特征研究. 草业学报, 22, 273-280.]
DOI URL |
|
| 28 |
Martins SCV, Galmés J, Molins A, Damatta FM ( 2013). Improving the estimation of mesophyll conductance to CO2: On the role of electron transport rate correction and respiration. Journal of Experimental Botany, 64, 3285-3298.
DOI URL |
| 29 |
Nelson N, Yocum CF ( 2006). Structure and function of photosystems I and II. Annual Review of Plant Biology, 57, 521-565.
DOI URL PMID |
| 30 |
Ördög A, Wodala B, Rózsavögyi T, Tari I, Horváth F ( 2013). Regulation of guard cell photosynthetic electron transport by nitric oxide. Journal of Experimental Botany, 64, 1357-1366.
DOI URL PMID |
| 31 | Osborne CP, Wythe EJ, Ibrahim DG, Gilbert ME, Ripley BS ( 2008). Low temperature effects on leaf physiology and survivorship in the C3 and C4 subspecies of Alloteropsis semialata. Journal of Experimental Botany, 59, 1743-1754. |
| 32 |
Pavlovic A, Slováková L, Pandolfi C, Mancuso S ( 2011). On the mechanism underlying photosynthetic limitation upon trigger hair irritation in the carnivorous plant venus flytrap (Dionaea muscipula Ellis). Journal of Experimental Botany, 62, 1991-2000.
DOI URL PMID |
| 33 | Platt T, Gallegos CL, Harrison WG ( 1980). Photoinhibition of photosynthesis in natural assemblages of marine phytoplankton. Journal of Marine Research, 38, 687-701. |
| 34 |
Qian Q, Qu LJ, Yuan M, Wang XJ, Yang WC, Wang T, Kong HZ, Jiang GM, Chong K ( 2013). Research advances on plant science in China in 2012. Chinese Bulletin of Botany, 48, 231-287.
DOI URL |
|
[ 钱前, 瞿礼嘉, 袁明, 王小菁, 杨维才, 王台, 孔宏智, 蒋高明, 种康 ( 2013). 2012年中国植物科学若干领域重要研究进展. 植物学报, 48, 231-287.]
DOI URL |
|
| 35 |
Qiu EF, Chen ZM, Hong W, Zheng YS, Huang BL, Yang ZQ ( 2006). Comparison on ecophysiological characteristics between sun and shade leaves in different age Dendrocalamus latiflorus. Acta Ecologica Sinica, 26, 3297-3301.
DOI URL |
|
[ 邱尔发, 陈卓梅, 洪伟, 郑郁善, 黄宝龙, 杨主泉 ( 2006). 不同年龄麻竹阴阳叶生态生理特性. 生态学报, 26, 3297-3301.]
DOI URL |
|
| 36 |
Ralph PJ, Gademann R ( 2005). Rapid light curves: A powerful tool to assess photosynthetic activity. Aquatic Botany, 82, 222-237.
DOI URL |
| 37 |
Rascher U, Liebig M, Lüttge U ( 2000). Evaluation of instant light-response curves of chlorophyll fluorescence parameters obtained with a portable chlorophyll fluorometer onsite in the field. Plant, Cell & Environment, 23, 1397-1405.
DOI URL |
| 38 |
Ren B, Li J, Tong XJ, Mu YM, Zhang JS, Meng P ( 2017). Simulation on photosynthetic light-response of Quercus variabilis and Robinia pseudoacacia in the southern foot of the Taihang Mountain. Chinese Journal of Ecology, 36, 2206-2216.
DOI URL |
|
[ 任博, 李俊, 同小娟, 母艳梅, 张劲松, 孟平 ( 2017). 太行山南麓栓皮栎和刺槐叶片光合光响应模拟. 生态学杂志, 36, 2206-2216.]
DOI URL |
|
| 39 |
Reynolds M, Foulkes J, Furbank R, Griffiths S, King J, Murchie E, Parry M, Slafer G ( 2012). Achieving yield gains in wheat. Plant, Cell & Environment, 35, 1799-1823.
DOI URL PMID |
| 40 |
Robakowski P ( 2005). Susceptibility to low-temperature photoinhibition in three conifers differing in successional status. Tree Physiology, 25, 1151-1160.
DOI URL PMID |
| 41 |
Sofo A, Dichi B, Montanaro G, Xiloyannis C ( 2009). Photosynthetic performance and light response of two olive cultivars under different water and light regimes. Photosynthetica, 47, 602-608.
DOI URL |
| 42 |
Tang WZ, Li XS, Huang HY, Cai CE, Huo YZ, He PM ( 2009). Effects of different light intensity and temperature treatment on photosynthesis and chlorophyll fluorescence in Ulva linza. Journal of Fisheries of China, 33, 752-769.
DOI URL |
|
[ 汤文仲, 李信书, 黄海燕, 蔡春尔, 霍元子, 何培民 ( 2009). 不同光强和温度对长石莼(缘管浒苔)光合作用和叶绿素荧光参数的影响. 水产学报, 33, 752-769.]
DOI URL |
|
| 43 | Thornley JHM ( 1976). Mathematical Models in Plant Physiology. Academic Press, London. |
| 44 |
White AJ, Critchley C ( 1999). Rapid light curves: A new fluorescence method to assess the state of the photosynthetic apparatus. Photosynthesis Research, 59, 63-72.
DOI URL |
| 45 |
Xie JM, Yu JH, Huang GB, Feng Z ( 2011). Correlations between changes of absorption and transformation of light energy by PSII in pepper leaves and the variety tolerance under low temperature & weak light. Scientia Agricultura Sinica, 44, 1855-1862.
DOI URL |
|
[ 颉建明, 郁继华, 黄高宝, 冯致 ( 2011). 低温弱光下辣椒叶片PSII光能吸收和转换变化及与品种耐性的关系. 中国农业科学, 44, 1855-1862.]
DOI URL |
|
| 46 | Xu DQ ( 2013). Photosynthesis. Science Press, Beijing. |
| [ 许大全 ( 2013). 光合作用学. 科学出版社, 北京.] | |
| 47 |
Xu JZ, Yu YM, Pen SZ, Yang SH, Liao LX ( 2014). A modified nonrectangular hyperbola equation for photosynthetic light-response curves of leaves with different nitrogen status. Photosynthetica, 52, 117-123.
DOI URL |
| 48 |
Xu L, Gao ZQ, An W, Li YL, Jiao XF, Wang CY ( 2016). Flag leaf photosynthetic characteristics, change in chlorophyll fluorescence parameters, and their relationship with yield of winter wheat sowed in spring. Chinese Journal of Applied Ecology, 27, 133-142.
DOI URL |
|
[ 徐澜, 高志强, 安伟, 李彦良, 焦雄飞, 王创云 ( 2016). 冬麦春播条件下旗叶光合特性、叶绿素荧光参数变化及其与产量的关系. 应用生态学报, 27, 133-142.]
DOI URL |
|
| 49 |
Yan LX, Yu ZW, Shi Y, Zhao JY, Zhang YL ( 2017). Effects of supplemental irrigation based on soil moisture measurement on flag leaf chlorophyll fluorescence and senescence characteristics in two wheat cultivars. Scientia Agricultura Sinica, 50, 1416-1429.
DOI URL |
|
[ 闫丽霞, 于振文, 石玉, 赵俊晔, 张永丽 ( 2017). 测墒补灌对2个小麦品种旗叶叶绿素荧光及衰老特性的影响. 中国农业科学, 50, 1416-1429.]
DOI URL |
|
| 50 | Yan XH, Yin JH, Duan SH, Zouh B, Hu WH, Liu S ( 2013). Photosynthesis light response curves of four rice varieties and model fitting. Chinese Journal of Ecology, 32, 604-610. |
| [ 闫小红, 尹建华, 段世华, 周兵, 胡文海, 刘帅 ( 2013). 四种水稻品种的光合光响应曲线及其模型拟合. 生态学杂志, 32, 604-610.] | |
| 51 |
Yan XH, Zhou B, Wang N, Ye ZP, Yin ZF ( 2016). Differences of photosynthetic characteristics based on a mechanistic model of light-response for three herbaceous plants. Journal of Nanjing Forestry University (Natural Sciences Edition), 40, 63-69.
DOI URL |
|
[ 闫小红, 周兵, 王宁, 叶子飘, 尹增芳 ( 2016). 基于光响应机理模型的3种草本植物光合特性差异解析. 南京林业大学学报(自然科学版), 40, 63-69.]
DOI URL |
|
| 52 | Yao CY, Lu XS, Xu DW, Wu J ( 2011). Study on the relations of six forage’s photo-response characteristics and aboveground biomass under orchard. Chinese Agricultural Science Bulletin, 27, 69-73. |
| [ 姚春艳, 卢欣石, 徐大伟, 吴健 ( 2011). 果林下6种牧草的光响应特性与地上生物量关系的研究. 中国农学通报, 27, 69-73.] | |
| 53 |
Yao JP, Chen L, Cui HX, Yao T ( 2010). Responses of photosynthesis and heat-tolerance in seedling of four lilacs to high-temperature. Grassland & Turf,( 5), 50- 55, 58.
DOI URL |
|
[ 姚军朋, 陈莉, 崔洪霞, 姚拓 ( 2010). 丁香属植物光合机构的热响应特征研究. 草原与草坪,( 5), 50- 55, 58.]
DOI URL |
|
| 54 |
Ye ZP, Hu WH, Xiao YA, Fan DY, Yin JH, Duan SH, Yan XH, He L, Zhang SS ( 2014). A mechanistic model of light-response of photosynthetic electron flow and its application. Chinese Journal of Plant Ecology, 38, 1241-1249.
DOI URL |
|
[ 叶子飘, 胡文海, 肖宜安, 樊大勇, 尹建华, 段世华, 闫小红, 贺俐, 张斯斯 ( 2014). 光合电子流对光响应的机理模型及其应用. 植物生态学报, 38, 1241-1249.]
DOI URL |
|
| 55 |
Ye ZP, Hu WH, Yan XH ( 2016 a). Comparison on light-response models of actual photochemical efficiency in photosystem II. Chinese Journal of Plant Ecology, 40, 1208-1217.
DOI URL |
|
[ 叶子飘, 胡文海, 闫小红 ( 2016 a). 光系统II实际光化学量子效率对光的响应模型的比较. 植物生态学报, 40, 1208-1217.]
DOI URL |
|
| 56 |
Ye ZP, Hu WH, Yan XH, Duan SH ( 2016 b). Photosynthetic characteristics of different plant species based on a mechanistic model of light-response of photosynthesis. Chinese Journal of Ecology, 35, 2544-2552.
DOI URL |
|
[ 叶子飘, 胡文海, 闫小红, 段世华 ( 2016 b). 基于光响应机理模型的不同植物光合特性. 生态学杂志, 35, 2544-2552.]
DOI URL |
|
| 57 | Ye ZP, Kang HJ, Tao YL, Wang LX ( 2011). Comparative analysis on the fitting effect of different models of Koelreuteria bipinnata var. integrifoliola rapid light curves. Chinese Journal of Ecology, 30, 1662-1667. |
| [ 叶子飘, 康华靖, 陶月良, 王立新 ( 2011). 不同模型对黄山栾树快速光曲线拟合效果的比较. 生态学杂志, 30, 1662-1667.] | |
| 58 |
Ye ZP, Robakowski P, Suggett DJ ( 2013 a). A mechanistic model for the light response of photosynthetic electron transport rate based on light harvesting properties of photosynthetic pigment molecules. Planta, 237, 837-847.
DOI URL PMID |
| 59 |
Ye ZP, Suggett JD, Robakowski P, Kang HJ ( 2013 b). A mechanistic model for the photosynthesis-light response based on the photosynthetic electron transport of photosystem II in C3 and C4 species. New Phytologist, 199, 110-120.
DOI URL PMID |
| 60 |
Ye ZP, Yan XH, Duan SH ( 2015). Investigation on the relationship between saturation irradiance and chlorophyll contents of flag leaves and intrinsic characteristics of light-harvesting pigment molecules in high-yielding rice. Journal of Jinggangshan University (Natural Science), 36, 25-32.
DOI URL |
|
[ 叶子飘, 闫小红, 段世华 ( 2015). 高产水稻剑叶的叶绿素含量、捕光色素分子的内禀特性与饱和光强关系的研究. 井冈山大学学报(自然科学版), 36, 25-32.]
DOI URL |
|
| 61 | Ye ZP, Zhao ZH ( 2009). Effects of shading on the photosynthesis and chlorophyll content of Bidens pilosa. Chinese Journal of Ecology, 28, 19-22. |
| [ 叶子飘, 赵则海 ( 2009). 遮光对三叶鬼针草光合作用和叶绿素含量的影响. 生态学杂志, 28, 19-22.] | |
| 62 |
Yun JY, Yang JD, Zhao HL ( 2006). Research progress in the mechanism for drought and high temperature to affect plant photosynthesis. Acta Botanica Boreali-Occidentalia Sinica, 26, 641-648.
DOI URL |
|
[ 云建英, 杨甲定, 赵哈林 ( 2006). 干旱和高温对植物光合作用的影响机制研究进展. 西北植物学报, 26, 641-648.]
DOI URL |
|
| 63 |
Zeng ZF, Yan XH, Hu WH ( 2014). Effects of NaCl stress on plant growth and photosynthetic characteristics in the cucumber seedling. Journal of Jinggangshan University (Natural Science), 35, 39-42.
DOI URL |
|
[ 曾志峰, 严小红, 胡文海 ( 2014). NaCl胁迫对黄瓜幼苗生长及光合作用特征的影响. 井冈山大学学报(自然科学版), 35, 39-42.]
DOI URL |
|
| 64 |
Zhang GS, Hao L, Yan ZJ, Zhao X, Wang Y, Bai YR, Li XL ( 2017). The responses of chlorophyll fluorescence kinetics parameters of six tree species to soil moisture changes. Chinese Journal of Ecology, 36, 3079-3085.
DOI URL |
|
[ 张国盛, 郝蕾, 闫子娟, 赵鑫, 王颖, 白玉荣, 李小龙 ( 2017). 6种树种叶片叶绿素荧光动力学参数对土壤水分变化的响应. 生态学杂志, 36, 3079-3085.]
DOI URL |
|
| 65 |
Zhang LG, Zeng FJ, Liu B, Liu Z, An GX, Li HF, Yuan N ( 2012). Study of the photosynthesis characteristics and physical signs of four plants at the desert-oasis ecoton. Acta Prataculturae Sinica, 21, 103-111.
DOI URL |
|
[ 张利刚, 曾凡江, 刘波, 刘镇, 安桂香, 李海峰, 袁娜 ( 2012). 绿洲-荒漠过渡带四种植物光合及生理特征的研究. 草业学报, 21, 103-111.]
DOI URL |
|
| 66 | Zhang SS ( 2014). Effect of Simulated Warming on Photosynthetic Adaptability and Reproductive Ecology of Invasive Solidago Canadensis, Bidens frondosa and Native Pterocypsela laciniata. Master degree dissertation, Southwest University Chongqing. |
| [ 张斯斯 ( 2014). 模拟增温对菊科2种入侵植物繁殖生态学及光合特性的影响. 硕士学位论文, 西南大学, 重庆.] | |
| 67 | Zhang YZ, Li HD, Li X, Xiao J, Xu K ( 2013). Effects of light intensity and water stress on leaf photosynthetic characteristics of ginger. Acta Horticulturae Sinica, 40, 2255-2262. |
| [ 张永征, 李海东, 李秀, 肖静, 徐坤 ( 2013). 光强和水分胁迫对姜叶片光合特性的影响. 园艺学报, 40, 2255-2262.] | |
| 68 | Zhong CF, Wu XY, Yao HJ, Shi Z, Gao RF ( 2008). Characteristics of chlorophyll a fluorescence kinetics of Euonymus japonicus during early spring in Beijing region. Journal of Beijing Forestry University, 30, 9-15. |
| [ 钟传飞, 武晓颖, 姚洪军, 施征, 高荣孚 ( 2008). 北京地区大叶黄杨春初返青过程的叶绿素荧光动力学研究. 北京林业大学学报, 30, 9-15.] |
| [1] | ZHANG Yi-Ping, HAI Xu-Ying, XU Jun-Liang, WU Wen-Xia, CAO Peng-He, AN Wen-Jing. Seasonal dynamics of non-structural carbohydrate content in branch of Quercus variabilis growing in east Qinling Mountain range [J]. Chin J Plant Ecol, 2019, 43(6): 521-531. |
| [2] | ZHOU Xuan,HE Zheng-Biao,KANG Hong-Zhang,SUN Xiao,LIU Chun-Jiang. Variations of seed morphology related to climate for Quercus variabilis across temperate- subtropical China [J]. Chin J Plant Ecol, 2013, 37(6): 481-491. |
| [3] | WU Fang, CHEN Yun-Ming, YU Zhan-Hui. Growing season sap-flow dynamics of Robinia pseudoacacia plantation in the semi-arid region of Loess Plateau, China [J]. Chin J Plant Ecol, 2010, 34(4): 469-476. |
| [4] | YI Ying-Hua, FAN Da-Yong, XIE Zong-Qiang, CHEN Fang-Qing. EFFECTS OF WATERLOGGING ON THE GAS EXCHANGE, CHLOROPHYLL FLUORESCENCE AND WATER POTENTIAL OF QUERCUS VARIABILIS AND PTEROCARYA STENOPTERA [J]. Chin J Plant Ecol, 2006, 30(6): 960-968. |
| Viewed | ||||||
|
Full text |
|
|||||
|
Abstract |
|
|||||
Copyright © 2022 Chinese Journal of Plant Ecology
Tel: 010-62836134, 62836138, E-mail: apes@ibcas.ac.cn, cjpe@ibcas.ac.cn