
Chin J Plant Ecol ›› 2014, Vol. 38 ›› Issue (7): 675-686.DOI: 10.3724/SP.J.1258.2014.00063
• Research Articles • Previous Articles Next Articles
PENG Zi1, GU Cheng-Yan1, LIU Zhi-Yong2, LIN Wen3, ZHOU Ping1,*( )
)
Received:2013-12-16
Accepted:2014-02-26
Online:2014-12-16
Published:2014-07-10
Contact:
ZHOU Ping
PENG Zi, GU Cheng-Yan, LIU Zhi-Yong, LIN Wen, ZHOU Ping. Impact of land use change during 1989-2009 on eco-capacity in Dongjiang watershed[J]. Chin J Plant Ecol, 2014, 38(7): 675-686.
Add to citation manager EndNote|Ris|BibTeX
URL: https://www.plant-ecology.com/EN/10.3724/SP.J.1258.2014.00063
| 分类精度 Classification accuracy | 1989 | 1994 | 1999 | 2004 | 2009 |
|---|---|---|---|---|---|
| 精度 Accuracy (%) | 90.59 | 85.19 | 87.64 | 87.85 | 87.63 |
| Kappa系数 Kappa coefficient | 0.874 6 | 0.821 0 | 0.864 6 | 0.848 4 | 0.853 4 |
Table 1 Classification accuracy of Landsat TM images for 1989, 1994, 1999, 2004, and 2009
| 分类精度 Classification accuracy | 1989 | 1994 | 1999 | 2004 | 2009 |
|---|---|---|---|---|---|
| 精度 Accuracy (%) | 90.59 | 85.19 | 87.64 | 87.85 | 87.63 |
| Kappa系数 Kappa coefficient | 0.874 6 | 0.821 0 | 0.864 6 | 0.848 4 | 0.853 4 |
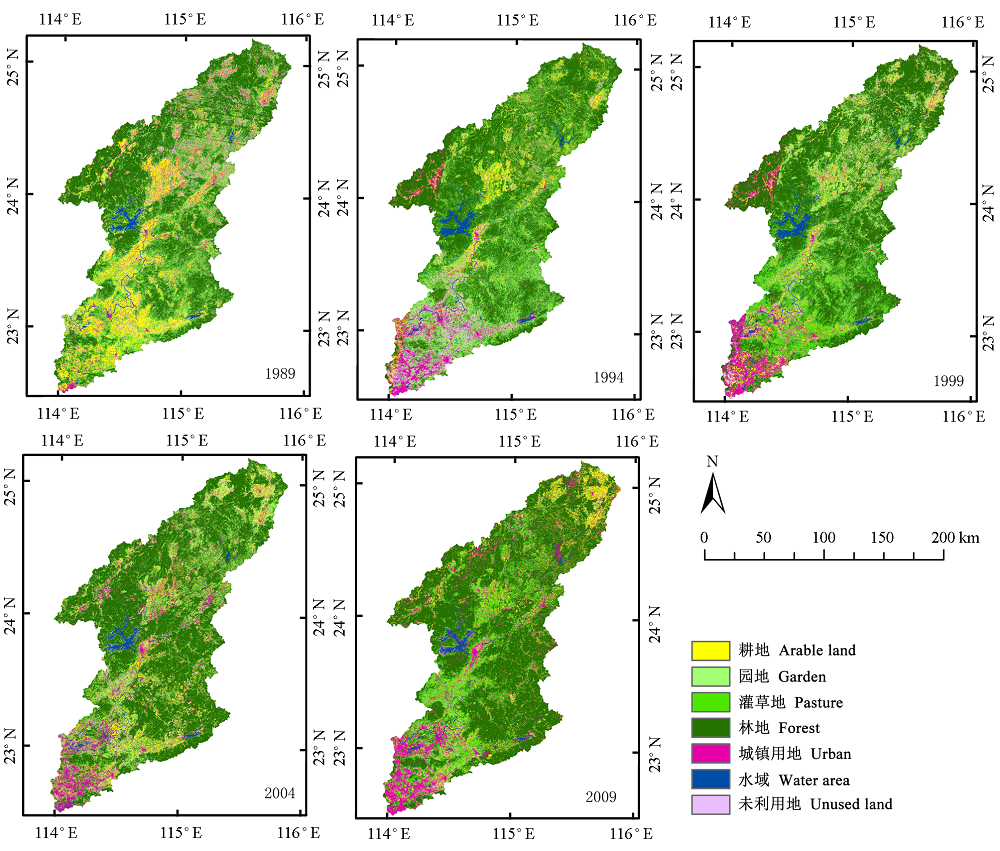
Fig. 1 Spatial patterns of land use types in Dongjiang River watershed in 1989, 1994, 1999, 2004, and 2009.
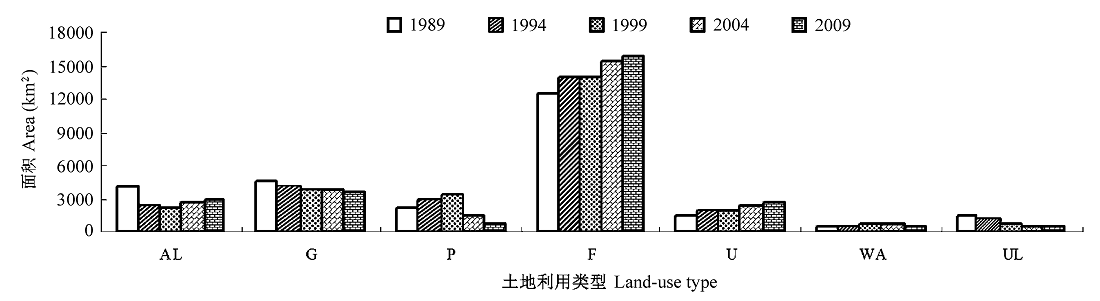
Fig. 2 Patterns of land use types by area in Dongjiang River watershed in 1989, 1994, 1999, 2004, and 2009. AL, arable land; F, forest; G, garden; P, pasture; UL, unused land; U, urban; WA, water area.
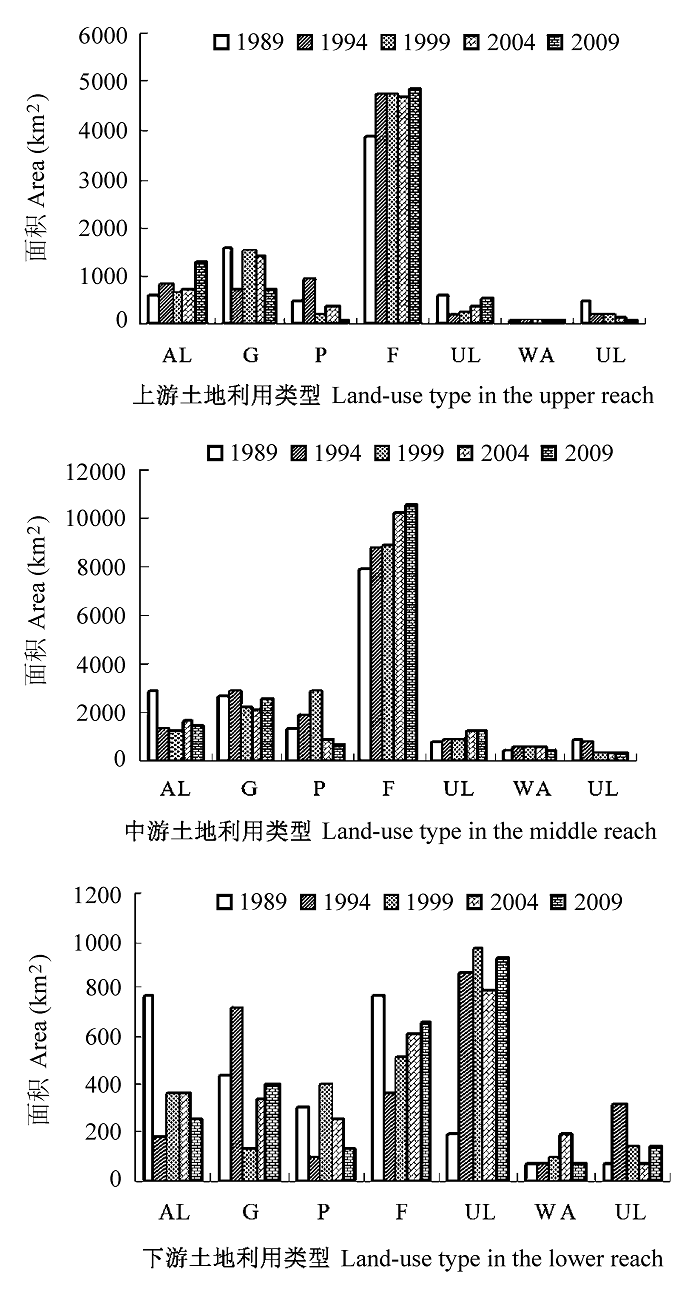
Fig. 3 Patterns of land use types by area in the upper, middle and lower reaches in Dongjiang River watershed. AL, arable land; F, forest; G, garden; P, pasture; UL, unused land; U, urban; WA, water area.
| 时间区间 Time interval | 统计类型 Statistic type | AL | G | P | F | U | WA | UL | LC | |
|---|---|---|---|---|---|---|---|---|---|---|
| 东江流域 Dongjiang River watershed | 1989-1994 | KT | -46.30% | -8.44% | 33.85% | 10.64% | 21.79% | 10.69% | -4.90% | 0.018 1 |
| K | -0.093 0 | -0.017 0 | 0.068 0 | 0.021 0 | 0.044 0 | 0.021 0 | -0.010 0 | |||
| 1994-1999 | KT | -6.36% | -9.64% | 21.45% | 1.49% | 13.97% | 10.08% | -45.92% | 0.008 4 | |
| K | -0.013 0 | -0.019 0 | 0.043 0 | 0.003 0 | 0.028 0 | 0.020 0 | -0.092 0 | |||
| 1999-2004 | KT | 25.58% | -1.00% | -57.46% | 9.78% | 10.93% | 10.57% | -30.69% | 0.016 5 | |
| K | 0.051 0 | -0.002 0 | -0.115 0 | 0.020 0 | 0.022 0 | 0.021 0 | -0.061 0 | |||
| 2004-2009 | KT | 9.96% | -5.93% | -45.07% | 3.51% | 12.76% | -29.42% | -0.44% | 0.008 2 | |
| K | 0.020 0 | -0.012 0 | -0.090 0 | 0.007 0 | 0.026 0 | -0.059 0 | -0.001 0 | |||
| 上游 Upper reach | 1989-1994 | KT | 36.90% | -55.20% | 102.53% | 22.30% | -72.95% | -31.89% | -55.57% | 0.041 0 |
| K | 0.073 8 | -0.110 4 | 0.205 1 | 0.044 6 | -0.145 9 | -0.063 8 | -0.111 1 | |||
| 1994-1999 | KT | -23.67% | 119.30% | -82.96% | 0.11% | 61.15% | 13.51% | 12.91% | 0.025 4 | |
| K | -0.047 3 | 0.238 6 | -0.165 9 | 0.000 2 | 0.122 3 | 0.027 0 | 0.025 8 | |||
| 1999-2004 | KT | 5.67% | -9.91% | 118.94% | -2.36% | 50.19% | 7.96% | -40.41% | 0.009 3 | |
| K | 0.011 3 | -0.019 8 | 0.237 9 | -0.004 7 | 0.100 4 | 0.015 9 | -0.080 8 | |||
| 2004-2009 | KT | 91.01% | -47.39% | -70.35% | 3.79% | 43.10% | -24.59% | -29.05% | 0.024 9 | |
| K | 0.182 0 | -0.094 8 | -0.140 7 | 0.007 6 | 0.086 2 | -0.049 2 | -0.058 1 | |||
| 中游 Middle reach | 1989-1994 | KT | -55.57% | 6.63% | 34.12% | 11.09% | 10.23% | 19.08% | -7.18% | 0.019 9 |
| K | -0.111 1 | 0.013 3 | 0.068 2 | 0.022 2 | 0.020 5 | 0.038 2 | -0.014 4 | |||
| 1994-1999 | KT | -9.96% | -22.62% | 57.97% | 0.50% | 7.48% | 7.98% | -57.19% | 0.014 3 | |
| K | -0.019 9 | -0.045 2 | 0.115 9 | 0.001 0 | 0.015 0 | 0.016 0 | -0.114 4 | |||
| 1999-2004 | KT | 44.61% | -4.77% | -69.96% | 15.94% | 32.41% | -6.22% | -16.28% | 0.026 3 | |
| K | 0.089 2 | -0.009 5 | -0.139 9 | 0.031 9 | 0.064 8 | -0.012 4 | -0.032 6 | |||
| 2004-2009 | KT | -14.45% | 17.27% | -34.04% | 3.02% | -0.65% | -18.53% | -13.77% | 0.008 0 | |
| K | -0.028 9 | 0.034 5 | -0.068 1 | 0.006 0 | -0.001 3 | -0.037 1 | -0.027 5 | |||
| 下游 Lower reach | 1989-1994 | KT | -76.64% | 65.76% | -70.62% | -52.75% | 352.54% | 7.11% | 351.88% | 0.092 9 |
| K | -0.153 3 | 0.131 5 | -0.141 2 | -0.105 5 | 0.705 1 | 0.014 2 | 0.703 8 | |||
| 1994-1999 | KT | 98.62% | -82.62% | 357.60% | 43.64% | 11.58% | 21.50% | -57.08% | 0.059 3 | |
| K | 0.197 2 | -0.165 2 | 0.715 2 | 0.087 3 | 0.023 2 | 0.043 0 | -0.114 2 | |||
| 1999-2004 | KT | -0.86% | 174.44% | -37.46% | 16.31% | -18.59% | 110.67% | -48.29% | 0.030 8 | |
| K | -0.001 7 | 0.348 9 | -0.074 9 | 0.032 6 | -0.037 2 | 0.221 3 | -0.096 6 | |||
| 2004-2009 | KT | -27.29% | 17.40% | -48.25% | 9.69% | 17.85% | -59.44% | 106.12% | 0.025 5 | |
| K | -0.054 6 | 0.034 8 | -0.096 5 | 0.019 4 | 0.035 7 | -0.118 9 | 0.212 2 |
Table 2 Variations in land use types in Dongjiang River watershed during different periods between 1989-2009
| 时间区间 Time interval | 统计类型 Statistic type | AL | G | P | F | U | WA | UL | LC | |
|---|---|---|---|---|---|---|---|---|---|---|
| 东江流域 Dongjiang River watershed | 1989-1994 | KT | -46.30% | -8.44% | 33.85% | 10.64% | 21.79% | 10.69% | -4.90% | 0.018 1 |
| K | -0.093 0 | -0.017 0 | 0.068 0 | 0.021 0 | 0.044 0 | 0.021 0 | -0.010 0 | |||
| 1994-1999 | KT | -6.36% | -9.64% | 21.45% | 1.49% | 13.97% | 10.08% | -45.92% | 0.008 4 | |
| K | -0.013 0 | -0.019 0 | 0.043 0 | 0.003 0 | 0.028 0 | 0.020 0 | -0.092 0 | |||
| 1999-2004 | KT | 25.58% | -1.00% | -57.46% | 9.78% | 10.93% | 10.57% | -30.69% | 0.016 5 | |
| K | 0.051 0 | -0.002 0 | -0.115 0 | 0.020 0 | 0.022 0 | 0.021 0 | -0.061 0 | |||
| 2004-2009 | KT | 9.96% | -5.93% | -45.07% | 3.51% | 12.76% | -29.42% | -0.44% | 0.008 2 | |
| K | 0.020 0 | -0.012 0 | -0.090 0 | 0.007 0 | 0.026 0 | -0.059 0 | -0.001 0 | |||
| 上游 Upper reach | 1989-1994 | KT | 36.90% | -55.20% | 102.53% | 22.30% | -72.95% | -31.89% | -55.57% | 0.041 0 |
| K | 0.073 8 | -0.110 4 | 0.205 1 | 0.044 6 | -0.145 9 | -0.063 8 | -0.111 1 | |||
| 1994-1999 | KT | -23.67% | 119.30% | -82.96% | 0.11% | 61.15% | 13.51% | 12.91% | 0.025 4 | |
| K | -0.047 3 | 0.238 6 | -0.165 9 | 0.000 2 | 0.122 3 | 0.027 0 | 0.025 8 | |||
| 1999-2004 | KT | 5.67% | -9.91% | 118.94% | -2.36% | 50.19% | 7.96% | -40.41% | 0.009 3 | |
| K | 0.011 3 | -0.019 8 | 0.237 9 | -0.004 7 | 0.100 4 | 0.015 9 | -0.080 8 | |||
| 2004-2009 | KT | 91.01% | -47.39% | -70.35% | 3.79% | 43.10% | -24.59% | -29.05% | 0.024 9 | |
| K | 0.182 0 | -0.094 8 | -0.140 7 | 0.007 6 | 0.086 2 | -0.049 2 | -0.058 1 | |||
| 中游 Middle reach | 1989-1994 | KT | -55.57% | 6.63% | 34.12% | 11.09% | 10.23% | 19.08% | -7.18% | 0.019 9 |
| K | -0.111 1 | 0.013 3 | 0.068 2 | 0.022 2 | 0.020 5 | 0.038 2 | -0.014 4 | |||
| 1994-1999 | KT | -9.96% | -22.62% | 57.97% | 0.50% | 7.48% | 7.98% | -57.19% | 0.014 3 | |
| K | -0.019 9 | -0.045 2 | 0.115 9 | 0.001 0 | 0.015 0 | 0.016 0 | -0.114 4 | |||
| 1999-2004 | KT | 44.61% | -4.77% | -69.96% | 15.94% | 32.41% | -6.22% | -16.28% | 0.026 3 | |
| K | 0.089 2 | -0.009 5 | -0.139 9 | 0.031 9 | 0.064 8 | -0.012 4 | -0.032 6 | |||
| 2004-2009 | KT | -14.45% | 17.27% | -34.04% | 3.02% | -0.65% | -18.53% | -13.77% | 0.008 0 | |
| K | -0.028 9 | 0.034 5 | -0.068 1 | 0.006 0 | -0.001 3 | -0.037 1 | -0.027 5 | |||
| 下游 Lower reach | 1989-1994 | KT | -76.64% | 65.76% | -70.62% | -52.75% | 352.54% | 7.11% | 351.88% | 0.092 9 |
| K | -0.153 3 | 0.131 5 | -0.141 2 | -0.105 5 | 0.705 1 | 0.014 2 | 0.703 8 | |||
| 1994-1999 | KT | 98.62% | -82.62% | 357.60% | 43.64% | 11.58% | 21.50% | -57.08% | 0.059 3 | |
| K | 0.197 2 | -0.165 2 | 0.715 2 | 0.087 3 | 0.023 2 | 0.043 0 | -0.114 2 | |||
| 1999-2004 | KT | -0.86% | 174.44% | -37.46% | 16.31% | -18.59% | 110.67% | -48.29% | 0.030 8 | |
| K | -0.001 7 | 0.348 9 | -0.074 9 | 0.032 6 | -0.037 2 | 0.221 3 | -0.096 6 | |||
| 2004-2009 | KT | -27.29% | 17.40% | -48.25% | 9.69% | 17.85% | -59.44% | 106.12% | 0.025 5 | |
| K | -0.054 6 | 0.034 8 | -0.096 5 | 0.019 4 | 0.035 7 | -0.118 9 | 0.212 2 |
| AL | G | P | F | U | WA | UL | 小计 Total | ||
|---|---|---|---|---|---|---|---|---|---|
| 上游 Upper reach | AL | 207.49 | 134.02 | 17.21 | 168.75 | 58.08 | 4.20 | 17.40 | 607.16 |
| G | 294.10 | 125.57 | 15.47 | 998.51 | 104.85 | 4.59 | 13.61 | 1 556.69 | |
| P | 84.05 | 102.99 | 16.49 | 225.74 | 15.50 | 0.56 | 12.96 | 458.28 | |
| F | 372.89 | 135.66 | 29.84 | 3 072.97 | 238.97 | 9.25 | 31.75 | 3 891.33 | |
| U | 180.33 | 91.89 | 8.06 | 192.44 | 99.41 | 6.09 | 5.47 | 583.70 | |
| WA | 5.36 | 2.91 | 0.50 | 29.37 | 14.06 | 21.96 | 0.81 | 74.98 | |
| UL | 136.25 | 131.84 | 15.07 | 140.28 | 15.91 | 0.54 | 14.32 | 454.21 | |
| 小计 Total | 1 280.47 | 724.87 | 102.65 | 4 828.07 | 546.79 | 47.19 | 96.32 | 7 626.35 | |
| 变化 Change | 1 072.98 | 599.30 | 86.15 | 1 755.09 | 447.37 | 25.24 | 82.00 | - | |
| 中游 Middle reach | AL | 308.22 | 397.65 | 53.55 | 308.30 | 189.21 | 8.26 | 26.11 | 1 291.28 |
| G | 191.53 | 447.56 | 182.98 | 1 892.57 | 125.58 | 7.24 | 25.21 | 2 872.68 | |
| P | 202.14 | 517.98 | 108.58 | 874.83 | 94.80 | 4.68 | 23.91 | 1 826.92 | |
| F | 409.70 | 704.81 | 120.10 | 7 151.98 | 290.04 | 9.81 | 80.21 | 8 766.65 | |
| U | 144.92 | 129.98 | 31.27 | 173.75 | 288.62 | 31.96 | 21.51 | 822.01 | |
| WA | 23.01 | 13.20 | 2.52 | 23.01 | 80.53 | 331.96 | 13.80 | 488.03 | |
| UL | 158.65 | 271.34 | 80.20 | 98.69 | 93.67 | 8.69 | 38.83 | 750.07 | |
| 小计 Total | 1 438.17 | 2 482.52 | 579.20 | 10 523.12 | 1 162.45 | 402.60 | 229.57 | 16 817.64 | |
| 变化 Change | 1 129.95 | 2 034.95 | 470.62 | 3 371.14 | 873.83 | 70.64 | 190.74 | - | |
| 下游 Lower reach | AL | 113.25 | 117.60 | 23.19 | 66.64 | 359.12 | 17.11 | 61.69 | 758.60 |
| G | 37.71 | 62.99 | 22.31 | 137.86 | 148.99 | 6.16 | 22.40 | 438.41 | |
| P | 35.23 | 76.30 | 24.06 | 61.98 | 86.89 | 4.69 | 18.90 | 308.05 | |
| F | 51.58 | 122.70 | 29.96 | 382.76 | 152.98 | 6.01 | 27.91 | 773.90 | |
| U | 13.07 | 8.97 | 3.70 | 9.86 | 143.56 | 7.49 | 7.77 | 194.41 | |
| WA | 2.02 | 1.82 | 0.98 | 4.08 | 24.40 | 34.91 | 1.56 | 69.76 | |
| UL | 9.13 | 16.68 | 5.21 | 6.99 | 25.98 | 1.21 | 5.08 | 70.29 | |
| 小计 Total | 261.98 | 407.06 | 109.4 | 670.17 | 941.91 | 77.58 | 145.31 | 2 613.42 | |
| 变化 Change | 148.73 | 344.08 | 85.34 | 287.41 | 798.36 | 42.67 | 140.23 | - | |
Table 3 Transition matrix of land use in the upper, middle and lower reaches in Dongjiang River watershed from 1989 to 2009 (unit: km2)
| AL | G | P | F | U | WA | UL | 小计 Total | ||
|---|---|---|---|---|---|---|---|---|---|
| 上游 Upper reach | AL | 207.49 | 134.02 | 17.21 | 168.75 | 58.08 | 4.20 | 17.40 | 607.16 |
| G | 294.10 | 125.57 | 15.47 | 998.51 | 104.85 | 4.59 | 13.61 | 1 556.69 | |
| P | 84.05 | 102.99 | 16.49 | 225.74 | 15.50 | 0.56 | 12.96 | 458.28 | |
| F | 372.89 | 135.66 | 29.84 | 3 072.97 | 238.97 | 9.25 | 31.75 | 3 891.33 | |
| U | 180.33 | 91.89 | 8.06 | 192.44 | 99.41 | 6.09 | 5.47 | 583.70 | |
| WA | 5.36 | 2.91 | 0.50 | 29.37 | 14.06 | 21.96 | 0.81 | 74.98 | |
| UL | 136.25 | 131.84 | 15.07 | 140.28 | 15.91 | 0.54 | 14.32 | 454.21 | |
| 小计 Total | 1 280.47 | 724.87 | 102.65 | 4 828.07 | 546.79 | 47.19 | 96.32 | 7 626.35 | |
| 变化 Change | 1 072.98 | 599.30 | 86.15 | 1 755.09 | 447.37 | 25.24 | 82.00 | - | |
| 中游 Middle reach | AL | 308.22 | 397.65 | 53.55 | 308.30 | 189.21 | 8.26 | 26.11 | 1 291.28 |
| G | 191.53 | 447.56 | 182.98 | 1 892.57 | 125.58 | 7.24 | 25.21 | 2 872.68 | |
| P | 202.14 | 517.98 | 108.58 | 874.83 | 94.80 | 4.68 | 23.91 | 1 826.92 | |
| F | 409.70 | 704.81 | 120.10 | 7 151.98 | 290.04 | 9.81 | 80.21 | 8 766.65 | |
| U | 144.92 | 129.98 | 31.27 | 173.75 | 288.62 | 31.96 | 21.51 | 822.01 | |
| WA | 23.01 | 13.20 | 2.52 | 23.01 | 80.53 | 331.96 | 13.80 | 488.03 | |
| UL | 158.65 | 271.34 | 80.20 | 98.69 | 93.67 | 8.69 | 38.83 | 750.07 | |
| 小计 Total | 1 438.17 | 2 482.52 | 579.20 | 10 523.12 | 1 162.45 | 402.60 | 229.57 | 16 817.64 | |
| 变化 Change | 1 129.95 | 2 034.95 | 470.62 | 3 371.14 | 873.83 | 70.64 | 190.74 | - | |
| 下游 Lower reach | AL | 113.25 | 117.60 | 23.19 | 66.64 | 359.12 | 17.11 | 61.69 | 758.60 |
| G | 37.71 | 62.99 | 22.31 | 137.86 | 148.99 | 6.16 | 22.40 | 438.41 | |
| P | 35.23 | 76.30 | 24.06 | 61.98 | 86.89 | 4.69 | 18.90 | 308.05 | |
| F | 51.58 | 122.70 | 29.96 | 382.76 | 152.98 | 6.01 | 27.91 | 773.90 | |
| U | 13.07 | 8.97 | 3.70 | 9.86 | 143.56 | 7.49 | 7.77 | 194.41 | |
| WA | 2.02 | 1.82 | 0.98 | 4.08 | 24.40 | 34.91 | 1.56 | 69.76 | |
| UL | 9.13 | 16.68 | 5.21 | 6.99 | 25.98 | 1.21 | 5.08 | 70.29 | |
| 小计 Total | 261.98 | 407.06 | 109.4 | 670.17 | 941.91 | 77.58 | 145.31 | 2 613.42 | |
| 变化 Change | 148.73 | 344.08 | 85.34 | 287.41 | 798.36 | 42.67 | 140.23 | - | |
| 区域 Region | 年份 Year | ec | EC | ec | EC | |||
|---|---|---|---|---|---|---|---|---|
| 变化量 Magnitude of change (hm2·person-1) | 变化率 Rate of change (%) | 变化量 Magnitude of change (hm2) | 变化率 Rate of change (%) | |||||
| 东江流域 Dongjiang River watershed | 1989 | 0.854 2 | 4 329 682 | - | ||||
| 1994 | 0.683 0 | 3 853 844 | -0.171 3 | -0.200 5 | -475 838 | -0.109 9 | ||
| 1999 | 0.622 0 | 3 871 333 | -0.061 0 | -0.089 3 | 17 489 | 0.004 5 | ||
| 2004 | 0.644 7 | 4 307 321 | 0.022 7 | 0.036 5 | 435 988 | 0.112 6 | ||
| 2009 | 0.593 4 | 4 539 629 | -0.051 2 | -0.079 5 | 232 309 | 0.053 9 | ||
| 上游 Upper reach | 1989 | 0.827 5 | 1 128 088 | - | ||||
| 1994 | 0.728 9 | 1 056 882 | -0.098 6 | -0.119 2 | -71 205 | -0.063 1 | ||
| 1999 | 0.724 2 | 1 119 064 | -0.004 6 | -0.006 4 | 62 181 | 0.058 8 | ||
| 2004 | 0.699 2 | 1 146 417 | -0.025 0 | -0.034 6 | 27 353 | 0.024 4 | ||
| 2009 | 0.792 8 | 1 365 117 | 0.093 6 | 0.133 9 | 218 700 | 0.190 8 | ||
| 中游 Middle reach | 1989 | 0.860 8 | 2 692 816 | - | ||||
| 1994 | 0.671 8 | 2 271 964 | -0.189 0 | -0.219 6 | -420 852 | -0.156 3 | ||
| 1999 | 0.598 0 | 2 178 598 | -0.073 8 | -0.109 8 | -93 366 | -0.041 1 | ||
| 2004 | 0.672 3 | 2 614 415 | 0.074 3 | 0.124 3 | 435 817 | 0.200 0 | ||
| 2009 | 0.579 8 | 2 601 633 | -0.092 4 | -0.137 5 | -12 782 | -0.004 9 | ||
| 下游 Lower reach | 1989 | 0.949 0 | 508 789 | - | ||||
| 1994 | 0.783 3 | 525 013 | -0.165 7 | -0.174 6 | 16 223 | 0.031 9 | ||
| 1999 | 0.715 7 | 573 722 | -0.067 7 | -0.086 4 | 48 709 | 0.092 8 | ||
| 2004 | 0.620 2 | 546 535 | -0.095 0 | -0.133 3 | -27 187 | -0.047 4 | ||
| 2009 | 0.508 5 | 572 860 | -0.111 8 | -0.180 1 | 26 325 | 0.048 2 | ||
Table 4 Changes in total and per capita eco-capacity in Dongjiang River watershed from 1989 to 2009 (unit: hm2)
| 区域 Region | 年份 Year | ec | EC | ec | EC | |||
|---|---|---|---|---|---|---|---|---|
| 变化量 Magnitude of change (hm2·person-1) | 变化率 Rate of change (%) | 变化量 Magnitude of change (hm2) | 变化率 Rate of change (%) | |||||
| 东江流域 Dongjiang River watershed | 1989 | 0.854 2 | 4 329 682 | - | ||||
| 1994 | 0.683 0 | 3 853 844 | -0.171 3 | -0.200 5 | -475 838 | -0.109 9 | ||
| 1999 | 0.622 0 | 3 871 333 | -0.061 0 | -0.089 3 | 17 489 | 0.004 5 | ||
| 2004 | 0.644 7 | 4 307 321 | 0.022 7 | 0.036 5 | 435 988 | 0.112 6 | ||
| 2009 | 0.593 4 | 4 539 629 | -0.051 2 | -0.079 5 | 232 309 | 0.053 9 | ||
| 上游 Upper reach | 1989 | 0.827 5 | 1 128 088 | - | ||||
| 1994 | 0.728 9 | 1 056 882 | -0.098 6 | -0.119 2 | -71 205 | -0.063 1 | ||
| 1999 | 0.724 2 | 1 119 064 | -0.004 6 | -0.006 4 | 62 181 | 0.058 8 | ||
| 2004 | 0.699 2 | 1 146 417 | -0.025 0 | -0.034 6 | 27 353 | 0.024 4 | ||
| 2009 | 0.792 8 | 1 365 117 | 0.093 6 | 0.133 9 | 218 700 | 0.190 8 | ||
| 中游 Middle reach | 1989 | 0.860 8 | 2 692 816 | - | ||||
| 1994 | 0.671 8 | 2 271 964 | -0.189 0 | -0.219 6 | -420 852 | -0.156 3 | ||
| 1999 | 0.598 0 | 2 178 598 | -0.073 8 | -0.109 8 | -93 366 | -0.041 1 | ||
| 2004 | 0.672 3 | 2 614 415 | 0.074 3 | 0.124 3 | 435 817 | 0.200 0 | ||
| 2009 | 0.579 8 | 2 601 633 | -0.092 4 | -0.137 5 | -12 782 | -0.004 9 | ||
| 下游 Lower reach | 1989 | 0.949 0 | 508 789 | - | ||||
| 1994 | 0.783 3 | 525 013 | -0.165 7 | -0.174 6 | 16 223 | 0.031 9 | ||
| 1999 | 0.715 7 | 573 722 | -0.067 7 | -0.086 4 | 48 709 | 0.092 8 | ||
| 2004 | 0.620 2 | 546 535 | -0.095 0 | -0.133 3 | -27 187 | -0.047 4 | ||
| 2009 | 0.508 5 | 572 860 | -0.111 8 | -0.180 1 | 26 325 | 0.048 2 | ||
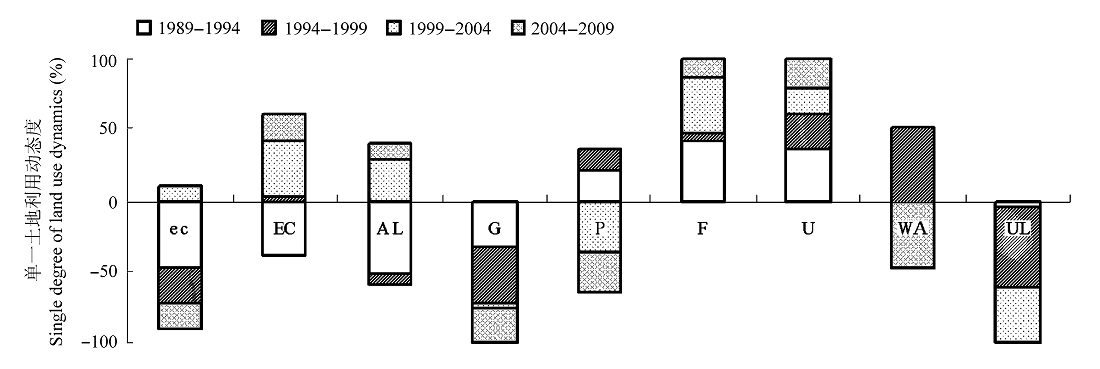
Fig. 4 Rate of change in land use types, per capita eco-capacity, and total eco-capacity in Dongjiang River watershed. AL, arable land; F, forest; G, garden; P, pasture; U, urban; UL, unused land; WA, water area.
| [1] | Cai HS, Zhu DH, Zhang XL, Zhao XM (2007). Dynamics analysis of the ecological capacity in Po-yang Lake Nature Reserve based on RS and GIS. Acta Ecologica Sinica, 27, 4751-4757. (in Chinese with English abstract) |
| [蔡海生, 朱德海, 张学玲, 赵小敏 (2007). 鄱阳湖自然保护区生态承载力. 生态学报, 27, 4751-4757.] | |
| [2] | Chen XH, Wang ZL (2010). Land use change and its impact on water resources in East River basin, South China. Journal of Beijing Normal University (Natural Science), 46, 311-316. (in Chinese with English abstract) |
| [陈晓宏, 王兆礼 (2010). 东江流域土地利用变化对水资源的影响. 北京师范大学学报(自然科学版), 46, 311-316.] | |
| [3] | Fang JY, Piao SL, He JS, Ma WH (2003). Enhancement of China vegetation in last 20 years. Science in China (Series C), 33, 554-565. (in Chinese) |
| [方精云, 朴世龙, 贺金生, 马文红 (2003). 近20年来中国植被活动在增强. 中国科学(C辑), 33, 554-565.] | |
| [4] | Liu YC, Huang TS (1988). Estimation of rigid body motion using straight line correspondences. Computer Vision, Graphics, and Image Processing, 43, 37-52. |
| [5] | Martinuzzi S, Gould WA, Ramos González OM (2007). Land development, land use, and urban sprawl in Puerto Rico integrating remote sensing and population census data. Landscape and Urban Planning, 79, 288-297. |
| [6] | Piao SL, Fang JY (2001). Dynamic vegetation cover change over the last 18 years in China. Quaternary Sciences, 21, 294-302. (in Chinese with English abstract) |
| [朴世龙, 方精云 (2001). 最近18年来中国植被覆盖的动态变化. 第四纪研究, 21, 294-302.] | |
| [7] | Ren FP, Jiang Y, Xiong X, Dong MY, Wang B (2011). Characteristics of the spatial-temporal differences of land use changes in the Dongjiang River Basin from 1990 to 2009. Resources Science, 33, 143-152. (in Chinese with English abstract) |
| [任斐鹏, 江源, 熊兴, 董满宇, 王博 (2011). 东江流域近20年土地利用变化的时空差异特征分析. 资源科学, 33, 143-152.] | |
| [8] |
Richards JA (1996). Classifier performance and map accuracy. Remote Sensing of Environment, 57, 161-166.
DOI URL |
| [9] | Song Y, Ma GM (2007). Study on vegetation cover change in northwest China based on SPOT VEGETATION data. Journal of Desert Research, 27, 89-93. (in Chinese with English abstract) |
| [宋怡, 马明国 (2007). 基于SPOT VEGETATION数据的中国西北植被覆盖变化分析. 中国沙漠, 27, 89-93.] | |
| [10] | Sun JH, Zhang J, Zhang J, Li YG, Meng J (2007). The study of changes of Beiyunhe valley’s vegetation cover. Journal of Capital Normal University (Natural Science Edition), 28(2), 93-97. (in Chinese with English abstract) |
| [孙久虎, 张晶, 张洁, 李佑钢, 孟健 (2007). 近20年来北运河地区植被覆盖时空变化研究. 首都师范大学学报 (自然科学版), 28(2), 93-97.] | |
| [11] | Tong C, Yang JR, Yong WY, Yong SP (2002). Spatial pattern of steppe degradation in Xilin River Basin of Inner Mongolia. Journal of Natural Resources, 17, 571-578. (in Chinese with English abstract) |
| [仝川, 杨景荣, 雍伟义, 雍世鹏 (2002). 锡林河流域草原植被退化空间格局分析. 自然资源学报, 17, 571-578.] | |
| [12] | Tong C, Yong WY, Wu YN, Zhao LQ, Jiang C, Yong SP (2001). Change in the spatial structure of grassland vegetation in the Xilin River Basin from 1985 to 1999. Acta Scientiarum Naturalium Universitatis Neimongol, 32, 562-566. (in Chinese with English abstract) |
| [仝川, 雍伟义, 乌云娜, 赵利清, 姜超, 雍世鹏 (2001). 锡林河流域近15年植被空间结构变化遥感分析. 内蒙古大学学报 (自然科学版), 32, 562-566.] | |
| [13] | Wang N, Liu P, Huang XH (2004). Research progress in ecological carrying capicity. Chinese Agricultural Science Bulletin, 20(6), 278-281. (in Chinese with English abstract) |
| [王宁, 刘平, 黄锡欢 (2004). 生态承载力研究进展. 中国农学通报, 20(6), 278-281. ] | |
| [14] | Wang SY, Liu JY, Zhang ZX, Zhou QB, Zhao XL (2001). Analysis on spatial-temporal features of land use in China. Acta Geographica Sinica, 56, 631-639. (in Chinese with English abstract) |
| [王思远, 刘纪远, 张增祥, 周全斌, 赵晓丽 (2001). 中国土地利用时空特征分析. 地理学报, 56, 631-639.] | |
| [15] | Wang ZL, Chen XH, Li Y (2006). Spatial-temporal changes of NDVI in the pearl River Basin. Ecologic Science, 25, 303-307, 311. (in Chinese with English abstract) |
| [王兆礼, 陈晓宏, 李艳 (2006). 珠江流域植被覆盖时空变化分析. 生态科学, 25, 303-307, 311.] | |
| [16] | World Wide Fund for Nature (2004). “Living Planet Report 2004”. Gland, Switzerland. http://wwf.panda.org/about_our_earth/all_publications/living_planet_report/living_planet_report_timeline/lpr04/. Cited: 2013-11-15. |
| [17] | Xu ZM, Chen DJ, Zhang ZQ, Cheng GD (2002). Calculation and analysis on ecological footprints of China. Acta Pedologica Sinica, 39, 441-445. (in Chinese with English abstract) |
| [徐中民, 陈东景, 张志强, 程国栋 (2002). 中国1999年的生态足迹分析. 土壤学报, 39, 441-445.] | |
| [18] | Yang ST, Liu CM, Sun R (2002). The vegetation cover over last 20 years in Yellow River Basin. Acta Geographica Sinica, 57, 679-684. (in Chinese with English abstract) |
| [杨胜天, 刘昌明, 孙睿 (2002). 近20年来黄河流域植被覆盖变化分析. 地理学报, 57, 679-684.] | |
| [19] | Yue DX, Du J, Liu JY, Guo JJ, Zhang JJ, Ma JH (2011). Spatio-temporal analysis of ecological carrying capacity in Jinghe Watershed based on Remote Sensing and Transfer Matrix. Acta Ecologica Sinica, 31, 2550-2558. (in Chinese with English abstract) |
| [岳东霞, 杜军, 刘俊艳, 郭建军, 张佳静, 马金辉 (2011). 基于RS和转移矩阵的泾河流域生态承载力时空动态评价. 生态学报, 31, 2550-2558.] | |
| [20] | Yue DX, Xu XF, Li ZZ, Hui C, Li WL, Yang HQ, Ge JP (2006). Spatiotemporal analysis of ecological footprint and biological capacity of Gansu, China 1991-2015: down from the environmental cliff. Ecological Economics, 58, 393-406. |
| [21] | Zhao S, Li ZZ, Li WL (2005). A modified method of ecological footprint calculation and its application. Ecological Modelling, 185, 65-75. |
| [22] | Zhao XG, Wei LH, Ma CH, Wang J (2007). Dynamics of ecological footprint and ecological safety in Xi’an. Journal of Arid Land Resources and Environment, 21, 1-5. (in Chinese with English abstract) |
| [赵先贵, 韦良焕, 马彩虹, 王婧 (2007). 西安市生态足迹与生态安全的动态研究. 干旱区资源与环境, 21, 1-5.] | |
| [23] | Zhu HY, Li XB (2003). Discussion on the index method of regional land use change. Acta Geographica Sinica, 58, 643-650. (in Chinese with English abstract) |
| [朱会义, 李秀彬 (2003). 关于区域土地利用变化指数模型方法的讨论. 地理学报, 58, 643-650.] |
| [1] | ZHANG Hong-Jin, WANG Wei. Responses of ecosystem multifunctionality to global change: progress, problem and prospect [J]. Chin J Plant Ecol, 2021, 45(10): 1112-1126. |
| [2] | NIU Shu-Li, CHEN Wei-Nan. Global change and ecosystems research progress and prospect [J]. Chin J Plant Ecol, 2020, 44(5): 449-460. |
| [3] | Edith BAI, XUE Bing. A review of influences of land use and land cover change on ecosystems [J]. Chin J Plant Ecol, 2020, 44(5): 543-552. |
| [4] | Chao LI, Shu-Qing ZHAO, Jing-Yun FANG. Vegetation cover change and driving factors in Fujian Province between 1975 and 2014 [J]. Chin J Plan Ecolo, 2017, 41(2): 157-164. |
| [5] | Hua JU, Guo-Zhen SHEN, Ming-Zhe MA, Jie-Lin GE, Wen-Ting XU, Chang-Ming ZHAO, Qiu- Liang ZHANG. Greenhouse gas fluxes of typical northern subtropical forest soils: Impacts of land use change and reduced precipitation [J]. Chin J Plant Ecol, 2016, 40(10): 1049-1063. |
| [6] | MOSELEY Robert K, TANG Ya. VEGETATION DYNAMICS IN THE DRY VALLEYS OF YUNNAN, CHINA, DURING THE LAST 150 YEARS: IMPLICATIONS FOR ECOLOGICAL RESTORATION [J]. Chin J Plant Ecol, 2006, 30(5): 713-722. |
| [7] | WU Jian-Guo, XU De-Ying. DISSOLVED ORGANIC CARBON CONCENTRATIONS IN SOIL UNDER DIFFERENT LAND USES IN THE LIUPAN MOUNTAIN FOREST ZONE [J]. Chin J Plant Ecol, 2005, 29(6): 945-953. |
| [8] | YANG Jing-Cheng, HUANG Jian-Hui, TANG Jian-Wei, PAN Qing-Min, HAN Xing-Guo. CARBON SEQUESTRATION IN RUBBER TREE PLANTATIONS ESTABLISHED ON FORMER ARABLE LANDS IN XISHUANGBANNA, SW CHINA [J]. Chin J Plant Ecol, 2005, 29(2): 296-303. |
| [9] | WU Jian-Guo, ZHANG Xiao-Quan, XU De-Ying. CHANGES IN SOIL LABILE ORGANIC CARBON UNDER DIFFERENT LAND USE IN THE LIUPAN MOUNTAIN FOREST ZONE [J]. Chin J Plan Ecolo, 2004, 28(5): 657-664. |
| [10] | YANG Jing-Cheng, HUANG Jian-Hui, PAN Qing-Min, HAN Xing-Guo. SPECTROSCOPIC CHARACTERISTICS OF SOIL ORGANIC MATTER IN DIFFERENT [J]. Chin J Plan Ecolo, 2004, 28(5): 623-629. |
| [11] | WU Jian-Guo, ZHANG Xiao-Quan, XU De-Ying. THE MINERALIZATION OF SOIL ORGANIC CARBON UNDER DIFFERENT LAND USES IN THE LIUPAN MOUNTAIN FOREST ZONE [J]. Chin J Plan Ecolo, 2004, 28(4): 530-538. |
| Viewed | ||||||
|
Full text |
|
|||||
|
Abstract |
|
|||||
Copyright © 2022 Chinese Journal of Plant Ecology
Tel: 010-62836134, 62836138, E-mail: apes@ibcas.ac.cn, cjpe@ibcas.ac.cn