
Chin J Plant Ecol ›› 2020, Vol. 44 ›› Issue (6): 598-615.DOI: 10.17521/cjpe.2019.0347
Special Issue: 遥感生态学
• Research Articles • Previous Articles Next Articles
YI Hai-Yan1,2, ZENG Yuan1,2,*( ), ZHAO Yu-Jin3, ZHENG Zhao-Ju1, XIONG Jie1,2, ZHAO Dan1
Received:2019-12-12
Accepted:2020-02-07
Online:2020-06-20
Published:2020-03-26
Contact:
ZENG Yuan
Supported by:YI Hai-Yan, ZENG Yuan, ZHAO Yu-Jin, ZHENG Zhao-Ju, XIONG Jie, ZHAO Dan. Forest species diversity mapping based on clustering algorithm[J]. Chin J Plant Ecol, 2020, 44(6): 598-615.
Add to citation manager EndNote|Ris|BibTeX
URL: https://www.plant-ecology.com/EN/10.17521/cjpe.2019.0347
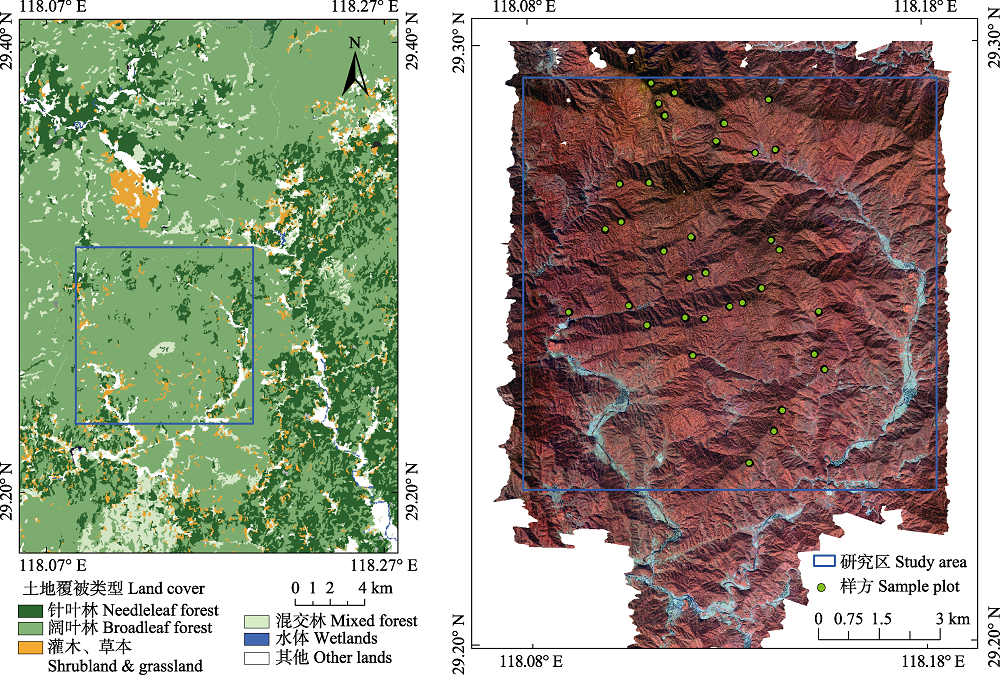
Fig. 1 Land cover and locations of forest field measured sample plots in Gutianshan study area.
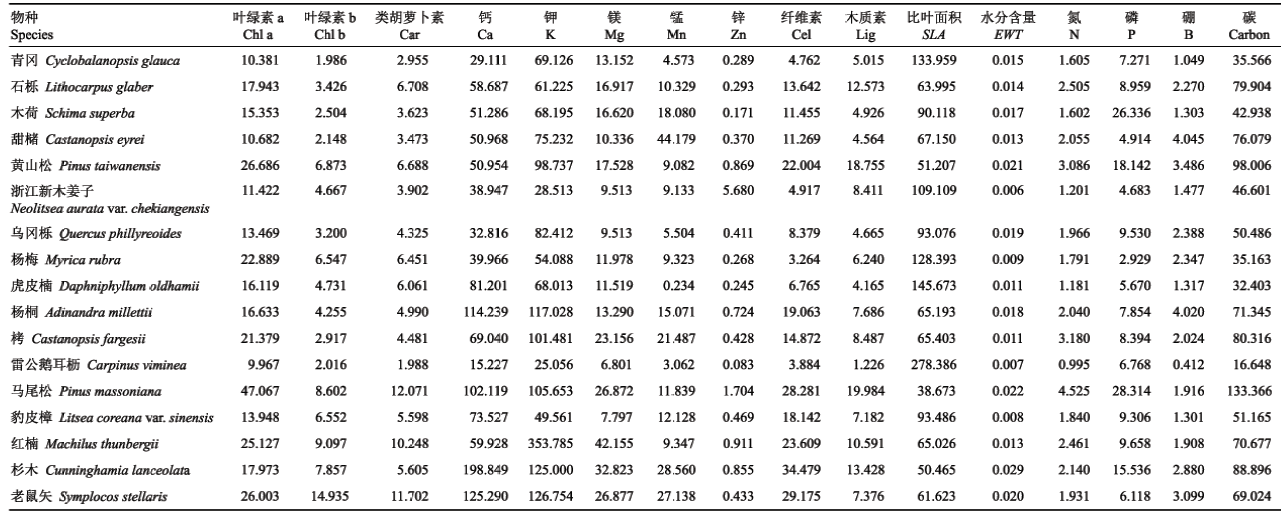 |
Table 1 Leaf biochemical values of dominant species
| |
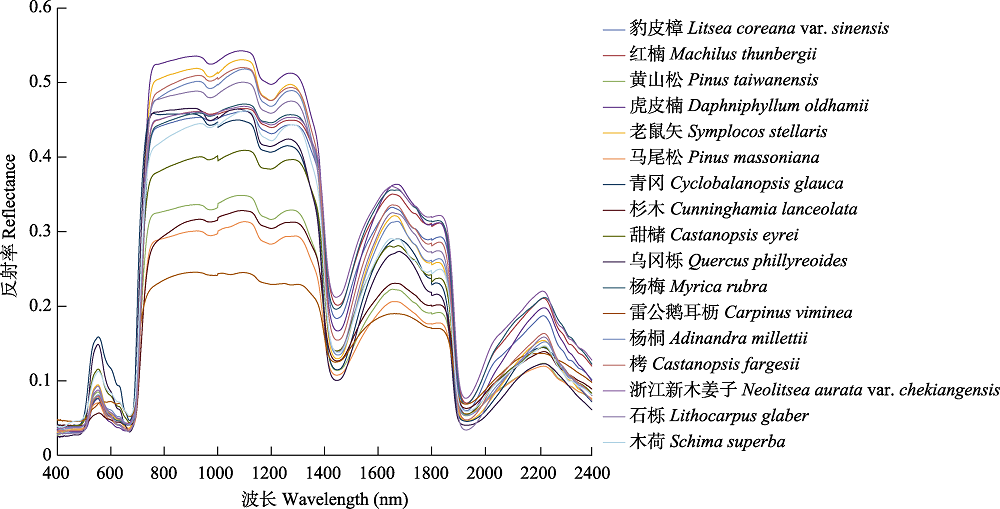
Fig. 2 Spectral signatures of 17 dominant tree species in Gutianshan study area.
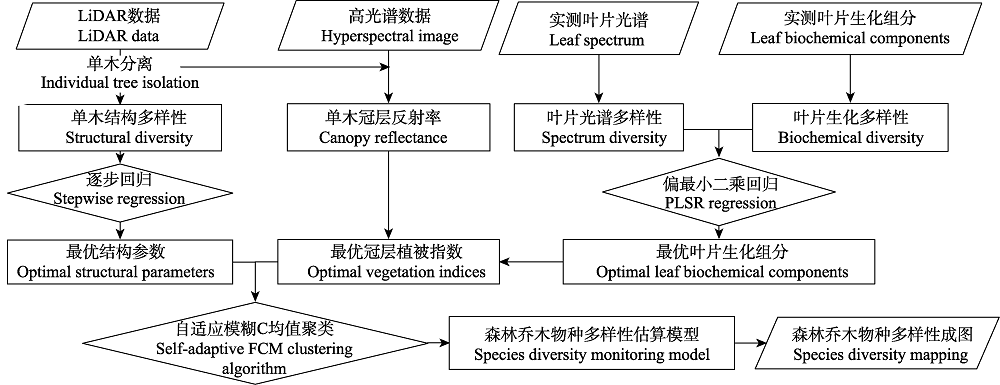
Fig. 3 Technique flow chart of forest species diversity mapping in Gutianshan study area.
| 结构参数 Structural parameter | 描述 Description | 引用 Reference |
|---|---|---|
| 95%分位数高度 95% quantile height | 近似于森林冠层峰值高度, 由首次回波统计获得 Approximates the peak height in meters of the forest canopy, obtained from the point cloud of the first echo | |
| 平均植被高度 Mean vegetation height | 植被的平均高度, 由各植被分层首次回波和末次回波统计获得 The mean height of vegetation, obtained from the point cloud of the first and last echo of each vegetation layer | |
| 植被穿透率 Vegetation permeability | 植被首次回波在二次回波中的比例, 由植被的首次回波和所有二次回波计算得到 Proportion of first vegetation returns (see above) for which there is a second return, obtained from the point cloud of the first echo and all secondary echoes of vegetation | |
| 叶高度多样性 Foliage height diversity | 描述植被剖面的叶密度和高度分布, 公式: $h=-\mathop{\sum }^{}{{p}_{i}}\ln {{p}_{i}}$, 其中, pi表示不同高度间隔内的点云返回值与所有返回值的比例, h表示树高 Metric intended to characterize the density and height distribution of foliage in a vegetation profile. Formula: $h=-\mathop{\sum }^{}{{p}_{i}}\ln {{p}_{i}}$, where pi is the ratio of return value of point cloud in different height intervals to all return values, h is the tree height | |
| 标准偏差(首次回波) Standard deviation (first return) | 反映单木树高的离散程度 Metric the dispersion of each individual tree | |
| 平均绝对偏差 Mean absolute deviation | 所有单木树高值与其算术平均值的偏差的绝对值的平均 Mean of absolute value of the deviation of tree height from the mean | |
| 偏度(首次回波) Skewness (first return) | 与峰态(首次回波)高度相关 Highly correlated with kurtosis |
Table 2 Canopy structural parameters derived from LiDAR
| 结构参数 Structural parameter | 描述 Description | 引用 Reference |
|---|---|---|
| 95%分位数高度 95% quantile height | 近似于森林冠层峰值高度, 由首次回波统计获得 Approximates the peak height in meters of the forest canopy, obtained from the point cloud of the first echo | |
| 平均植被高度 Mean vegetation height | 植被的平均高度, 由各植被分层首次回波和末次回波统计获得 The mean height of vegetation, obtained from the point cloud of the first and last echo of each vegetation layer | |
| 植被穿透率 Vegetation permeability | 植被首次回波在二次回波中的比例, 由植被的首次回波和所有二次回波计算得到 Proportion of first vegetation returns (see above) for which there is a second return, obtained from the point cloud of the first echo and all secondary echoes of vegetation | |
| 叶高度多样性 Foliage height diversity | 描述植被剖面的叶密度和高度分布, 公式: $h=-\mathop{\sum }^{}{{p}_{i}}\ln {{p}_{i}}$, 其中, pi表示不同高度间隔内的点云返回值与所有返回值的比例, h表示树高 Metric intended to characterize the density and height distribution of foliage in a vegetation profile. Formula: $h=-\mathop{\sum }^{}{{p}_{i}}\ln {{p}_{i}}$, where pi is the ratio of return value of point cloud in different height intervals to all return values, h is the tree height | |
| 标准偏差(首次回波) Standard deviation (first return) | 反映单木树高的离散程度 Metric the dispersion of each individual tree | |
| 平均绝对偏差 Mean absolute deviation | 所有单木树高值与其算术平均值的偏差的绝对值的平均 Mean of absolute value of the deviation of tree height from the mean | |
| 偏度(首次回波) Skewness (first return) | 与峰态(首次回波)高度相关 Highly correlated with kurtosis |
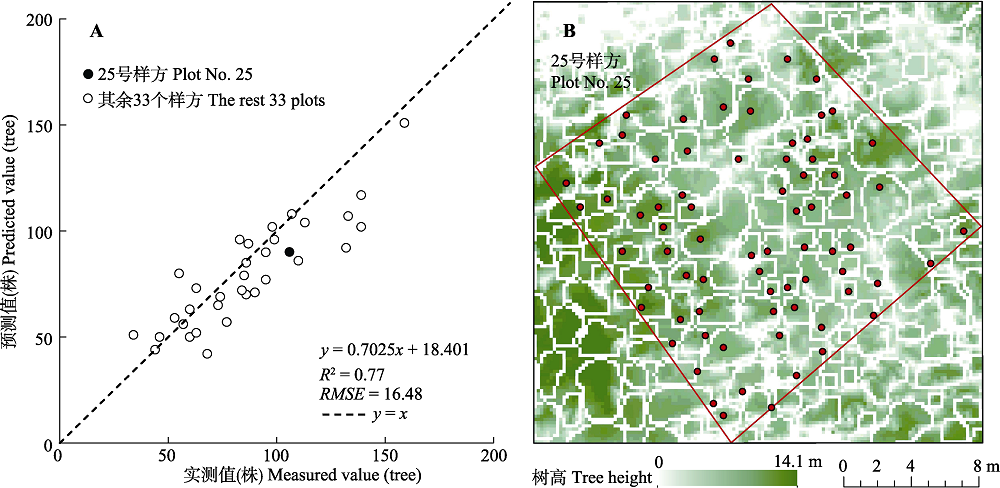
Fig. 4 Validation result of individual tree isolation (A) and individual tree isolation result of plot No. 25 (B) in Gutianshan study area. The red polygon represents plot border, the white polygons represent canopy locations, and the red dots represent field-measured positions of the base of tree trunk.
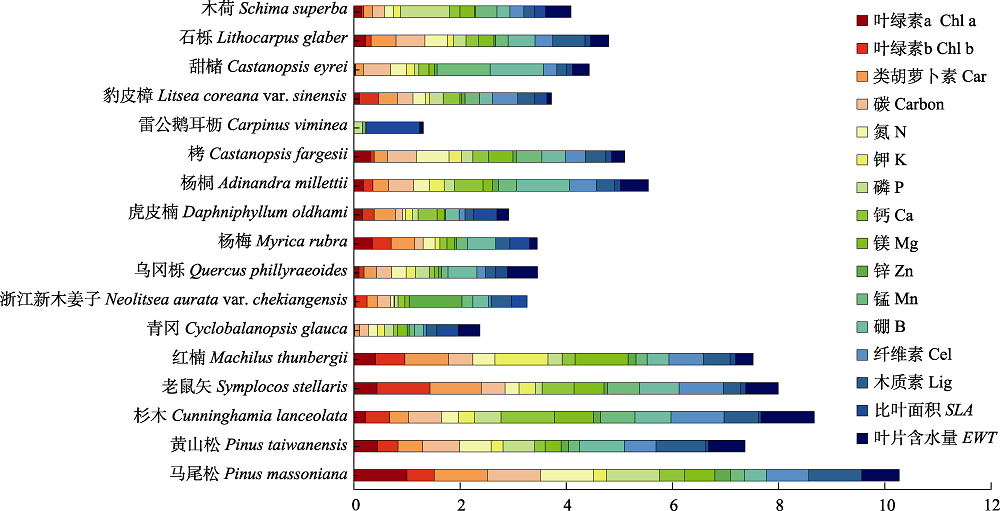
Fig. 5 16 standardized biochemical components of 17 dominant tree species in Gutianshan study area. Car, carotenoids; Cel, cellulose; Chl a, chlorophyll a; Chl b, chlorophyll b; Lig, lignin; SLA, specific leaf area; EWT, equivalent water thickness.
| 生化组分 Biochemical component | 叶绿素a Chl a | 叶绿素b Chl b | 类胡萝卜素 Car | 比叶面积 SLA | 水分含量 EWT | 纤维素 Cel | 木质素 Lig | 碳 Carbon | 氮 N | 磷 P | 钙 Ca | 钾 K | 镁 Mg | 锰 Mn | 锌 Zn | 硼 B |
|---|---|---|---|---|---|---|---|---|---|---|---|---|---|---|---|---|
| R2 | 0.70 | 0.60 | 0.69 | 0.79 | 0.67 | 0.66 | 0.76 | 0.72 | 0.63 | 0.63 | 0.51 | 0.23 | 0.48 | 0.10 | 0.09 | 0.21 |
Table 3 Validation result of leaf biochemical components
| 生化组分 Biochemical component | 叶绿素a Chl a | 叶绿素b Chl b | 类胡萝卜素 Car | 比叶面积 SLA | 水分含量 EWT | 纤维素 Cel | 木质素 Lig | 碳 Carbon | 氮 N | 磷 P | 钙 Ca | 钾 K | 镁 Mg | 锰 Mn | 锌 Zn | 硼 B |
|---|---|---|---|---|---|---|---|---|---|---|---|---|---|---|---|---|
| R2 | 0.70 | 0.60 | 0.69 | 0.79 | 0.67 | 0.66 | 0.76 | 0.72 | 0.63 | 0.63 | 0.51 | 0.23 | 0.48 | 0.10 | 0.09 | 0.21 |
| 生化组分 Biochemical component | 植被指数 Vegetation index | 计算公式 Formula | 引用 Reference |
|---|---|---|---|
| 叶绿素a/b Chl a/b | TCARI/OSAVI | TCARI/OSAVI [705,750] = 3[(R750.66 - R704.6) - 0.2(R750.66 - R550.67)(R750.66/R704.6)]/[(1 + 0.16)(R750.66 - R704.6)/(R750.66 + R704.6 + 0.16)] | |
| 类胡萝卜素 Car | CRI | CRI = 1/R510 - 1/R550 | |
| 水分 EWT | WBI | WBI = R895/R972 | |
| 氮/磷 N/P | CCCI | CCCI = (0.7415R790 - 0.6965R720)/(0.0319R790 - 0.281R720) | |
| 比叶面积 SLA | RVI | RVI = R750/R705 | |
| 纤维素/木质素 Cel/Lig | PRI | PRI = (R531 - R570)/(R531 + R570) |
Table 4 Vegetation indices corresponding to the optimal biochemical components
| 生化组分 Biochemical component | 植被指数 Vegetation index | 计算公式 Formula | 引用 Reference |
|---|---|---|---|
| 叶绿素a/b Chl a/b | TCARI/OSAVI | TCARI/OSAVI [705,750] = 3[(R750.66 - R704.6) - 0.2(R750.66 - R550.67)(R750.66/R704.6)]/[(1 + 0.16)(R750.66 - R704.6)/(R750.66 + R704.6 + 0.16)] | |
| 类胡萝卜素 Car | CRI | CRI = 1/R510 - 1/R550 | |
| 水分 EWT | WBI | WBI = R895/R972 | |
| 氮/磷 N/P | CCCI | CCCI = (0.7415R790 - 0.6965R720)/(0.0319R790 - 0.281R720) | |
| 比叶面积 SLA | RVI | RVI = R750/R705 | |
| 纤维素/木质素 Cel/Lig | PRI | PRI = (R531 - R570)/(R531 + R570) |
| 结构多样性参数 Structural parameter | Simpson 指数 Simpson index | Shannon- Wiener 指数 Shannon- Wiener index | 物种丰富度 Species richness | ||||||||
|---|---|---|---|---|---|---|---|---|---|---|---|
| 95%分位 数高度 95% Quantile height | 平均植 被高度 Mean vegetation height | 平均绝对偏差 Mean absolute deviation | 标准偏差 Standard deviation | 偏度 Skewness | 叶高度 多样性 Foliage height diversity | 植被 穿透率 Vegetation permeability | |||||
| 垂直结构 Vertical structure | 95%分位数高度 | 1.000 | 0.884** | 0.757** | 0.811** | -0.320 | -0.233 | 0.233 | 0.455** | 0.320 | 0.088 |
| 平均植被高度 | 0.884** | 1.000 | 0.428* | 0.511** | -0.578** | 0.171 | 0.318 | -0.352* | -0.187 | 0.012 | |
| 平均绝对偏差 | 0.757** | 0.428* | 1.000 | 0.988** | -0.055 | -0.763** | 0.134 | -0.314 | -0.236 | 0.002 | |
| 标准偏差 | 0.811** | 0.511** | 0.988** | 1.000 | -0.167 | -0.700** | 0.214 | -0.328 | -0.244 | 0.010 | |
| 内部结构 Inner structure | 偏度 | -0.320 | -0.578** | -0.055 | -0.167 | 1.000 | -0.281 | -0.546** | -0.171 | -0.225 | 0.152 |
| 叶高度多样性 | -0.233 | 0.171 | -0.763** | -0.700** | -0.281 | 1.000 | 0.227 | 0.020 | 0.020 | 0.123 | |
| 植被穿透率 | 0.233 | 0.318 | 0.134 | 0.214 | -0.546** | 0.227 | 1.000 | -0.095 | -0.075 | 0.149 | |
Table 5 Correlation analysis of LiDAR-derived structural parameters
| 结构多样性参数 Structural parameter | Simpson 指数 Simpson index | Shannon- Wiener 指数 Shannon- Wiener index | 物种丰富度 Species richness | ||||||||
|---|---|---|---|---|---|---|---|---|---|---|---|
| 95%分位 数高度 95% Quantile height | 平均植 被高度 Mean vegetation height | 平均绝对偏差 Mean absolute deviation | 标准偏差 Standard deviation | 偏度 Skewness | 叶高度 多样性 Foliage height diversity | 植被 穿透率 Vegetation permeability | |||||
| 垂直结构 Vertical structure | 95%分位数高度 | 1.000 | 0.884** | 0.757** | 0.811** | -0.320 | -0.233 | 0.233 | 0.455** | 0.320 | 0.088 |
| 平均植被高度 | 0.884** | 1.000 | 0.428* | 0.511** | -0.578** | 0.171 | 0.318 | -0.352* | -0.187 | 0.012 | |
| 平均绝对偏差 | 0.757** | 0.428* | 1.000 | 0.988** | -0.055 | -0.763** | 0.134 | -0.314 | -0.236 | 0.002 | |
| 标准偏差 | 0.811** | 0.511** | 0.988** | 1.000 | -0.167 | -0.700** | 0.214 | -0.328 | -0.244 | 0.010 | |
| 内部结构 Inner structure | 偏度 | -0.320 | -0.578** | -0.055 | -0.167 | 1.000 | -0.281 | -0.546** | -0.171 | -0.225 | 0.152 |
| 叶高度多样性 | -0.233 | 0.171 | -0.763** | -0.700** | -0.281 | 1.000 | 0.227 | 0.020 | 0.020 | 0.123 | |
| 植被穿透率 | 0.233 | 0.318 | 0.134 | 0.214 | -0.546** | 0.227 | 1.000 | -0.095 | -0.075 | 0.149 | |
| 单木样方 Individual tree plot | 1 | 2 | 3 | 4 | 5 | 6 |
|---|---|---|---|---|---|---|
| R2 | 0.784 | 0.836 | 0.741 | 0.774 | 0.715 | 0.785 |
| RMSE | 1.196 | 0.894 | 0.684 | 1.083 | 1.323 | 1.132 |
Table 6 Validation result of LiDAR-derived individual tree height
| 单木样方 Individual tree plot | 1 | 2 | 3 | 4 | 5 | 6 |
|---|---|---|---|---|---|---|
| R2 | 0.784 | 0.836 | 0.741 | 0.774 | 0.715 | 0.785 |
| RMSE | 1.196 | 0.894 | 0.684 | 1.083 | 1.323 | 1.132 |
| 样方号 Plot No. | 实测物种丰富度 Measured species richness | 实测物种 丰富度* Measured species richness* | 实测物种 丰富度** Measured species richness** | 聚类数 (预测值) Prediction | 样方号 Plot No. | 实测物种丰富度 Measured species richness | 实测物种 丰富度* Measured species richness* | 实测物种 丰富度** Measured species richness** | 聚类数 (预测值) Prediction |
|---|---|---|---|---|---|---|---|---|---|
| 1 | 14 | 9 | 8 | 10 | 18 | 13 | 7 | 6 | 8 |
| 2 | 10 | 6 | 5 | 8 | 19 | 19 | 10 | 6 | 9 |
| 3 | 17 | 9 | 9 | 8 | 20 | 17 | 11 | 8 | 8 |
| 4 | 9 | 6 | 5 | 7 | 21 | 16 | 10 | 6 | 8 |
| 5 | 11 | 9 | 7 | 8 | 22 | 16 | 10 | 9 | 7 |
| 6 | 20 | 14 | 11 | 13 | 23 | 8 | 5 | 5 | 5 |
| 7 | 19 | 14 | 10 | 11 | 24 | 9 | 8 | 5 | 5 |
| 8 | 11 | 6 | 5 | 8 | 25 | 13 | 6 | 3 | 6 |
| 9 | 6 | 4 | 3 | 6 | 26 | 13 | 9 | 7 | 7 |
| 10 | 14 | 8 | 5 | 7 | 27 | 14 | 6 | 4 | 5 |
| 11 | 18 | 9 | 6 | 6 | 28 | 7 | 5 | 5 | 7 |
| 12 | 10 | 7 | 6 | 9 | 29 | 16 | 8 | 5 | 7 |
| 13 | 16 | 7 | 5 | 5 | 30 | 20 | 12 | 8 | 8 |
| 14 | 16 | 10 | 8 | 8 | 31 | 15 | 7 | 6 | 8 |
| 15 | 20 | 12 | 8 | 9 | 32 | 16 | 8 | 7 | 9 |
| 16 | 18 | 14 | 8 | 8 | 33 | 15 | 8 | 3 | 5 |
| 17 | 16 | 8 | 5 | 6 | 34 | 17 | 13 | 9 | 8 |
| R2 | 0.29 | 0.37 | 0.56 | RMSE | 7.75 | 2.41 | 1.82 |
Table 7 Prediction and validation for species richness in Gutianshan study area
| 样方号 Plot No. | 实测物种丰富度 Measured species richness | 实测物种 丰富度* Measured species richness* | 实测物种 丰富度** Measured species richness** | 聚类数 (预测值) Prediction | 样方号 Plot No. | 实测物种丰富度 Measured species richness | 实测物种 丰富度* Measured species richness* | 实测物种 丰富度** Measured species richness** | 聚类数 (预测值) Prediction |
|---|---|---|---|---|---|---|---|---|---|
| 1 | 14 | 9 | 8 | 10 | 18 | 13 | 7 | 6 | 8 |
| 2 | 10 | 6 | 5 | 8 | 19 | 19 | 10 | 6 | 9 |
| 3 | 17 | 9 | 9 | 8 | 20 | 17 | 11 | 8 | 8 |
| 4 | 9 | 6 | 5 | 7 | 21 | 16 | 10 | 6 | 8 |
| 5 | 11 | 9 | 7 | 8 | 22 | 16 | 10 | 9 | 7 |
| 6 | 20 | 14 | 11 | 13 | 23 | 8 | 5 | 5 | 5 |
| 7 | 19 | 14 | 10 | 11 | 24 | 9 | 8 | 5 | 5 |
| 8 | 11 | 6 | 5 | 8 | 25 | 13 | 6 | 3 | 6 |
| 9 | 6 | 4 | 3 | 6 | 26 | 13 | 9 | 7 | 7 |
| 10 | 14 | 8 | 5 | 7 | 27 | 14 | 6 | 4 | 5 |
| 11 | 18 | 9 | 6 | 6 | 28 | 7 | 5 | 5 | 7 |
| 12 | 10 | 7 | 6 | 9 | 29 | 16 | 8 | 5 | 7 |
| 13 | 16 | 7 | 5 | 5 | 30 | 20 | 12 | 8 | 8 |
| 14 | 16 | 10 | 8 | 8 | 31 | 15 | 7 | 6 | 8 |
| 15 | 20 | 12 | 8 | 9 | 32 | 16 | 8 | 7 | 9 |
| 16 | 18 | 14 | 8 | 8 | 33 | 15 | 8 | 3 | 5 |
| 17 | 16 | 8 | 5 | 6 | 34 | 17 | 13 | 9 | 8 |
| R2 | 0.29 | 0.37 | 0.56 | RMSE | 7.75 | 2.41 | 1.82 |
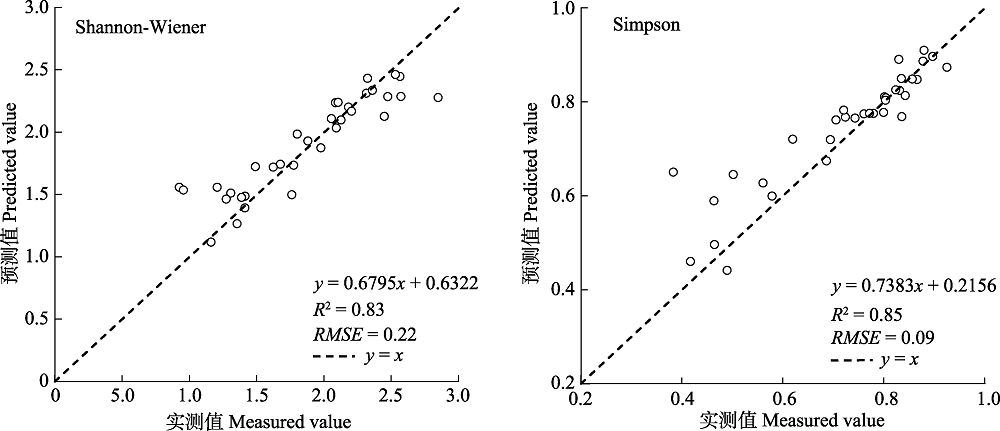
Fig. 6 Validation result of Shannon-Wiener index and Simpson index in Gutianshan study area.
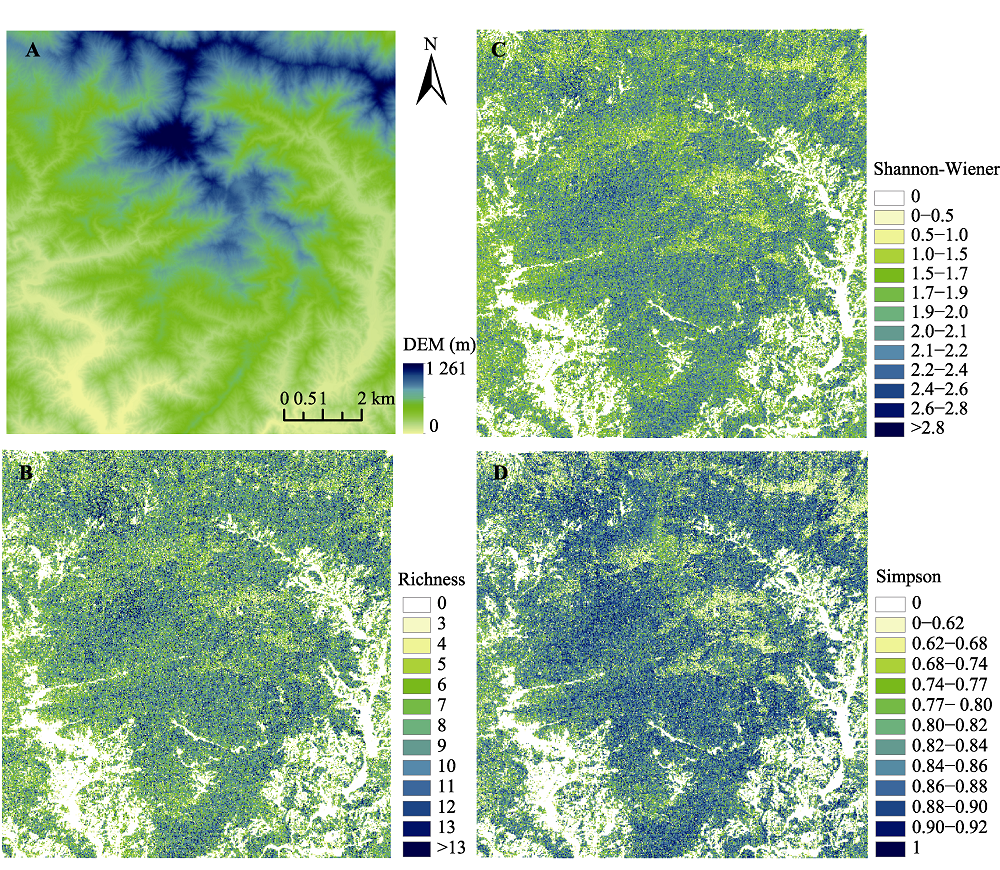
Fig. 7 Digital Elevation Model (DEM)(A), species richness (B), Shannon-Wiener index (C) and Simpson index (D) mapping in Gutianshan study area.
| [1] | Antonarakis AS, Richards KS, Brasington J (2008). Object- based land cover classification using airborne LiDAR. Remote Sensing of Environment, 112, 2988-2998. |
| [2] | Apostol B, Petrila M, Lorent A, Ciceu A, Gancz V, Badea O (2020). Species discrimination and individual tree detection for predicting main dendrometric characteristics in mixed temperate forests by use of airborne laser scanning and ultra-high-resolution imagery. Science of the Total Environment, 698, 134074. DOI: 10.1016/j.scitotenv.2019.134074. |
| [3] | Asner GP, Martin RE (2008). Spectral and chemical analysis of tropical forests: scaling from leaf to canopy levels. Remote Sensing of Environment, 112, 3958-3970. |
| [4] | Asner GP, Martin RE (2009). Airborne spectranomics: mapping canopy chemical and taxonomic diversity in tropical forests. Frontiers in Ecology and the Environment, 7, 269-276. |
| [5] |
Asner GP, Martin RE, Ford AJ, Metcalfe DJ, Liddell MJ (2009). Leaf chemical and spectral diversity in Australian tropical forests. Ecological Applications, 19, 236-253.
DOI URL PMID |
| [6] | Carlson KM, Asner GP, Hughes RF, Ostertag R, Martin RE (2007). Hyperspectral remote sensing of canopy biodiversity in Hawaiian lowland rainforests. Ecosystems, 10, 536-549. |
| [7] | Chen B, Mi XC, Fang T, Chen L, Ren HB, Ma KP (2017). Gutianshan Forest Dynamic Plot Tree Species and Their Distribution Patterns. China Forestry Publishing House, Beijing. |
| [ 陈彬, 米湘成, 方腾, 陈磊, 任海保, 马克平 (2017). 浙江古田山森林——树种及其分布格局. 中国林业出版社, 北京.] | |
| [8] | Clawges RM, Vierling KT, Vierling LA, Rowell E (2008). The use of airborne lidar to assess avian species diversity, density, and occurrence in a pine/aspen forest. Remote Sensing of Environment, 112, 2064-2073. |
| [9] | Coops NC, Tompaski P, Nijland W, Rickbeil GJM, Nielsen SE, Bater CW, John Stadt J (2016). A forest structure habitat index based on airborne laser scanning data. Ecological Indicators, 67, 346-357. |
| [10] | Daughtry CST, Walthall CL, Kim MS, de Colstoun EB, McMurtrey JE (2000). Estimating corn leaf chlorophyll concentration from leaf and canopy reflectance. Remote Sensing of Environment, 74, 229-239. |
| [11] |
Díaz S, Fargione J, Chapin FS, Tilman D (2006). Biodiversity loss threatens human well-being. PLOS Biology, 4, e277. DOI: 101371/journal.pbio.004027.
DOI URL PMID |
| [12] | Dong WX, Zeng Y, Zhao YJ, Zhao D, Zheng ZJ, Yi HY (2018). Forest species diversity mapping using airborne LiDAR and hyperspectral data. Journal of Remote Sensing, 22, 833-847. |
| [ 董文雪, 曾源, 赵玉金, 赵旦, 郑朝菊, 衣海燕 (2018). 机载激光雷达及高光谱的森林乔木物种多样性遥感监测. 遥感学报, 22, 833-847.] | |
| [13] | Duro DC, Coops NC, Wulder MA, Han T (2007). Development of a large area biodiversity monitoring system driven by remote sensing. Progress in Physical Geography, 31, 235-260. |
| [14] | El-Shikha DM, Waller PM, Hunsaker DJ, Clarke TR, Barnes E M (2007). Ground-based remote sensing for assessing water and nitrogen status of broccoli. Agricultural Water Management, 92, 183-193. |
| [15] |
Gamon JA, Penuelas J, Field CB (1992). A narrow-waveband spectral index that tracks diurnal changes in photosynthetic efficiency. Remote Sensing of Environment, 41, 35-44.
DOI URL |
| [16] |
Gitelson AA, Zur Y, Chivkunova OB, Merzlyak MN (2002). Assessing carotenoid content in plant leaves with reflectance spectroscopy. Photochemistry and Photobiology, 75, 272-281.
DOI URL PMID |
| [17] |
Goetz SJ, Prince SD (1996). Remote sensing of net primary production in boreal forest stands. Agricultural and Forest Meteorology, 78, 149-179.
DOI URL |
| [18] | Harrison PA, Berry PM, Simpson G, Haslett JR, Blicharska M, Bucur M, Dunford R, Egoh B, Garcia-Llorente M, Geam ănă N, Geertsema W, Lommelen E, Meiresonne L, Turkelboom F (2014). Linkages between biodiversity attributes and ecosystem services: a systematic review. Ecosystem Services, 9, 191-203. |
| [19] | Hu ZH, Yu MJ (2006). Species diversity in four saccessional communites of evergreen broad-leaved forest in Gutian Mountain, Zhejiang Province. Chinese Journal of Ecology, 25, 603-606. |
| [ 胡正华, 于明坚 (2006). 浙江古田山常绿阔叶林演替序列研究: 群落物种多样性. 生态学杂志, 25, 603-606.] | |
| [20] | Jordan CF (1969). Derivation of leaf-area index from quality of light on the forest floor. Ecology, 50, 663-666. |
| [21] | Kerr JT, Ostrovsky M (2003). From space to species: ecological applications for remote sensing. Trends in Ecology and Evolution, 18(6), 299-305. |
| [22] | Koch B, Heyder U, Weinacker H (2006). Detection of individual tree crowns in airborne lidar data. Photogrammetric Engineering and Remote Sensing, 72, 357-363. |
| [23] | Kokaly RF, Asner GP, Ollinger SV, Martin ME, Wessman CA (2009). Characterizing canopy biochemistry from imaging spectroscopy and its application to ecosystem studies. Remote Sensing of Environment, 113, s78-s91. |
| [24] | Lefsky MA, Cohen WB, Harding DJ, Parker GG, Acker SA, Gower ST (2002). Lidar remote sensing of aboveground biomass in three biomes. Global Ecology and Biogeography, 11, 393-399. |
| [25] |
Legendre P, Mi XC, Ren HB, Ma KP, Yu MJ, Sun IF, He FL (2009). Partitioning beta diversity in a subtropical broad-leaved forest of China. Ecology, 90, 663-674.
URL PMID |
| [26] | Li Y, Yu FS (2009). A new validity function for fuzzy clustering. 2009 International Conference on Computational Intelligence and Natural Computing. IEEE, Wuhan. 462-465. |
| [27] | Li YM, Ni SX, Wang XZ (2003). The robustness of linear regression model in rice leaf chlorophyll concentration prediction. Journal of Remote Sensing, 7, 364-371. |
| [ 李云梅, 倪绍祥, 王秀珍 (2003). 线性回归模型估算水稻叶片叶绿素含量的适宜性分析. 遥感学报, 7, 364-371.] | |
| [28] | Lim K, Treitz P, Wulder MA, St-Onge B, Flood M (2003). LiDAR remote sensing of forest structure. Progress in Physical Geography, 27, 88-106. |
| [29] | Liu LX, Pang Y, Ren HB, Li ZY (2019). Predict tree species diversity from GF-2 satellite data in a subtropical forest of China. Scientia Silvae Sinicae, 55(2), 61-74. |
| [ 刘鲁霞, 庞勇, 任海保, 李增元 (2019). 基于高分2号遥感数据估测中亚热带天然林木本植物物种多样性. 林业科学, 55(2), 61-74.] | |
| [30] |
Long SP, Zhu XG, Naidu SL, Ort DR (2006). Can improvement in photosynthesis increase crop yields? Plant, Cell & Environment, 29, 315-330.
DOI URL PMID |
| [31] |
Lopatin J, Dolos K, Hernández HJ, Galleguillos M, Fassnacht FE (2016). Comparing generalized linear models and random forest to model vascular plant species richness using LiDAR data in a natural forest in central Chile. Remote Sensing of Environment, 173, 200-210.
DOI URL |
| [32] | Ma KP (2015). Biodiversity monitoring in China: from CForBio to Sino BON. Biodiversity Science, 23, 1-2. |
| [ 马克平 (2015). 中国生物多样性监测网络建设:从CForBio到Sino BON. 生物多样性, 23, 1-2.] | |
| [33] |
Mayfield MM, Levine JM (2010). Opposing effects of competitive exclusion on the phylogenetic structure of communities. Ecology Letters, 13, 1085-1093.
URL PMID |
| [34] | Melillo JM, Aber JD, Muratore JF (1982). Nitrogen and lignin control of hardwood leaf litter decomposition dynamics. Ecology, 63, 621-626. |
| [35] |
Mi XC, Guo J, Hao ZQ, Xie ZQ, Guo K, Ma KP (2016). Chinese forest biodiversity monitoring: scientific foundations and strategic planning. Biodiversity Science, 24, 1203-1219.
DOI URL |
| [ 米湘成, 郭静, 郝占庆, 谢宗强, 郭柯, 马克平 (2016). 中国森林生物多样性监测: 科学基础与执行计划. 生物多样性, 24, 1203-1219.] | |
| [36] |
Moffiet T, Mengersen K, Witte C, King R, Denham R (2005). Airborne laser scanning: exploratory data analysis indicates potential variables for classification of individual trees or forest stands according to species. Isprs Journal of Photogrammetry and Remote Sensing, 59(5), 289-309.
DOI URL |
| [37] |
Myers N, Mittermeier RA, Mittermeier CG, da Fonseca GAB, Kent J (2000). Biodiversity hotspots for conservation priorities. Nature, 403, 853-858.
DOI URL PMID |
| [38] | Næsset E, Økland T (2002). Estimating tree height and tree crown properties using airborne scanning laser in a boreal nature reserve. Remote Sensing of Environment, 79, 105-115. |
| [39] | Nelson R, Krabill WB, Tonelli J (1988). Estimating forest biomass and volume using airborne laser data. Remote Sensing of Environment, 24, 247-267. |
| [40] |
Palmer MW, Dixon PM (1990). Small-scale environmental heterogeneity and the analysis of species distributions along gradients. Journal of Vegetation Science, 1, 57-65.
DOI URL |
| [41] |
Pang Y, Li ZY, Chen EX, Sun GQ (2005). Lidar remote sensing technology and its application in forestry. Scientia Silvae Sinicae, 41(3), 129-136.
DOI URL |
| [ 庞勇, 李增元, 陈尔学, 孙国清 (2005). 激光雷达技术及其在林业上的应用. 林业科学, 41(3), 129-136.] | |
| [42] | Pang Y, Li ZY, Ju HB, Lu H, Jia W, Si L, Guo Y, Liu QW, Li SM, Liu LX, Xie BB, Tan BX, Dian YY (2016). LiCHy: the CAF’s LiDAR, CCD and hyperspectral integrated airborne observation system. Remote Sensing, 8, 398-413. |
| [43] | Penuelas J, Filella I, Biel C, Serrano L, Save R (1993). The reflectance at the 950-970 nm region as an indicator of plant water status. International Journal of Remote Sensing, 14, 1887-1905. |
| [44] | Pielou EC (1975). Ecological Diversity. John Wiley & Sons, New York. |
| [45] | Qian HY, Zhang TT, Chen SW, Wu DH, Wu CP, Yuan WG, Jin Y, Yu MJ (2018). Community structures and biodiversities of broad-leaved forest and two types of plantations in Gutianshan National Nature Reserve, Zhejiang Province. Guihaia, 38, 1371-1381. |
| [ 钱海源, 张田田, 陈声文, 巫东豪, 吴初平, 袁位高, 金毅, 于明坚 (2018). 古田山自然保护区阔叶林与两种人工林的群落结构和生物多样性. 广西植物, 38, 1371-1381.] | |
| [46] | Riano D, Valladares F, Condes S, Chuvieco E (2004). Estimation of leaf area index and covered ground from airborne laser scanner (Lidar) in two contrasting forests. Agricultural and Forest Meteorology, 124, 269-275. |
| [47] | Rocchini D, Luque S, Pettorelli N, Bastin L, Doktor D, Faedi N, Feilhauer H, Feret JB, Foody GM, Gavish Y (2018). Measuring β-diversity by remote sensing: a challenge for biodiversity monitoring. Methods in Ecology and Evolution, 9, 1787-1798. |
| [48] | Running SW (1990). Estimating terrestrial primary productivity by combining remote sensing and ecosystem simulation. Remote Sensing of Biosphere Functioning, 79, 65-86. |
| [49] | Savitzky A, Golay MJE (1964). Smoothing and differentiation of data by simplified least squares procedures. Analytical Chemistry, 36, 1627-1639. |
| [50] | Shi YF, Skidmore AK, Wang TJ, Holzwarth S, Heiden U, Pinnel N, Zhu X, Heurich M (2018). Tree species classification using plant functional traits from LiDAR and hyperspectral data. International Journal of Applied Earth Observation and Geoinformation, 73, 207-219. |
| [51] |
Simonson WD, Allen HD, Coomes DA (2012). Use of an airborne lidar system to model plant species composition and diversity of mediterranean oak forests. Conservation Biology, 26, 840-850.
DOI URL PMID |
| [52] | Spasojevic MJ, Suding KN (2012). Inferring community assembly mechanisms from functional diversity patterns: the importance of multiple assembly processes. Journal of Ecology, 100, 652-661. |
| [53] |
Townsend AR, Asner GP, Cleveland CC (2008). The biogeochemical heterogeneity of tropical forests. Trends in Ecology and Evolution, 23, 424-431.
DOI URL PMID |
| [54] | Turner W, Spector S, Gardiner N, Fladeland M, Sterling E, Steininger MK (2003). Remote sensing for biodiversity science and conservation. Trends in Ecology and Evolution, 18(6), 306-314. |
| [55] | Ustin SL, Roberts DA, Gamon JA, Asner GP, Green RO (2004). Using imaging spectroscopy to study ecosystem processes and properties. BioScience, 54, 523-534. |
| [56] | Van Soest PJ (1963). Use of detergents in the analysis of fibrous feeds. II. A rapid method for the determination of fiber and lignin. Journal of Association of Official Agricultural Chemists, 46, 829-835. |
| [57] | Véga C, Durrieu S (2011). Multi-level filtering segmentation to measure individual tree parameters based on Lidar data: application to a mountainous forest with heterogeneous stands. International Journal of Applied Earth Observation and Geoinformation, 13, 646-656. |
| [58] | Wang JH, Huang WJ, Zhao CJ, Yang MH, Wang ZJ (2003). The inversion of leaf biochemical components and grain quality indicators of winter wheat with spectral reflectance. Journal of Remote Sensing, 277-284. |
| [ 王纪华, 黄文江, 赵春江, 杨敏华, 王之杰 (2003). 利用光谱反射率估算叶片生化组分和籽粒品质指标研究. 遥感学报, 277-284.] | |
| [59] |
Wang R, Gamon JA (2019). Remote sensing of terrestrial plant biodiversity. Remote Sensing of Environment, 231, 111218. DOI: 10.1016/j.rse.2019.111218.
DOI URL |
| [60] | Wang WN, Zhang YJ, Li Y, Zhang XN (2006). The global fuzzy C-means clustering algorithm. 2006 6th World Congress on Intelligent Control and Automation, IEEE, Dalian. 3604-3607. |
| [61] | Weng CL, Zhang TT, Wu DH, Chen SW, Jin Y, Ren HB, Yu MJ, Luo YY (2019). Drivers and patterns of α- and β-diversity in ten main forest community types in Gutianshan, Eastern China. Biodiversity Science, 27, 33-41. |
| [ 翁昌露, 张田田, 巫东豪, 陈声文, 金毅, 任海保, 于明坚, 罗媛媛 (2019). 古田山10种主要森林群落类型的α和β多样性格局及影响因素. 生物多样性, 27, 33-41.] | |
| [62] |
Wright IJ, Reich PB, Westoby M, Ackerly DD, Baruch Z, Bongers F, Cavenderbares J, Chapin T, Cornelissen JHC, Diemer M, Flexas J, Garnier E, Groom PK, Gulias J, Hikosaka K, Lamont BB, Lee T, Lee W, Lusk C, Midgley JJ, Navas ML, Niinemets Ü, Oleksny J, Osada N, Poorter H, Poot P, Prior L, Pyankov VI, Roumet C, Thomas SC, Tjoelker MG, Veneklaas EJ, Villar R (2004). The worldwide leaf economics spectrum. Nature, 428, 821-827.
DOI URL PMID |
| [63] | Wu BF, Qian JK, Zeng Y (2017). Land Cover Atlas of the People’s Republic of China (1: 1,000,000). Sinomaps Press, Beijing. |
| [64] | Wu CY, Niu Z, Tang Q, Huang WJ (2008). Estimating chlorophyll content from hyperspectral vegetation indices: modeling and validation. Agricultural and Forest Meteorology, 148, 1230-1241. |
| [65] | Yu MJ, Hu ZH, Yu JP, Ding BY, Fang T (2001). Forest vegetation types in Gutianshan Natural Reserve in Zhejiang. Journal of Zhejiang University (Agriculture and Life Sciences), 27(4), 23-28. |
| [ 于明坚, 胡正华, 余建平, 丁炳扬, 方腾 (2001). 浙江古田山自然保护区森林植被类型. 浙江大学学报(农业与生命科学版), 27(4), 23-28.] | |
| [66] | Zarco-Tejada PJ, Miller JR, Noland TL, Mohammed GH, Sampson PH (2001). Scaling-up and model inversion methods with narrowband optical indices for chlorophyll content estimation in closed forest canopies with hyperspectral data. IEEE Transactions on Geoscience and Remote Sensing, 39, 1491-1507. |
| [67] | Zhao D, Pang Y, Li ZY, Liu LJ (2014). Isolating individual trees in a closed coniferous forest using small footprint lidar data. International Journal of Remote Sensing, 35, 7199-7218. |
| [68] | Zhao D, Pang Y, Li ZY, Sun GQ (2013). Filling invalid values in a lidar-derived canopy height model with morphological crown control. International Journal of Remote Sensing, 34, 4636-4654. |
| [69] | Zhao YJ (2016). Study on Forest Canopy Species Diversity Monitoring Using Airborne LiDAR and Hyperspectral Data. PhD dissertation, Institute of Remote Sensing and Digital Earth, Chinese Academy of Sciences, Beijing. 52-56. |
| [ 赵玉金 (2016). 基于高光谱和LiDAR的森林冠层物种多样性遥感监测方法研究. 博士学位论文, 中国科学院遥感与数字地球研究所, 北京. 52-56.] | |
| [70] | Zhao YJ, Zeng Y, Zhao D, Wu BF, Zhao QJ (2016). The optimal leaf biochemical selection for mapping species diversity based on imaging spectroscopy. Remote Sensing, 8, 216-231. |
| [71] | Zhao YJ, Zeng Y, Zheng ZJ, Dong WX, Zhao D, Wu BF, Zhao QJ (2018). Forest species diversity mapping using airborne LiDAR and hyperspectral data in a subtropical forest in China. Remote Sensing of Environment, 213, 104-114. |
| [72] | Zheng H, Ouyang ZY (2014). Practice and consideration for ecological redlining. Bulletin of the Chinese Academy of Sciences, 29, 457-461, 448. |
| [ 郑华, 欧阳志云 (2014). 生态红线的实践与思考. 中国科学院院刊, 29, 457-461, 448.] | |
| [73] | Zhu Y, Zhao GF, Zhang LW, Shen GC, Mi XC, Ren HB, Yu MJ, Chen JH, Chen SW, Fang T, Ma KP (2008). Community composition and structure of Gutianshan forest dynamic plot in a mid-subtropical evergreen broad-leaved forest, East China. Journal of Plant Ecology (Chinese Version), 32, 262-273. |
| [ 祝燕, 赵谷风, 张俪文, 沈国春, 米湘成, 任海保, 于明坚, 陈建华, 陈声文, 方腾, 马克平 (2008). 古田山中亚热带常绿阔叶林动态监测样地——群落组成与结构. 植物生态学报, 32, 262-273.] |
| [1] | HAO Qing, HUANG Chang. A review of forest aboveground biomass estimation based on remote sensing data [J]. Chin J Plant Ecol, 2023, 47(10): 1356-1374. |
| [2] | WANG Jia-Tong, NIU Chun-Yue, HU Tian-Yu, LI Wen-Kai, LIU Ling-Li, GUO Qing-Hua, SU Yan-Jun. Three-dimensional radiative transfer modeling of forest: recent progress, applications, and future opportunities [J]. Chin J Plant Ecol, 2022, 46(10): 1200-1218. |
| Viewed | ||||||
|
Full text |
|
|||||
|
Abstract |
|
|||||
Copyright © 2022 Chinese Journal of Plant Ecology
Tel: 010-62836134, 62836138, E-mail: apes@ibcas.ac.cn, cjpe@ibcas.ac.cn