
Chin J Plant Ecol ›› 2005, Vol. 29 ›› Issue (2): 235-241.DOI: 10.17521/cjpe.2005.0030
Previous Articles Next Articles
WANG Ben-Yang, YU Shi-Xiao*( )
)
Received:2003-11-11
Accepted:2003-11-11
Online:2005-11-11
Published:2005-03-10
Contact:
YU Shi-Xiao
WANG Ben-Yang, YU Shi-Xiao. MULTI-SCALE ANALYSES OF POPULATION DISTRIBUTION PATTERNS[J]. Chin J Plant Ecol, 2005, 29(2): 235-241.
Add to citation manager EndNote|Ris|BibTeX
URL: https://www.plant-ecology.com/EN/10.17521/cjpe.2005.0030
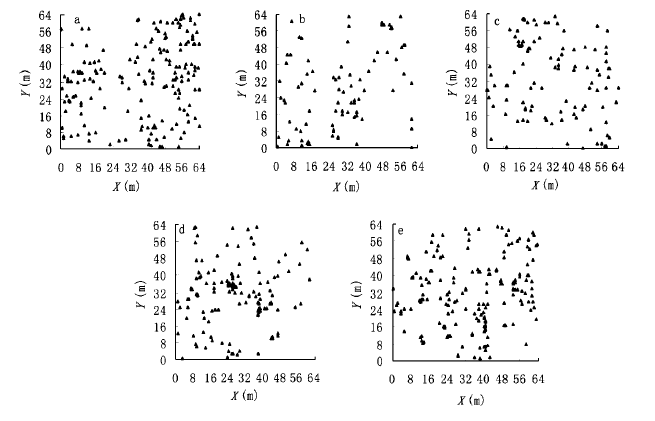
Fig.1 Mapped points pattern of five tree populations
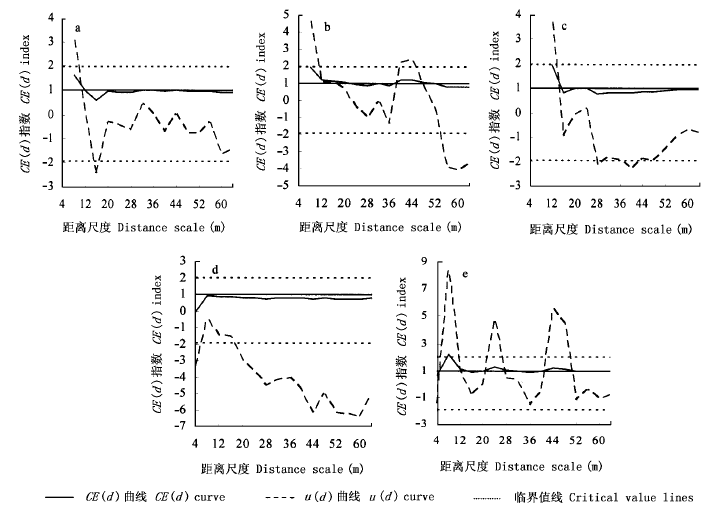
Fig.2 Spatial pattern of five tree populations
| [1] | Antonovics J, Levin DA (1980). Theecologicaland geneticconsequencesofdensity_dependentregulationinplants. An nualReviewofEcologyandSystematics, 11,411-452. |
| [2] | Hen YF (陈玉福), Dong M (董鸣) (2003). Spatialhetero geneityinecologicalsystems. ActaEcologicaSinica (生态学报), 23,346-352. (inChinesewithEnglishabstract). |
| [3] |
Clark PJ, Evans FC (1954). Distancetonearestneighbourasameasureofspatialrelationshipsinpopulations. Ecology, 35,445-453.
DOI URL |
| [4] | Dai XH (戴小华), Yu SX (余世孝) (2003). Analysisofpop ulationdistributionpatternbasedonGIStechnique. ActaScientiarumNaturaliumUniversitatisSunyatseni (中山大学学报 (自然科学版) ), 42,75-78. (inChinesewithEnglishabstract). |
| [5] | Ding SY (丁圣彦), Song YC (宋永昌) (1998). DecliningcausesofPinusmassonianaintheprocessofsuccessionofev ergreenbroad_leavedforest. ActaBotanicaSinica (植物学报), 40,755-760. (inChinesewithEnglishabstract). |
| [6] | Dong LK (董连科) (1991). FractalTheoryandItsApplica tions. LiaoningScienceandTechnologyPublishingHouse, Shenyang. (inChinese). |
| [7] | Donnelly KP (1978). Simulationstodeterminethevarianceandedgeeffectoftotalnearest-neighbourdistance.In:Hod derIed. SimulationStudiesinArchaeology.CambridgeU niversityPress, Cambridge,91-95. |
| [8] | Füldnerk (1995). ZurStructurbeschreibunginMischbest nden. Forstarchiv, 66,235-240. |
| [9] | Greig-Smith P (1983). QuantitativePlantEcology3rdedn.BlackwellScientificPublications, London. |
| [10] | Haase P (1995). SpatialpatternanalysisinecologybasedonRipley'sK_function:introductionandmethodsofedgecor rection. JournalofVegetationScience, 6,575-582. |
| [11] | Hou XY (侯向阳), Han JX (韩进轩) (1997). SimulationanalysisofspatialpatternsofmainspeciesintheKorean-pinebroadleavedforestinChangbaiMountain. ActaPhytoecolog icaSinica (植物生态学报), 21,242-249. (inChinesewithEnglishabstract). |
| [12] | Kint V, Lust N, Ferris R, Olsthoorn AFM (2000). Quantifi cationofforeststandstructureappliedtoScotspine (PinussylvestrisL.)forests.In:MasonBed.SilvicultureandBiodiversityofScotsPineForestsinEurope. ProceedingoftheFinalMeetingofaConcertedAction, June1999,Valsain, Spain.Investigaci ón A-graria:Sistemas y Recursos Forestales, FueradeSerie, 1,147-164. |
| [13] |
Li H, Reynolds JF (1995). Ondefinitionandquantificationofheterogeneity. Oikos, 73,280-284.
DOI URL |
| [14] | Li HB (李哈滨), Wang ZQ (王政权), Wang QC (王庆成) (1998). Theoryandmethodologyofspatialheterogeneityquantification. ChineseJournalofAppliedEcology (应用生态学报), 9,651-657. (inChinesewithEnglishabstract). |
| [15] | Lü YH (吕一河), Fu BJ (傅伯杰) (2001). Ecologicalscaleandscaling. ActaEcologicaSinica (生态学报), 21,2096-2105. (inChinesewithEnglishabstract). |
| [16] | Ma KM (马克明), Zu YG (祖元刚) (2000). Fractalproper tiesofvegetationpatterns. ActaPhytoecologicaSinica (植物生态学报), 24,111-117. (inChinesewithEnglishab stract). |
| [17] | Moeur M (1993). Characterizingspatialpatternsoftreesusingstem_mappeddata. ForestScience, 39,756-775. |
| [18] |
Perry JN, Liebhold AM, Rosenberg MS, Dungan J, Miriti M, Jakomulska A, Citron-Pousty S (2002). Illustrationsandguidelinesforselectingstatisticalmethodsforquantifyingspa tialpatterninecologicaldata. Ecography, 25,578-600.
DOI URL |
| [19] | Peterson JC, Squiers ER (1995). Anunexpectedchangeinspatialpatternacross10 yearsinanaspen-white-pineforest. JournalofEcology, 83,847-855. |
| [20] | Richards P, Williamson GB (1975). Treefallsandpatternsofunderstoryspeciesinawetlowlandtropicalforest. Ecology, 56,1226-1229. |
| [21] |
Stewart GH, Rose AB (1990). Thesignificanceoflifehistorystrategiesinthedevelopmentalhistoryofmixedbeechforests, NewZewland. Vegetatio, 87,101-114.
DOI URL |
| [22] | Tang MP (汤孟平), Tang SZ (唐守正), Lei XD (雷相东), Zhang HR (张会儒), Hong LX (洪玲霞), Feng YM (冯益民) (2003). EdgecorrectionofRipley'sK (d) functiononpopulationspatialpatternanalysis. ActaEcologicaSinica (生态学报), 23,1533-1538. (inChinesewithEnglishabstract). |
| [23] | Wang ZF (王峥峰), An SQ (安树青), Zhu XL (朱学雷), Campell DG, Yang XB (杨小波) (1998). Distributionpat ternoftreepopulationsintropicalforestandcomparisonofitsstudymethods. ChineseJournalofAppliedEcology (应用生态学报), 9,575-580. (inChinesewithEnglishab stract). |
| [24] | Xiao DN (肖笃宁), Bu RC (布仁仓), Li XZ (李秀珍) (1997). Spatialecologyandlandscapeheterogeneity. ActaEcologicaSinica (生态学报), 17,453-461. (inChinesewithEnglishabstract). |
| [25] | Xu HC (徐化成), Fan ZF (范兆飞), Wang S (王胜) (1994). AstudyinspatialpatternsoftreesinvirginLarixgmeliniforest. ActaEcologicaSinica (生态学报), 14,155-160. (inChinesewithEnglishabstract). |
| [26] | Yu SX (余世孝), Li Y (李勇), Wang YF (王永繁), Zhou CF (周灿芳) (2000). ThevegetationclassificationanditsdigitizedmapofHeishidingNatureReserve, GuangdongI.Thedistributionofthevegetationtypeandformation. ActaScientiarumNaturaliumUniversitatisSunyatseni (中山大学学报 (自然科学版) ), 39,61-66. (inChinesewithEnglishabstract). |
| [27] | Zan QJ (昝启杰), Li MG (李鸣光), Wang BS (王伯荪), Zhou XY (周先叶) (2000). Dynamicsofcommunitystruc tureinsuccessionalprocessofneedleandbroad_leavedmixedforestinHeishidingofGuangdong. ChineseJournalofAp pliedEcology (应用生态学报), 11,1-4. (inChinesewithEnglishabstract). |
| [28] | Zhang JT (张金屯) (1998). Analysisofspatialpointpatternforplantspecies. ActaPhytoecologicaSinica (植物生态学报), 22,344-349. (inChinesewithEnglishabstract). |
| [29] | Zhou XY (周先叶), Wang BS (王伯荪), Li MG (李鸣光), Zan QJ (昝启杰) (1999). ThecommunitydynamicsoftheforestsecondarysuccessioninHeishidingNaturalReserveofGuangdongprovince. ActaBotanicaSinica (植物学报), 41,877-886. (inChinesewithEnglishabstract). |
| [1] | Nan DONG, Ming-Ming TANG, Wen-Qian CUI, Meng-Yao YUE, Jie LIU, Yu-Jie HUANG. Growth of chestnut and tea seedlings under different root partitioning patterns [J]. Chin J Plant Ecol, 2022, 46(1): 62-73. |
| [2] | TA Feng, LIU Xian-De, LIU Run-Hong, ZHAO Wei-Jun, JING Wen-Mao, MA Jian, WU Xiu-Rong, ZHAO Jing-Zhong, MA Xue-E. Spatial distribution patterns and association of Picea crassifolia population in Dayekou Basin of Qilian Mountains, northwestern China [J]. Chin J Plant Ecol, 2020, 44(11): 1172-1183. |
| [3] | NING Yao, LEI Jin-Rui, SONG Xi-Qiang, HAN Shu-Mei, ZHONG Yun-Fang. Modeling the potential suitable habitat of Impatiens hainanensis, a limestone-endemic plant [J]. Chin J Plant Ecol, 2018, 42(9): 946-954. |
| [4] | Yan-Peng LI, Han XU, Yi-De LI, Tu-Shou LUO, De-Xiang CHEN, Zhang ZHOU, Ming-Xian LIN, Huai YANG. Scale-dependent spatial patterns of species diversity in the tropical montane rain forest in Jianfengling, Hainan Island, China [J]. Chin J Plant Ecol, 2016, 40(9): 861-870. |
| [5] | Xiao-Ting WANG, Xue-Fa WEN. Leaf water δD and δ18O enrichment process and influencing factors in spring maize (Zea mays) grown in the middle reaches of Heihe River Basin [J]. Chin J Plant Ecol, 2016, 40(9): 912-924. |
| [6] | LI Li, CHEN Jian-Hua, REN Hai-Bao, MI Xiang-Cheng, YU Ming-Jian, YANG Bo. Spatial patterns of Castanopsis eyrei and Schima superba in mid-subtropical broad- leaved evergreen forest in Gutianshan National Reserve, China [J]. Chin J Plant Ecol, 2010, 34(3): 241-252. |
| [7] | CHEN Ying. DETECTING EFFECT OF PHYLOGENETIC DIVERSITY ON SEEDLING MORTALITY IN AN EVERGREEN BROAD-LEAVED FOREST IN CHINA [J]. Chin J Plant Ecol, 2009, 33(6): 1084-1089. |
| [8] | XU Xiao-Ting, YANG Yong, WANG Li-Song. GEOGRAPHIC DISTRIBUTION AND POTENTIAL DISTRIBUTION ESTIMATION OF PSEUDOTAXUS CHIENII [J]. Chin J Plant Ecol, 2008, 32(5): 1134-1145. |
| [9] | BU Ren-Cang, CHANG Yu, HU Yuan-Man, LI Xiu-Zhen, HE Hong-Shi. SENSITIVITY OF CONIFEROUS TREES TO ENVIRONMENTAL FACTORS AT DIFFERENT SCALES IN THE SMALL XING'AN MOUNTAINS, CHINA [J]. Chin J Plant Ecol, 2008, 32(1): 80-87. |
| [10] | LIU Hai-Jiang, CHENG Wei-Ming, LONG En. LANDSCAPE CHANGES IN A DEGRADED SANDY LAND ECOSYSTEM—A CASE STUDY IN THE OTINDAG SANDY LAND, INNER MONGOLIA, CHINA [J]. Chin J Plant Ecol, 2007, 31(6): 1063-1072. |
| [11] | WANG Xin-Ting, WANG Wei, LIU Jia-Hui, LIANG Cun-Zhu, ZHANG Tao. A NEW METHOD MEASURING PLANT POPULATION SPATAL PATTERNS: PHOTOGRAPHY ORIENTATION [J]. Chin J Plant Ecol, 2006, 30(4): 571-575. |
| [12] | QUAN Zhan-Jun, CHENG Hong, YU Yun-Jiang, ZOU Xue-Yong. ASSESSMENT OF SUBSIDENCE IMPACT ON VEGETATION LANDSCAPE IN COAL MINING AREA —A CASE STUDY OF DONGDA MINE IN JINCHENG CITY, SHANXI PROVINCE [J]. Chin J Plant Ecol, 2006, 30(3): 414-420. |
| [13] | TANG Qi-Zhi, LIU Zhao-Pu, LIU Ling, ZHENG Qing-Song, CHEN Ming-Da. EFFECTS OF IRRIGATION WITH DILUTED SEAWATER ON ‘OLEIC SUNFLOWER G101’ GROWN IN SALINIZED SOILS, LAIZHOU, CHINA [J]. Chin J Plant Ecol, 2005, 29(6): 1000-1006. |
| [14] | TIAN Zi-Qiang, CHEN Yue, CHEN Wei-Lie, HU Dong. GAP ANALYSIS OF VEGETATION IN LONGMENHE REGION, SHENNONGJIA, CHINA [J]. Chin J Plan Ecolo, 2002, 26(增刊): 40-45. |
| [15] | GAO Jun, SONG Yong-Chang, ZHANG Qing-fei. Analysis on the Characteristics of Urban Vegetation and Its Mapping Based on Remote Sensing and Geographic Information System [J]. Chin J Plan Ecolo, 2002, 26(1): 1-9. |
| Viewed | ||||||
|
Full text |
|
|||||
|
Abstract |
|
|||||
Copyright © 2022 Chinese Journal of Plant Ecology
Tel: 010-62836134, 62836138, E-mail: apes@ibcas.ac.cn, cjpe@ibcas.ac.cn