Effect of shrub coverage on grassland ecosystem carbon pool in southwestern China
XUE Jing-Yue, WANG Li-Hua, XIE Yu, GAO Jing, HE Jun-Dong, WU Yan
Chin J Plant Ecol
2019, 43 ( 4):
365-373.
DOI: 10.17521/cjpe.2017.0062
AimsThe grassland in southwestern China is mainly warm and tropical grass and shrub grassland, accounting for approximately one-tenth of the national grassland area. Analysis of the relationship between shrub coverage and the grassland carbon pool and its composition is of great significance for accurately assessing carbon storage in the southwestern grassland, which grassland is still in the secondary succession stage.
MethodsIn a field investigation, 41 representative plots of different geomorphic types in southwestern China were divided into three types according to shrub coverage: no shrub grassland community (shrub coverage is 0), low shrub coverage grassland community (shrub coverage is 0-10%) and high shrub coverage grassland community (shrub coverage is 10%-30%). Carbon density was calculated by measuring the aboveground and underground biomass and litter biomass of grassland communities at different shrub coverage levels, as well as plant and soil carbon content.
Important findings The results showed that with increasing shrub coverage and species richness in grasslands, the ecosystem vegetation carbon density increased from 0.304 kg·m -2 to 1.574 kg·m -2, and the roots and litter carbon density also showed growth trends. The soil carbon density increased from 7.215 kg·m -2 to 9.735 kg·m -2, and the ecosystem carbon density increased from 7.519 kg·m -2 to 11.309 kg·m -2, with increasing shrub coverage. Regarding the composition of the grassland carbon pool, the soil carbon pool of the low shrub coverage grassland accounted for the smallest proportion of the ecosystem carbon pool. In summary, the increase in shrub coverage changes the composition of the grassland ecosystem carbon pool and leads to an increase in the amount of ecosystem carbon. Therefore, when estimating the grassland ecosystem carbon pool, it is necessary to overall plan for and take into account the changes in grassland shrub coverage in southern China.
灌木植物
盖度
Shrub coverage | 植被碳库
Carbon pool of
vegetation (kg·m-2) | 土壤碳库
Soil carbon pool (kg·m-2) | 生态系统碳库
Carbon pool of
ecosystem (kg·m-2) | 0-50 cm土层碳库
Soil carbon pool of 0-50 cm layer
(kg·m-2) | 植被碳库占生态
系统碳库比例
Ratio of vegetation
and ecosystem (%) | 土壤碳库占生态
系统碳库比例
Ratio of soil and
ecosystem (%) | | I | 0.304 ± 0.036a | 7.215 ± 0.507a | 7.519 ± 0.505a | 6.870 ± 0.468a | 4.33 ± 0.79a | 95.67 ± 0.79a | | II | 1.407 ± 0.204b | 6.031 ± 0.736a | 7.438 ± 0.717a | 5.485 ± 0.722a | 19.70 ± 3.57b | 80.30 ± 3.57b | | III | 1.574 ± 0.675b | 9.735 ± 0.444b | 11.309 ± 1.011b | 7.166 ± 0.374b | 12.54 ± 4.36ab | 87.46 ± 4.36ab | | F | 11.459 | 1.610 | 5.734 | 1.287 | 9.053 | 9.053 | | p | <0.001 | 0.213 | 0.007 | 0.288 | 0.001 | 0.001 |
Table 3
Carbon pool in grassland ecosystem with different shrub coverage in southwestern China
Extracts from the Article
中国西南地区草地主要为暖性及热性草丛、灌草丛, 约占全国草地面积的1/10, 分析灌木植物盖度与草地碳库及其构成的关系对于准确评估尚处于次生演替阶段的南方草地碳储量具有重要意义。该研究基于野外实地调查, 将西南地区不同地貌类型的41个代表性草地样地依据灌木植物盖度划分为3种类型: 无灌木植物草地群落(灌木植物盖度为0)、低灌木植物盖度草地群落(灌木植物盖度0-10%)和高灌木植物盖度草地群落(灌木植物盖度10%-30%), 测定了群落地上、地下生物量和凋落物生物量以及植物和土壤碳含量, 计算碳密度。结果表明: 随着草地群落灌木植物盖度增大, 生态系统植被碳密度从0.304 kg·m -2增加到1.574 kg·m -2, 其中根系和凋落物碳库也呈增长趋势; 土壤碳密度从7.215 kg·m -2增加到9.735 kg·m -2, 生态系统碳密度从7.519 kg·m -2增加到11.309 kg·m -2。草地碳库构成中, 低灌木植物盖度草地群落的土壤碳库占生态系统碳库比例最小。草地群落灌木植物盖度增加改变了草地生态系统碳库构成并导致生态系统碳库增加, 建议在估算草地生态系统碳库时, 需要统筹考虑并兼顾南方地区草地群落灌木植物盖度变化。
式中, Cp和Bp表示地上活体植物碳含量(%)和生物量(g); Cl和Bl表示凋落物碳含量(%)和生物量(g); Cr和Br表示根系碳含量(%)和生物量(g); BDsoil表示土壤容重(g·cm-3); Csoil表示土壤碳含量(%); Tsoil表示土层厚度(cm); Gsoil为砾石体积百分比; i表示土壤层。
不同灌木植物盖度草地群落的植被碳库差异显著(F = 11.459, p < 0.001), 随着草地群落灌木植物盖度逐渐增大, 植被碳库逐渐增加, 且低灌木植物盖度草地群落和高灌木植物盖度草地群落的植被碳库显著大于无灌木植物草地群落, 但低灌木植物盖度草地群落和高灌木植物盖度草地群落的植被碳库差异不显著(表3; 图1)。就地上植物碳密度而言, 无灌木植物草地群落、低灌木植物盖度草地群落和高灌木植物盖度草地群落分别为0.057、0.089和0.073 kg·m-2, 彼此之间地上植物碳库差异显著(F = 3.348, p = 0.046)。其次, 凋落物碳密度分别为0.005、0.014和0.015 kg·m-2, 三者间凋落物碳库差异显著(F = 9.223, p = 0.001), 低灌木植物盖度草地群落和高灌木植物盖度草地群落的凋落物碳库显著大于无灌木植物草地群落。另外, 三者的地下植物碳密度分别为0.242、1.304和1.486 kg·m-2, 彼此之间差异显著(F = 10.969, p < 0.001), 表现为低灌木植物盖度草地群落和高灌木植物盖度草地群落的根系碳库显著大于无灌木植物草地群落(图1)。随着草地群落灌木植物盖度增加, 包括凋落物和地下碳库在内, 植被碳库有逐渐增加的趋势, 但这种变化随着灌木植物盖度增加, 趋势有所减弱, 表现为低灌木植物盖度草地群落和高灌木植物盖度草地群落的植被碳库差异不显著。
从无灌木植物草地群落、低灌木植物盖度草地群落到高灌木植物盖度草地群落, 植被碳库和土壤碳库表现出了不同的变化趋势。植被碳库呈增加趋势, 土壤碳库先降低后增加, 生态系统碳库少量降低后显著增加。植被碳库在灌木从无到有的过程中发生了显著变化, 土壤碳库在草地群落灌木植物盖度从低到高的过程中显著增加。0-50 cm土层土壤碳库分别占1 m土壤碳库的95.22%、90.95%和77.28%, 50-100 cm土层碳库由4.78%增加到22.72%。说明随草地群落灌木植物盖度增加, 灌丛草地的土壤碳向深层分配, 这反映了灌木根系的贡献。植被碳库占草地生态系统碳库比例先增加后减少, 土壤碳库占生态系统碳库比例先降低后升高(表3)。
Other Images/Table from this Article
-
 Table 1
General information on the location and characteristics of the different investigation sites of grassland in southwestern China
Table 1
General information on the location and characteristics of the different investigation sites of grassland in southwestern China
-
Table 2
Grassland types and main species in grassland with different shrub coverage levels in southwestern China
-
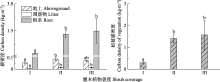 Fig. 1
Vegetation carbon pool of vegetation in grassland community with different shrub coverage in southwestern China. I, II, and III are the three different shrub coverage levels of the grassland community. I, II, and III represent no shrub grassland, low shrub coverage grassland, and high shrub coverage grassland, respectively. The data are the mean ± SE (I, II, n = 18; III, n = 5). Different lowercase letters indicate significant differences among sites with different shrub coverage of grassland levels (p < 0.05).
Fig. 1
Vegetation carbon pool of vegetation in grassland community with different shrub coverage in southwestern China. I, II, and III are the three different shrub coverage levels of the grassland community. I, II, and III represent no shrub grassland, low shrub coverage grassland, and high shrub coverage grassland, respectively. The data are the mean ± SE (I, II, n = 18; III, n = 5). Different lowercase letters indicate significant differences among sites with different shrub coverage of grassland levels (p < 0.05).
-
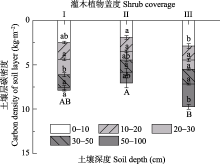 Fig. 2
Soil carbon pool in grassland community with different shrub coverage in southwestern China. I, II, and III represent no shrub grassland, low shrub coverage grassland, and high shrub coverage grassland, respectively. The data are the means ± SE (I, II, n = 18; III, n = 5). Different uppercase letters indicate that the soil carbon pool at 0-100 cm was significantly different among different shrub coverage grassland communities (p < 0.05), and different lowercase letters indicate significant differences in the carbon pool at different soil layers (p < 0.05).
Fig. 2
Soil carbon pool in grassland community with different shrub coverage in southwestern China. I, II, and III represent no shrub grassland, low shrub coverage grassland, and high shrub coverage grassland, respectively. The data are the means ± SE (I, II, n = 18; III, n = 5). Different uppercase letters indicate that the soil carbon pool at 0-100 cm was significantly different among different shrub coverage grassland communities (p < 0.05), and different lowercase letters indicate significant differences in the carbon pool at different soil layers (p < 0.05).
|
