
植物生态学报 ›› 2014, Vol. 38 ›› Issue (1): 1-16.DOI: 10.3724/SP.J.1258.2014.00001
• 研究论文 • 下一篇
穆少杰1, 周可新1,*( ), 齐杨2, 陈奕兆3, 方颖1, 朱超1
收稿日期:2013-09-09
接受日期:2013-11-04
出版日期:2014-09-09
发布日期:2014-01-15
通讯作者:
周可新
作者简介:*(E-mail:zkx@nies.org)
MU Shao-Jie1, ZHOU Ke-Xin1,*(), QI Yang2, CHEN Yi-Zhao3, FANG Ying1, ZHU Chao1
Received:2013-09-09
Accepted:2013-11-04
Online:2014-09-09
Published:2014-01-15
Contact:
ZHOU Ke-Xin
摘要:
植被降水利用效率(precipitation-use efficiency, PUE)是评价干旱、半干旱地区植被生产力对降水量时空动态响应特征的重要指标。该研究利用光能利用率CASA (Carnegie-Ames-Stanford Approach)模型估算了2001-2010年内蒙古地区植被净初级生产力(net primary productivity, NPP), 结合降水量的空间插值数据, 分析了近10年内蒙古地区植被PUE的空间分布、主要植被类型的PUE,及其时空格局的驱动因素。结果表明: 2001-2010年内蒙古地区所有植被的平均PUE为0.94 g C·m-2·mm-1, 且在105-120° E地带性规律明显,PUE上升速率为每10° 0.55 g C·m-2·mm-1。各植被类型间PUE差别较大, 其中灌丛PUE最高, 荒漠PUE最低。在不同的降水量区域, 植被PUE的空间分布与气候因子的关系有较大差别, 0-75 mm降水量区间内, PUE随降水量、气温的升高显著下降(R2 = 0.226, p < 0.05); 175-300 mm降水量区间内, 植被 PUE的空间变化与降水量和气温呈极显著相关关系(R2 = 0.878, p < 0.001), 且随降水量的增加显著上升( R2 = 0.94, p < 0.001), 变化速率约为每100 mm降水0.57 g C·m -2·mm-1; 在降水量大于475 mm的区域, 植被PUE的空间分布与降水量、气温的相关性显著(R2 = 0.19, p < 0.05), 且随着气温的上升、降水量的下降而增加, 其中气温的贡献是降水量的8.61倍。在不同的降水量区域, 植被 PUE的年际波动与气候因子的关系也有较大差别, 对于年降水量0-220 mm的地区, PUE的年际波动与降水量呈正相关性、与气温呈负相关性; 在年降水量为220-310 mm的地区, PUE的年际波动主要受降水量的控制, 受气温影响较小; 在年降水量>310 mm的地区,PUE的年际波动与降水量、气温均呈正相关关系, 但在降水量越高的地区, PUE的年际波动与降水量的相关性越弱, 与气温的相关性越强。植被覆盖度与PUE的空间分布极显著相关(R2 = 0.73, p < 0.001), 且与 PUE的年际波动也存在线性相关关系(R2 = 0.11, p < 0.001); 叶面积指数( LAI)与PUE的年际波动呈线性相关关系(R2 = 0.42, p < 0.001), 而当 LAI < 3.15时, PUE的空间分布随LAI增加而呈线性增加。
穆少杰, 周可新, 齐杨, 陈奕兆, 方颖, 朱超. 内蒙古植被降水利用效率的时空格局及其驱动因素. 植物生态学报, 2014, 38(1): 1-16. DOI: 10.3724/SP.J.1258.2014.00001
MU Shao-Jie, ZHOU Ke-Xin, QI Yang, CHEN Yi-Zhao, FANG Ying, ZHU Chao. Spatio-temporal patterns of precipitation-use efficiency of vegetation and their controlling factors in Inner Mongolia. Chinese Journal of Plant Ecology, 2014, 38(1): 1-16. DOI: 10.3724/SP.J.1258.2014.00001
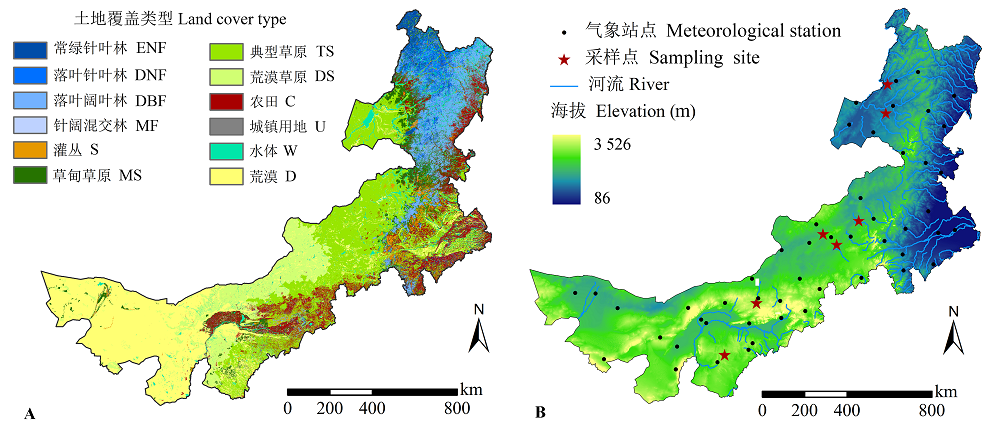
图1 内蒙古土地覆盖类型图(A)及气象站点、采样点空间分布图(B)。
Fig. 1 Maps of land cover types in Inner Mongolia (A) and the spatial distribution of meteorological stations and sampling sites (B). C, cropland; D, desert; DBF, deciduous broad-leaved forest; DNF, deciduous needle-leaf forest; DS, desert steppe; ENF, evergreen needle-leaf forest; MF, mixed needle-leaf and broad-leaved forest; MS, meadow steppe; S, shrub; TS, typical steppe; U, urban land; W, water body.
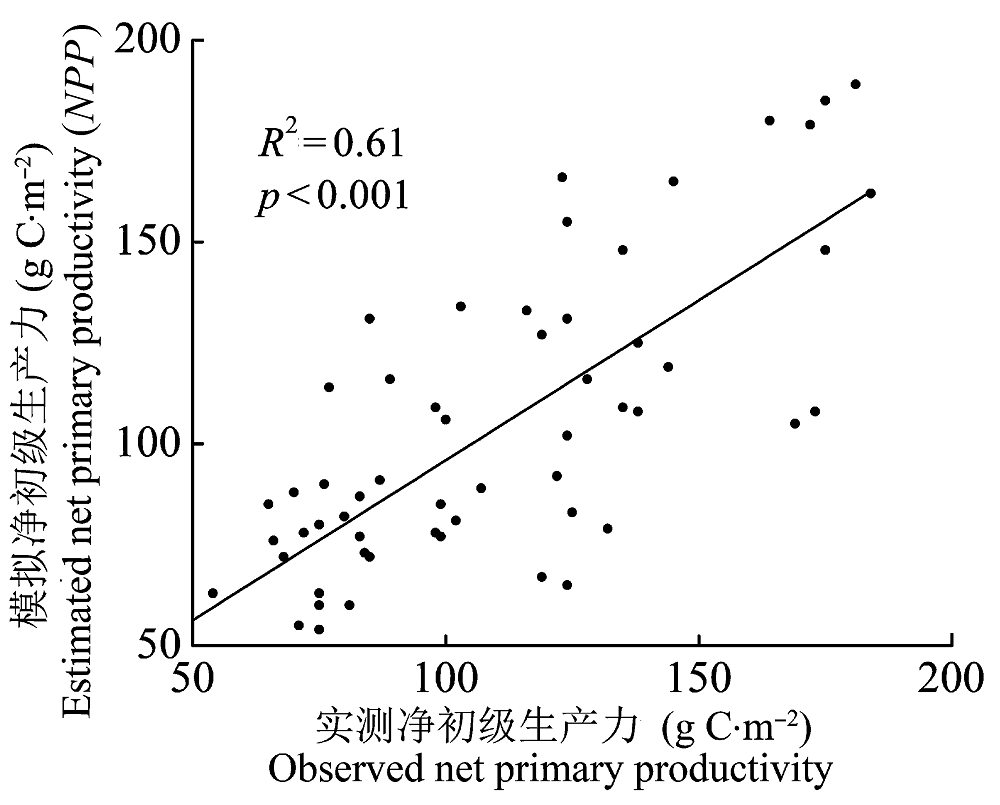
图2 内蒙古草地净初级生产力(NPP)模拟值与实测值的比较。
Fig. 2 Comparisons between simulated and observed net primary productivity (NPP) in Inner Mongolia grassland.
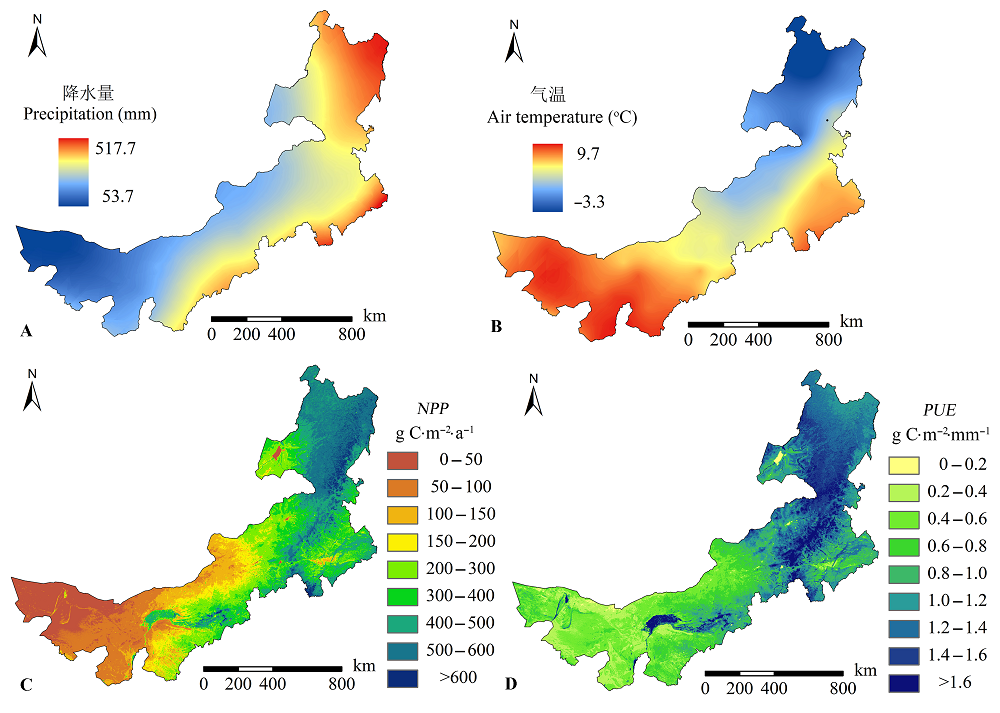
图3 2001-2010年内蒙古地区年降水量(A)、年平均气温(B)、植被净初级生产力(NPP) (C)和植被降水利用效率(PUE) (D)的空间格局。
Fig. 3 Spatial patterns of annual precipitation (A), annual mean air temperature (B), net primary productivity (NPP) (C) and precipitation-use efficiency (PUE) (D) of the vegetation in Inner Mongolia during 2001-2010.
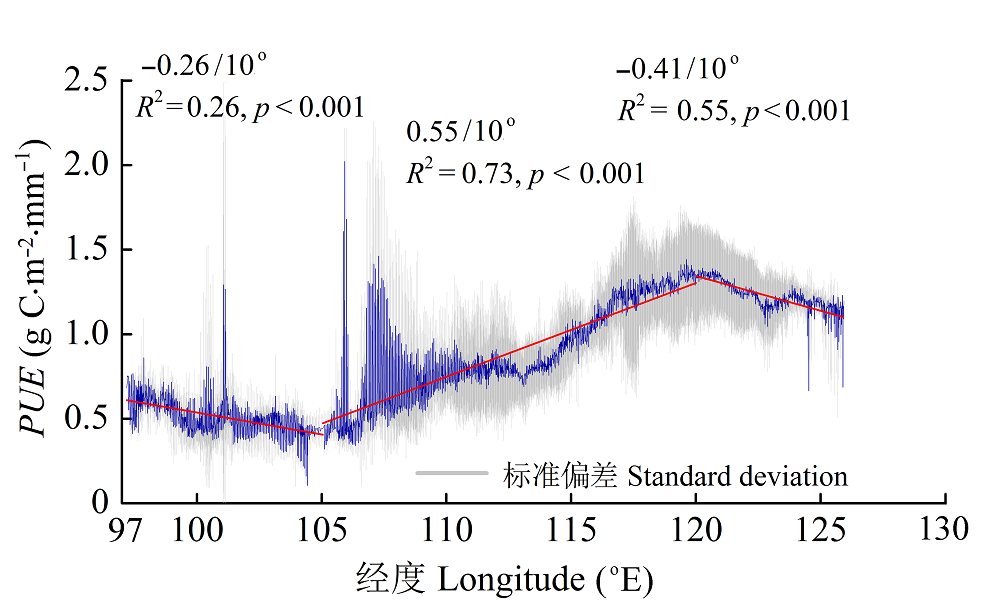
图4 2001-2010年内蒙古植被降水利用效率(PUE)随经度的变化。
Fig. 4 Variations of precipitation-use efficiency (PUE) with longitude in Inner Mongolia during 2001-2010.
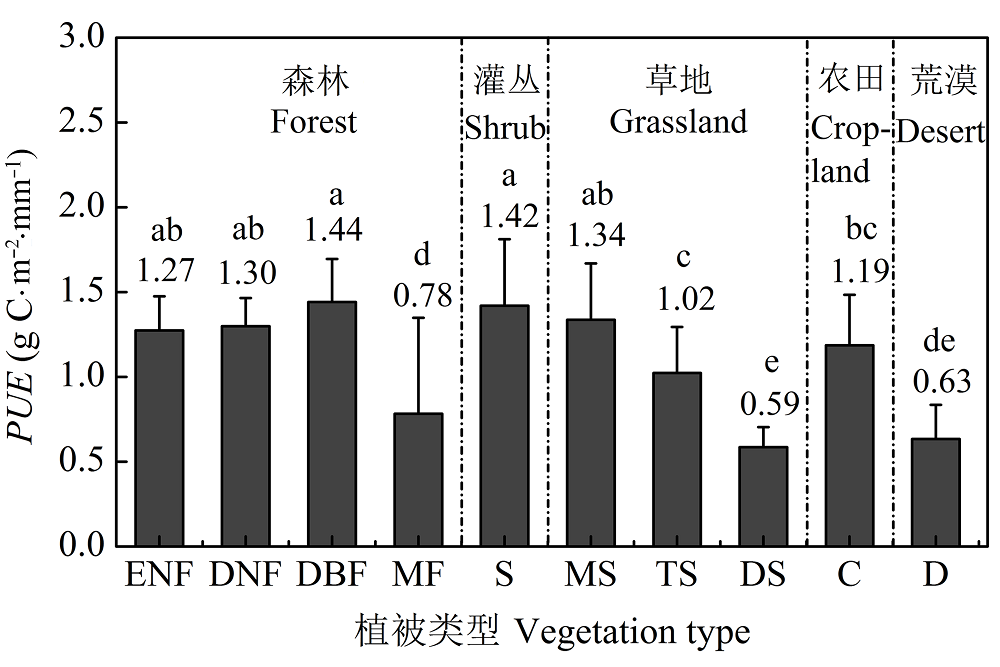
图5 2001-2010年内蒙古不同植被类型的降水利用效率(PUE)(平均值±标准误差)。C, 农田; D, 荒漠; DBF, 落叶阔叶林; DNF, 落叶针叶林; DS, 荒漠草原; ENF, 常绿针叶林; MF, 混交林; MS, 草甸草原; S, 灌丛; TS, 典型草原。误差线上方数字表示不同植被类型的PUE, 括号内数字分别表示森林和草地植被的平均PUE, 误差线上方的字母表示差异显著(p < 0.05)。
Fig. 5 Precipitation-use efficiency (PUE) in Inner Mongolia during 2001-2010 for different vegetation types (mean ± SE). C, cropland; D, desert; DBF, deciduous broad-leaved forest; DNF, deciduous needle-leaf forest; DS, desert steppe; ENF, evergreen needle-leaf forest; MF, mixed needle-leaf and broad-leaved forest; MS, meadow steppe; S, shrub; TS, typical steppe. The numbers above the error bars are the PUE for different vegetation types, and the numbers in the brackets are the mean PUE for forest and grassland, respectively. The letters above the error bars indicate significant difference (p < 0.05).
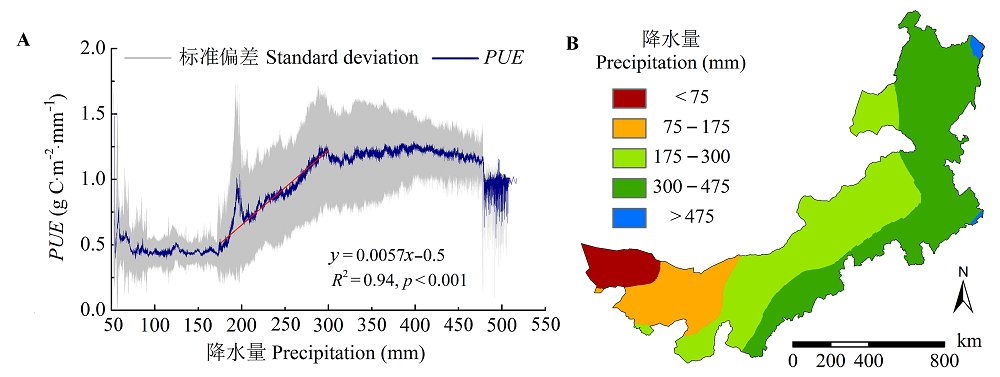
图6 内蒙古地区降水利用效率(PUE)随降水量的变化模式(A)及不同降水量区的空间分布(B)。
Fig. 6 Pattern of changes in precipitation-use efficiency (PUE) with precipitation (A) and the spatial distribution of areas with different precipitation ranges (B) in Inner Mongolia.
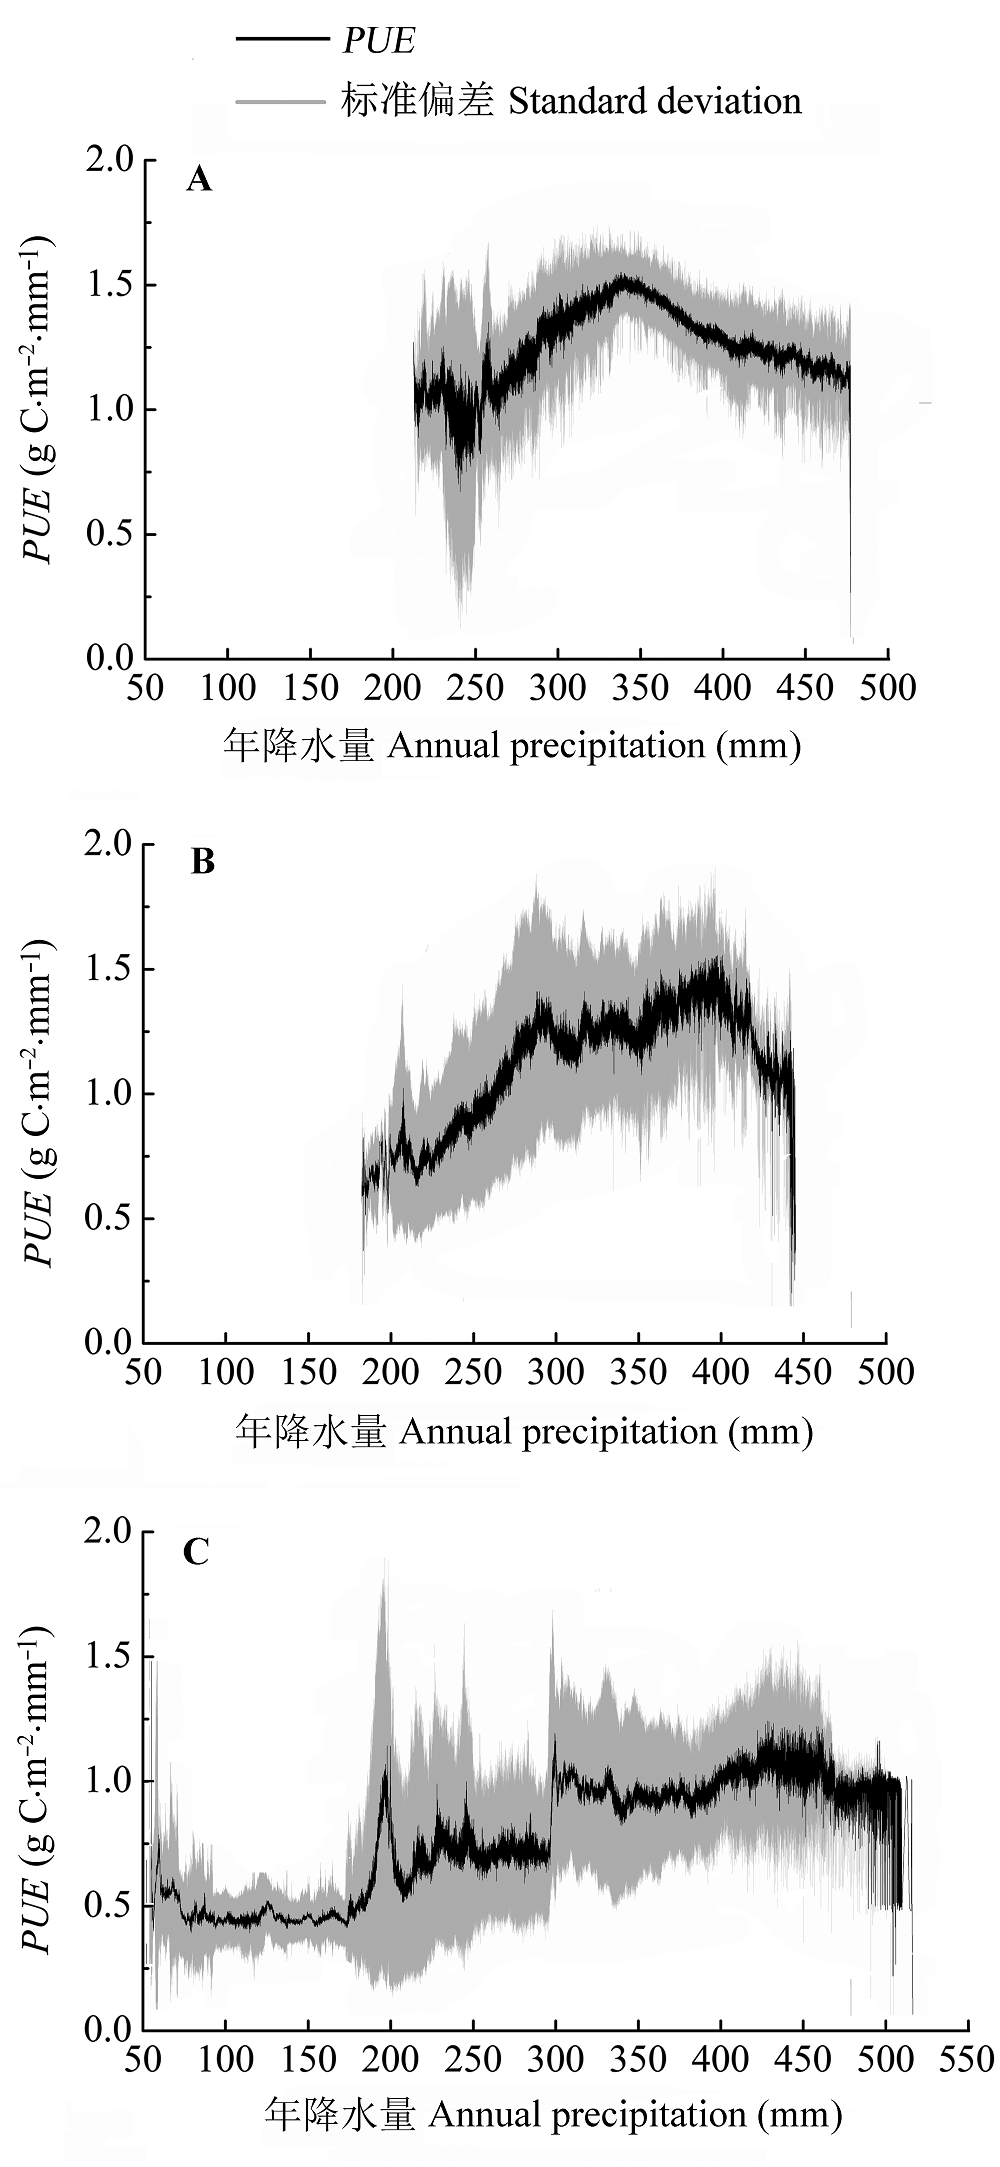
图7 内蒙古不同温度区降水利用效率(PUE)随降水量的变化模式。A, 低温区。B, 中温区。C, 高温区。
Fig. 7 Patterns of changes in precipitation-use efficiency (PUE) with precipitation by areas with different temperatures in Inner Mongolia. A, Low temperature area. B, Moderate temperature area. C, High temperature area.
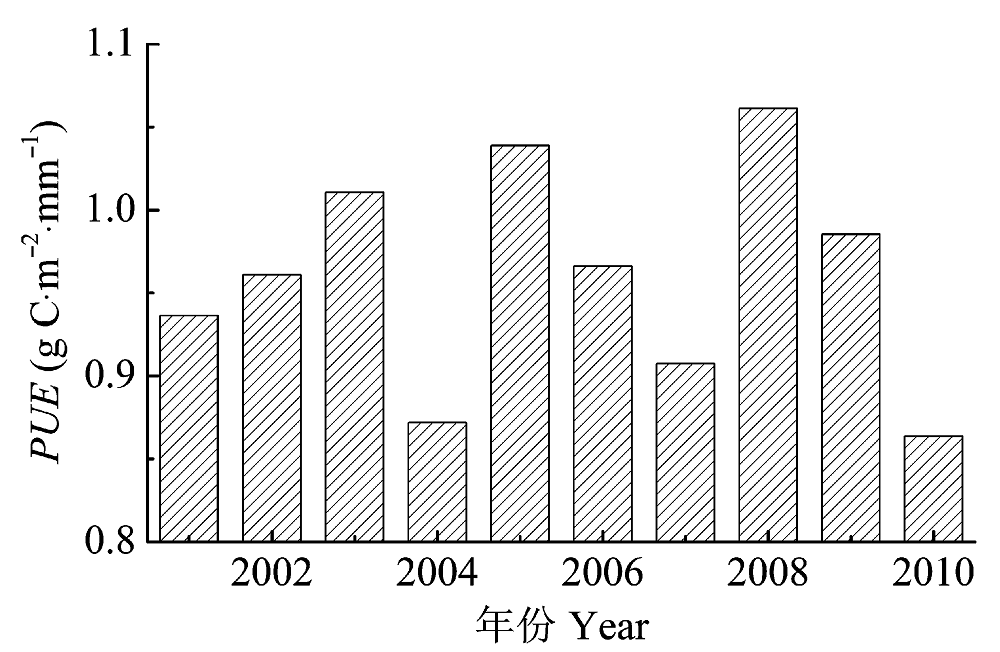
图8 2001-2010年内蒙古植被降水利用效率(PUE)的年际变化。
Fig. 8 Inter-annual changes of precipitation-use efficiency (PUE) of vegetation in Inner Mongolia during 2001-2010.
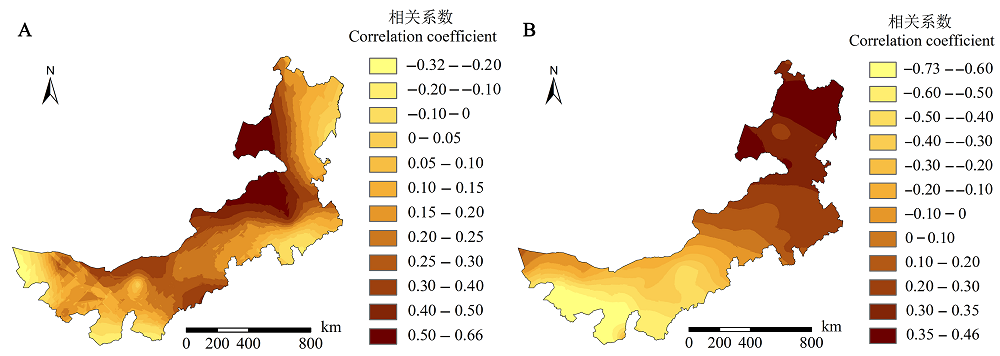
图9 2001-2010年内蒙古植被降水利用效率(PUE)对年降水量(A)和年平均气温(B)变化的响应。
Fig. 9 Responses of precipitation-use efficiency (PUE) of vegetation to annual precipitation (A) and annual mean air temperature change (B) in Inner Mongolia during 2001-2010.
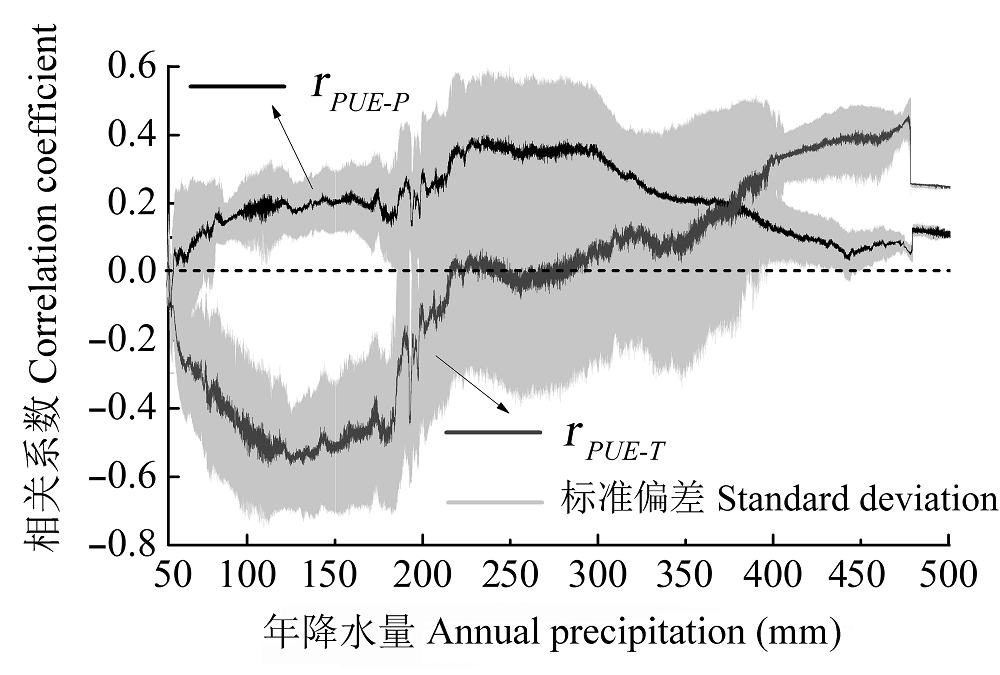
图10 2001-2010年内蒙古植被降水利用效率(PUE)年际波动与降水量、气温的相关系数随降水量的变化模式。rPUE-P, PUE与降水量的相关系数; rPUE-T, PUE与气温的相关系数。
Fig. 10 Patterns of changes with precipitation in the correlation coefficient between inter-annual variations of precipitation-use efficiency (PUE) and precipitation (rPUE-P) and the correlation coefficient between inter-annual variations of PUE and air temperature (rPUE-T) in Inner Mongolia during 2001-2010.
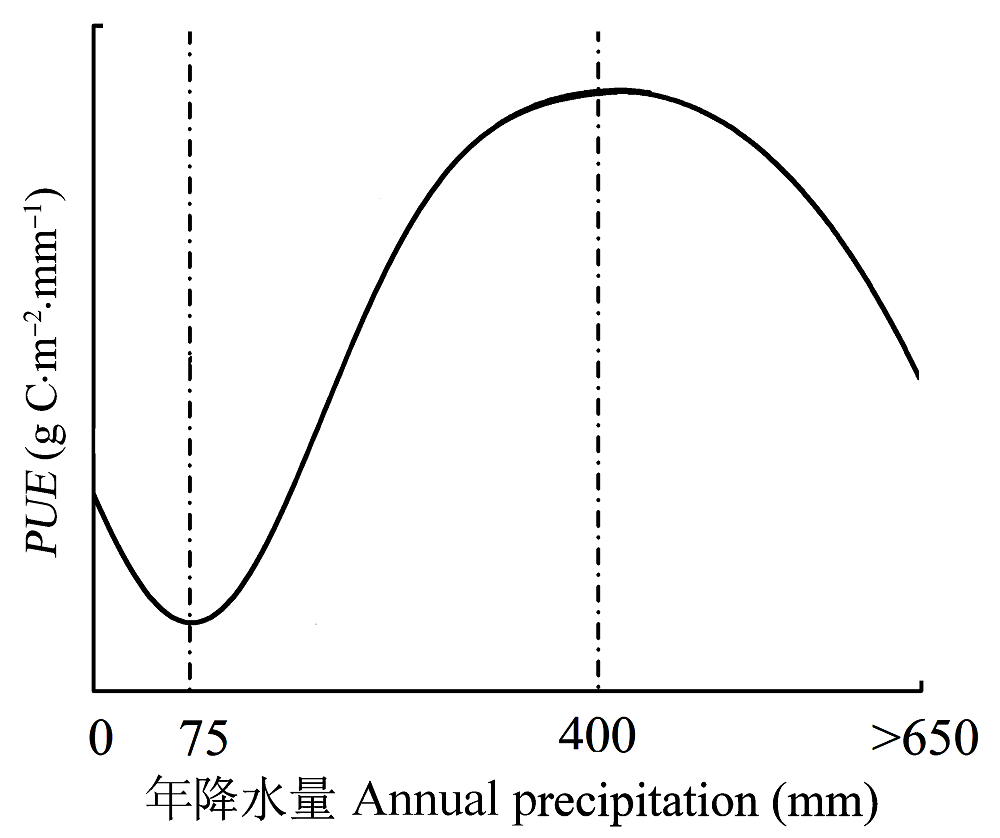
图11 描述内蒙古地区植被降水利用效率(PUE)的空间分布与降水量关系的概念模型。
Fig. 11 A conceptual model describing the relationship between spatial distribution of precipitation-use efficiency (PUE) and precipitation of vegetation in Inner Mongolia.
| 气温 Air temperature | 植被覆盖度 FVC | 叶面积指数 LAI | |
|---|---|---|---|
| 降水量 Precipitation | -0.594 | 0.875 | 0.725 |
| 气温 Air temperature | -0.664 | -0.834 | |
| 植被覆盖度 FVC | 0.853 |
表1 气候因子和生物学指标的相关性
Table 1 Correlations among climatic factors and biological indices
| 气温 Air temperature | 植被覆盖度 FVC | 叶面积指数 LAI | |
|---|---|---|---|
| 降水量 Precipitation | -0.594 | 0.875 | 0.725 |
| 气温 Air temperature | -0.664 | -0.834 | |
| 植被覆盖度 FVC | 0.853 |
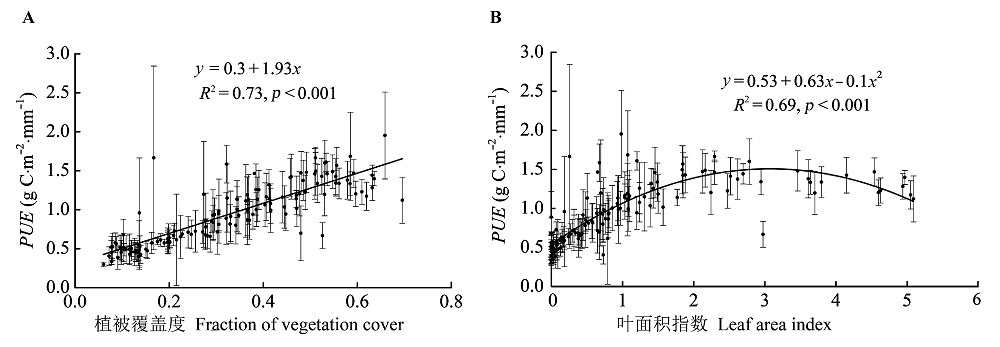
图12 降水利用效率(PUE)的空间分布与植被覆盖度(FVC) (A)和叶面积指数(LAI) (B)的相关性(平均值±标准偏差)。
Fig. 12 Correlations of spatial distribution of precipitation-use efficiency (PUE) with fraction of vegetation cover (FVC) (A) and leaf area index (LAI) (B) (mean ± SD).
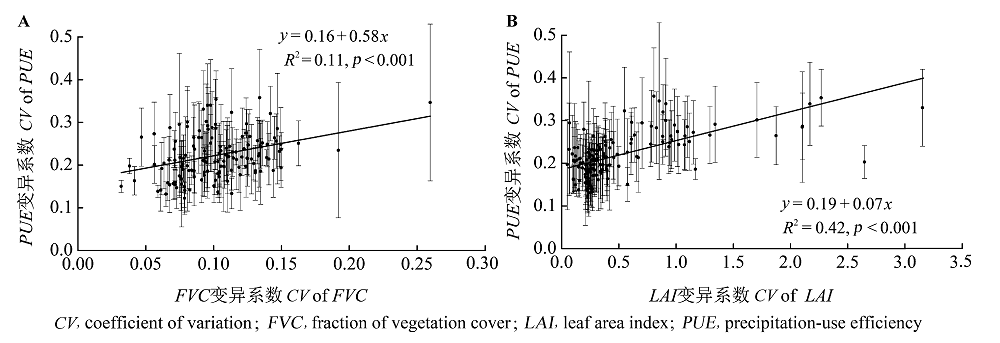
图13 植被降水利用效率(PUE)的年际波动与植被覆盖度(FVC) (A)和叶面积指数(LAI) (B)的相关性(平均值±标准偏差)。
Fig. 13 Correlations of inter-annual variations in precipitation-use efficiency (PUE) with fraction of vegetation cover (FVC) (A) and leaf area index (LAI) (B) (mean ± SD).
| [1] |
Bai YF, Han XG, Wu JG, Chen ZZ, Li LH (2004). Ecosystem stability and compensatory effects in the Inner Mongolia grassland. Nature, 431,181-184.
DOI URL PMID |
| [2] | Bai YF, Li LH, Wang QB, Zhang LX, Zhang Y, Chen ZZ (2000). Changes in plant species diversity and productivity along gradients of precipitation and elevation in the Xilin River Basin, Inner Mongolia. Acta Phytoecologica Sinica, 24,667-673. (in Chinese with English abstract) |
| [ 白永飞, 李凌浩, 王其兵, 张丽霞, 张焱, 陈佐忠 (2000). 锡林河流域草原群落植物多样性和初级生产力沿水热梯度变化的样带研究. 植物生态学报, 24,667-673.] | |
| [3] | Bai YF, Wu JG, Pan QM, Huang JH, Wang QB, Li FS, Buyantuyev A, Han XG (2007). Positive linear relationship between productivity and diversity: evidence from the Eurasian Steppe. Journal of Applied Ecology, 44,1023-1034. |
| [4] |
Bai YF, Wu JG, Qi X, Pan QM, Huang JH, Yang DL, Han XG (2008). Primary production and rain use efficiency across a precipitation gradient on the Mongolia Plateau. Ecology, 89,2140-2153.
URL PMID |
| [5] | Chabot BF, Hicks DJ (1982). The ecology of leaf life spans. Annual Review of Ecology and Systematics, 13,229-259. |
| [6] |
Ehleringer JR, Cerling TE, Helliker BR (1997). C 4 photosynthesis, atmospheric CO 2, and climate. Oecologia, 112,285-299.
DOI URL PMID |
| [7] | Farquhar GD, O’Leary MH, Berry JA (1982). On the relationship between carbon isotope discrimination and the intercellular carbon dioxide concentration in leaves. Australian Journal of Plant Physiology, 9,121-137. |
| [8] | Fensholt R, Rasmussen K (2011). Analysis of trends in the Sahelian “rain-use efficiency” using GIMMS NDVI, RFE and GPCP rainfall data. Remote Sensing of Environment, 115,438-451. |
| [9] | Gutman G, Ignatov A (1998). The derivation of the green vegetation fraction from NOAA/AVHRR data for use in numerical weather prediction models. International Journal of Remote Sensing, 19,1533-1543. |
| [10] | He MZ, Zhang ZS, Li XJ, Jia RL, Zhang JG, Zheng JG (2010). Environmental effects on distribution and composition of desert vegetations in Alxa Plateau: II. Correlation between C 4 plants distribution and environmental factors. Journal of Desert Research, 30,57-62. (in Chinese with English abstract) |
| [ 何明珠, 张志山, 李小军, 贾荣亮, 张景光, 郑敬刚 (2010). 阿拉善高原荒漠植被组成分布特征及其环境解释: II. C 4植物组成、分布特征与环境的关系. 中国沙漠, 30,57-62.] | |
| [11] | Hu ZM, Yu GR, Fan JW, Zhong HP, Wang SQ, Li SG (2010). Precipitation-use efficiency along a 4500-km grassland transect. Global Ecology and Biogeography, 19,842-851. |
| [12] | Hu ZM, Yu GR, Fu YL, Sun XM, Li YN, Shi PL, Wang YF, Zheng ZM (2008). Effects of vegetation control on ecosystem water use efficiency within and among four grassland ecosystems in China. Global Change Biology, 14,1609-1619. |
| [13] | Hu ZM, Yu GR, Wang QF, Zhao FH (2009). Ecosystem level water use efficiency: a review. Acta Ecologica Sinica, 29,1498-1507. (in Chinese with English abstract) |
| [ 胡中民, 于贵瑞, 王秋凤, 赵风华 (2009). 生态系统水分利用效率研究进展. 生态学报, 29,1498-1507.] | |
| [14] |
Huxman TE, Smith MD, Fay PA, Knapp AK, Shaw MR, Loik ME, Smith SD, Tissue DT, Zak JC, Weltzin JF, Pockman WT, Sala OE, Haddad BM, Harte J, Koch GW, Schwinning S, Small EE, Williams DG (2004). Convergence across biomes to a common rain-use efficiency. Nature, 429,651-654.
DOI URL PMID |
| [15] | Jobbágy EG, Sala OE (2000). Controls of grass and shrub aboveground production in the Patagonian Steppe. Ecological Applications, 10,541-549. |
| [16] | Kato T, Kimura R, Kamichika M (2004). Estimation of evapotranspiration, transpiration ratio and water-use efficiency from a sparse canopy using a compartment model. Agricultural Water Management, 65,173-191. |
| [17] | Knapp AK, Fay PA, Blair JM, Collins SL, Smith MD, Carlisle JD, Harper CW, Danner BT, Lett MS, McCarron JK (2002). Rainfall variability, carbon cycling, and plant species diversity in a mesic grassland. Science, 298,2202-2205. |
| [18] |
Knapp AK, Smith MD (2001). Variation among biomes in temporal dynamics of aboveground primary production. Science, 291,481-484.
DOI URL PMID |
| [19] | Kramer PJ, Kozlowski TT (1979). Physiology of Woody Plants. Academic Press, London. |
| [20] | Lauenroth WK, Burke IC, Paruelo JM (2000). Patterns of production and precipitation-use efficiency of winter wheat and native grasslands in the central Great Plains of the United States. Ecosystems, 3,344-351. |
| [21] | Le Houérou HN (1984). Rain use efficiency―a unifying concept in arid-land ecology. Journal of Arid Environments, 7,213-247. |
| [22] | Le Houérou HN, Bingham RL, Skerbek W (1988). Relationship between the variability of primary production and the variability of annual precipitation in world arid lands. Journal of Arid Environments, 15,1-18. |
| [23] | Lieth H (1975). Modeling the primary production of the world. In: Lieth H, Whittaker RH eds. Primary Productivity of the Biosphere. Springer-Verlag, Berlin. |
| [24] | Liu ZL (1985). Inner Mongolia Vegetation. Science Press, Beijing.332-367. (in Chinese) |
| [ 刘钟龄 (1985). 内蒙古植被. 科学出版社, 北京. 332-367.] | |
| [25] | Lo Seen D, Mougin E, Rambal S, Gaston A, Hiernaux P (1995). A regional Sahelian grassland model to be coupled with multispectral satellite data. II: Toward the control of its simulations by remotely sensed indices. Remote Sensing of Environment, 52,194-206. |
| [26] | Long HL, Li XB, Wang H, Wei DD, Zhang C (2010). Net primary productivity ( NPP) of grassland ecosystem and its relationship with climate in Inner Mongolia. Acta Ecologica Sinica, 30,1367-1378. (in Chinese with English abstract) |
| [ 龙慧灵, 李晓兵, 王宏, 魏丹丹, 张程 (2010). 内蒙古草原区植被净初级生产力及其与气候的关系. 生态学报, 30,1367-1378.] | |
| [27] | Lu L, Li X, Huang CL, Veroustraete F (2007). Analysis of the spatio-temporal characteristics of water use efficiency of vegetation in west China. Journal of Glaciology and Geocryology, 29,777-784. (in Chinese with English abstract) |
| [ 卢玲, 李新, 黄春林, Veroustraete F (2007). 中国西部植被水分利用效率的时空特征分析. 冰川冻土, 29,777-784.] | |
| [28] | Ma WH, Yang YH, He JS, Zeng H, Fang JY (2008). The relationship between grassland biomass dynamics and the meteorological factors in Inner Mongolia. Science in China (Life Science), 38,84-92. (in Chinese with English abstract) |
| [ 马文红, 杨元合, 贺金生, 曾辉, 方精云 (2008). 内蒙古温带草地生物量及其与环境因子的关系. 中国科学(生命科学), 38,84-92.] | |
| [29] | Paruelo JM, Lauenroth WK, Burke IC, Sala OE (1999). Grassland precipitation-use efficiency varies across a resource gradient. Ecosystems, 2,64-68. |
| [30] | Prince SD, de Colstoun EB, Kravitz LL (1998). Evidence from rain-use efficiencies does not indicate extensive Sahelian desertification. Global Change Biology, 4,359-374. |
| [31] | Prince SD, Wessels KJ, Tucker CJ, Nicholson SE (2007). Desertification in the Sahel: a reinterpretation of a reinterpretation. Global Change Biology, 13,1308-1313. |
| [32] | Qu CM, Han XG, Su B, Huang JH, Jiang GM (2001). The characteristics of foliar δ 13C values of plants and plant water use efficiency indicated by δ 13C values in two fragmented rainforests in Xishuangbanna, Yunnan. Acta Botanica Sinica, 43,186-192. (in Chinese with English abstract) |
| [ 渠春梅, 韩兴国, 苏波, 黄建辉, 蒋高明 (2001). 云南西双版纳片断化热带雨林植物叶片 δ 13C值的特点及其对水分利用效率的指示. 植物学报, 43,186-192.] | |
| [33] | Sala OE, Parton WJ, Joyce LA, Lauenroth WK (1988). Primary production of the central grassland region of the United States. Ecology, 69,40-45. |
| [34] | Shi ZJ, Gao JX, Xu LH, Feng ZY, Lü SH, Shang JX (2011). Effect of vegetation on changes of temperature and precipitation in Inner Mongolia, China. Ecology and Environment Sciences, 20,1594-1601. (in Chinese with English abstract) |
| [ 时忠杰, 高吉喜, 徐丽宏, 冯朝阳, 吕世海, 尚建勋 (2011). 内蒙古地区近25年植被对气温和降水变化的影响. 生态环境学报, 20,1594-1601.] | |
| [35] | Su PX, Zhao AF, Zhang LX, Du MW, Chen HS (2003). Characteristic in photosynthesis, transpiration and water use efficiency of Haloxylon ammodendron and Calligonum mongolicum of desert species. Acta Botanica Boreali-Occidentalia Sinica, 23,11-17. (in Chinese with English abstract) |
| [ 苏培玺, 赵爱芬, 张立新, 杜明武, 陈怀顺 (2003). 荒漠植物梭梭和沙拐枣光合作用、蒸腾作用及水分利用效率特征. 西北植物学报, 23,11-17.] | |
| [36] | Sun GN, Wang MH (2008). Study on relation and distribution between vegetative coverage and land degradation in Inner Mongolia. Journal of Arid Land Resources and Environment, 22,140-144. (in Chinese with English abstract) |
| [ 孙根年, 王美红 (2008). 内蒙古植被覆盖与土地退化关系及空间结构研究. 干旱区资源与环境, 22,140-144.] | |
| [37] | Sun YL, Guo P, Yan XD, Zhao TB (2010). Dynamics of vegetation cover and its relationship with climate change and human activities in Inner Mongolia. Journal of Natural Resources, 25,407-414. (in Chinese with English abstract) |
| [ 孙艳玲, 郭鹏, 延晓冬, 赵天宝 (2010). 内蒙古植被覆盖变化及其与气候、人类活动的关系. 自然资源学报, 25,407-414.] | |
| [38] | Webb W, Szarek S, Lauenroth W, Kinerson R, Smith M (1978). Primary productivity and water use in native forest, grassland, and desert ecosystems. Ecology, 59,1239-1247. |
| [39] | Wu K, Lu B, Yuan Z (2006). The recent developments and the contributation of farmland irrigation to national grain safeness in China. Journal of Irrigation and Drainage, 25,7-10. (in Chinese with English abstract) |
| 吴凯, 卢布, 袁璋 (2006). 我国农田灌溉发展近况及其对粮食安全的贡献. 灌溉排水学报, 25,7-10.]. | |
| [40] | Yang YH, Fang JY, Fay PA, Bell JE, Ji CJ (2010). Rain use efficiency across a precipitation gradient on the Tibetan Plateau. Geophysical Research Letters, 37,L15702, doi: 10.1029/2010GL043920. |
| [41] | Ye H, Wang JB, Huang M, Qi SH (2012). Spatial pattern of vegetation precipitation use efficiency and its response to precipitation and temperature on the Qinghai-Xizang Plateau of China. Chinese Journal of Plant Ecology, 36,1237-1247. (in Chinese with English abstract) |
| [ 叶辉, 王军邦, 黄玫, 齐述华 (2012). 青藏高原植被降水利用效率的空间格局及其对降水和气温的响应. 植物生态学报, 36,1237-1247.] | |
| [42] | Yin H, Li ZG, Wang YL, Cai F (2011). Assessment of desertification using time series analysis of hyper-temporal vegetation indicator in Inner Mongolia. Acta Geographica Sinica, 66,653-661. (in Chinese with English abstract) |
| [ 殷贺, 李正国, 王仰麟, 蔡福 (2011). 基于时间序列植被特征的内蒙古荒漠化评价. 地理学报, 66,653-661.] | |
| [43] |
Yu F, Price KP, Ellis J, Shi P (2003). Response of seasonal vegetation development to climatic variations in eastern central Asia. Remote Sensing of Environment, 87,42-54.
DOI URL |
| [44] | Yu GR, Song X, Wang QF, Liu YF, Guan DX, Yan JH, Sun XM, Zhang LM, Wen XF (2008). Water-use efficiency of forest ecosystems in eastern China and its relations to climatic variables. New Phytologist, 177,927-937. |
| [45] | Zhu WQ, Pan YZ, Zhang JS (2007). Estimation of net primary productivity of Chinese terrestrial vegetation based on remote sensing. Journal of Plant Ecology (Chinese Version), 31,413-424. (in Chinese with English abstract) |
| [ 朱文泉, 潘耀忠, 张锦水 (2007). 中国陆地植被净初级生产力遥感估算. 植物生态学报, 31,413-424.] |
| [1] | 郑周涛, 张扬建. 1982-2018年青藏高原水分利用效率变化及归因分析[J]. 植物生态学报, 2022, 46(12): 1486-1496. |
| [2] | 刘兵兵, 魏建新, 胡天宇, 杨秋丽, 刘小强, 吴发云, 苏艳军, 郭庆华. 卫星遥感监测产品在中国森林生态系统的验证和不确定性分析——基于海量无人机激光雷达数据[J]. 植物生态学报, 2022, 46(10): 1305-1316. |
| [3] | 刘超, 李平, 武运涛, 潘胜难, 贾舟, 刘玲莉. 一种基于数码相机图像和群落冠层结构调查的草地地上生物量估算方法[J]. 植物生态学报, 2022, 46(10): 1280-1288. |
| [4] | 汲玉河, 周广胜, 王树东, 王丽霞, 周梦子. 2000-2019年秦岭地区植被生态质量演变特征及 驱动力分析[J]. 植物生态学报, 2021, 45(6): 617-625. |
| [5] | 黄松宇, 贾昕, 郑甲佳, 杨睿智, 牟钰, 袁和第. 中国典型陆地生态系统波文比特征及影响因素[J]. 植物生态学报, 2021, 45(2): 119-130. |
| [6] | 杨焕莹, 宋建达, 周焘, 金光泽, 姜峰, 刘志理. 林分、土壤及空间因子对谷地云冷杉林叶面积指数空间异质性的影响[J]. 植物生态学报, 2019, 43(4): 342-351. |
| [7] | 王亚林, 龚容, 吴凤敏, 范文武. 2001-2013年中国灌木生态系统净初级生产力的时空变化特征及其对气候变化的响应[J]. 植物生态学报, 2017, 41(9): 925-937. |
| [8] | 刘泽彬, 王彦辉, 刘宇, 田奥, 王亚蕊, 左海军. 宁夏六盘山半湿润区华北落叶松林冠层叶面积指数的时空变化及坡面尺度效应[J]. 植物生态学报, 2017, 41(7): 749-760. |
| [9] | 高林, 王晓菲, 顾行发, 田庆久, 焦俊男, 王培燕, 李丹. 植冠下土壤类型差异对遥感估算冬小麦叶面积指数的影响[J]. 植物生态学报, 2017, 41(12): 1273-1288. |
| [10] | 周明, 刘志理, 金光泽. 利用3种校正方案提高间接法测定兴安落叶松人工林叶面积指数的精度[J]. 植物生态学报, 2016, 40(6): 574-584. |
| [11] | 米兆荣, 陈立同, 张振华, 贺金生. 基于年降水、生长季降水和生长季蒸散的高寒草地水分利用效率[J]. 植物生态学报, 2015, 39(7): 649-660. |
| [12] | 朱绪超, 袁国富, 邵明安, 易小波, 杜涛. 塔里木河下游河岸带植被的空间结构特征[J]. 植物生态学报, 2015, 39(11): 1053-1061. |
| [13] | 刘志理, 金光泽, 周明. 利用直接法和间接法测定针阔混交林叶面积指数的季节动态[J]. 植物生态学报, 2014, 38(8): 843-856. |
| [14] | 王云霓,熊伟,王彦辉,于澎涛,曹恭祥,徐丽宏,左海军,贺亮亮. 宁夏六盘山3种针叶林降水利用效率的年际变化及其对气象因子的响应[J]. 植物生态学报, 2013, 37(10): 901-911. |
| [15] | 苏宏新, 白帆, 李广起. 3类典型温带山地森林的叶面积指数的季节动态: 多种监测方法比较[J]. 植物生态学报, 2012, 36(3): 231-242. |
| 阅读次数 | ||||||
|
全文 |
|
|||||
|
摘要 |
|
|||||
Copyright © 2022 版权所有 《植物生态学报》编辑部
地址: 北京香山南辛村20号, 邮编: 100093
Tel.: 010-62836134, 62836138; Fax: 010-82599431; E-mail: apes@ibcas.ac.cn, cjpe@ibcas.ac.cn
备案号: 京ICP备16067583号-19