
植物生态学报 ›› 2014, Vol. 38 ›› Issue (12): 1356-1363.DOI: 10.3724/SP.J.1258.2014.00130
康华靖1,2,3,4, 陶月良5, 权伟4, 王伟4, 欧阳竹2,3,4,*( )
)
收稿日期:2014-03-21
接受日期:2014-05-10
出版日期:2014-03-21
发布日期:2015-04-16
通讯作者:
欧阳竹
作者简介:*(E-mail: ouyz@igsnrr.ac.cn)基金资助:
KANG Hua-Jing1,2,3,4, TAO Yue-Liang5, QUAN Wei4, WANG Wei4, OUYANG Zhu2,3,4,*()
Received:2014-03-21
Accepted:2014-05-10
Online:2014-03-21
Published:2015-04-16
Contact:
OUYANG Zhu
摘要:
运用LI-6400便携式光合作用系统测定了不同光强(2000、1500、1000和500 μmol·m-2·s-1)和两种O2浓度(21%和2%的O2)下冬小麦(Triticum aestivum)灌浆期旗叶的CO2响应曲线, 比较了现有CO2响应模型(生化模型、直角双曲线模型和直角双曲线修正模型)拟合给出光下(暗)呼吸与测量值之间的差异。结果显示, 直角双曲线修正模型所给出的光下呼吸速率拟合值与测量值最为接近。植物光合作用对大气CO2响应(A/Ca)的拟合结果优于光合作用对胞间CO2浓度(A/Ci)的拟合。然而, 所有模型基于A/Ca拟合的光下(暗)呼吸在整体上与测量值存在显著差异(p < 0.05), 推测与现有模型没有考虑CO2浓度对光呼吸和光下暗呼吸速率的影响有关。对小麦的试验结果表明, CO2浓度对光呼吸和光下暗呼吸均有显著影响: 随着CO2浓度的增加(0-1400 μmol·mol-1), 不同光强下的表观光呼吸变化范围分别为5.035-11.670、4.222-11.650、4.330-10.999和3.263-9.094 μmol CO2·m-2·s-1; 光下暗呼吸的变化范围分别为0.491-2.987、0.457-2.955、0.545-3.139和0.448-3.139 μmol CO2·m-2·s-1。回归分析发现, 表观光呼吸和光下暗呼吸与CO2浓度之间均存在较好的相关性。然而, 将该回归关系整合到现有模型中, 是否会优化模型, 从而提高模型对相关光合参数估算的准确性尚有待于进一步研究。
康华靖, 陶月良, 权伟, 王伟, 欧阳竹. 植物光合CO2响应模型对光下(暗)呼吸速率拟合的探讨. 植物生态学报, 2014, 38(12): 1356-1363. DOI: 10.3724/SP.J.1258.2014.00130
KANG Hua-Jing, TAO Yue-Liang, QUAN Wei, WANG Wei, OUYANG Zhu. Fitting mitochondrial respiration rates under light by photosynthetic CO2 response models. Chinese Journal of Plant Ecology, 2014, 38(12): 1356-1363. DOI: 10.3724/SP.J.1258.2014.00130
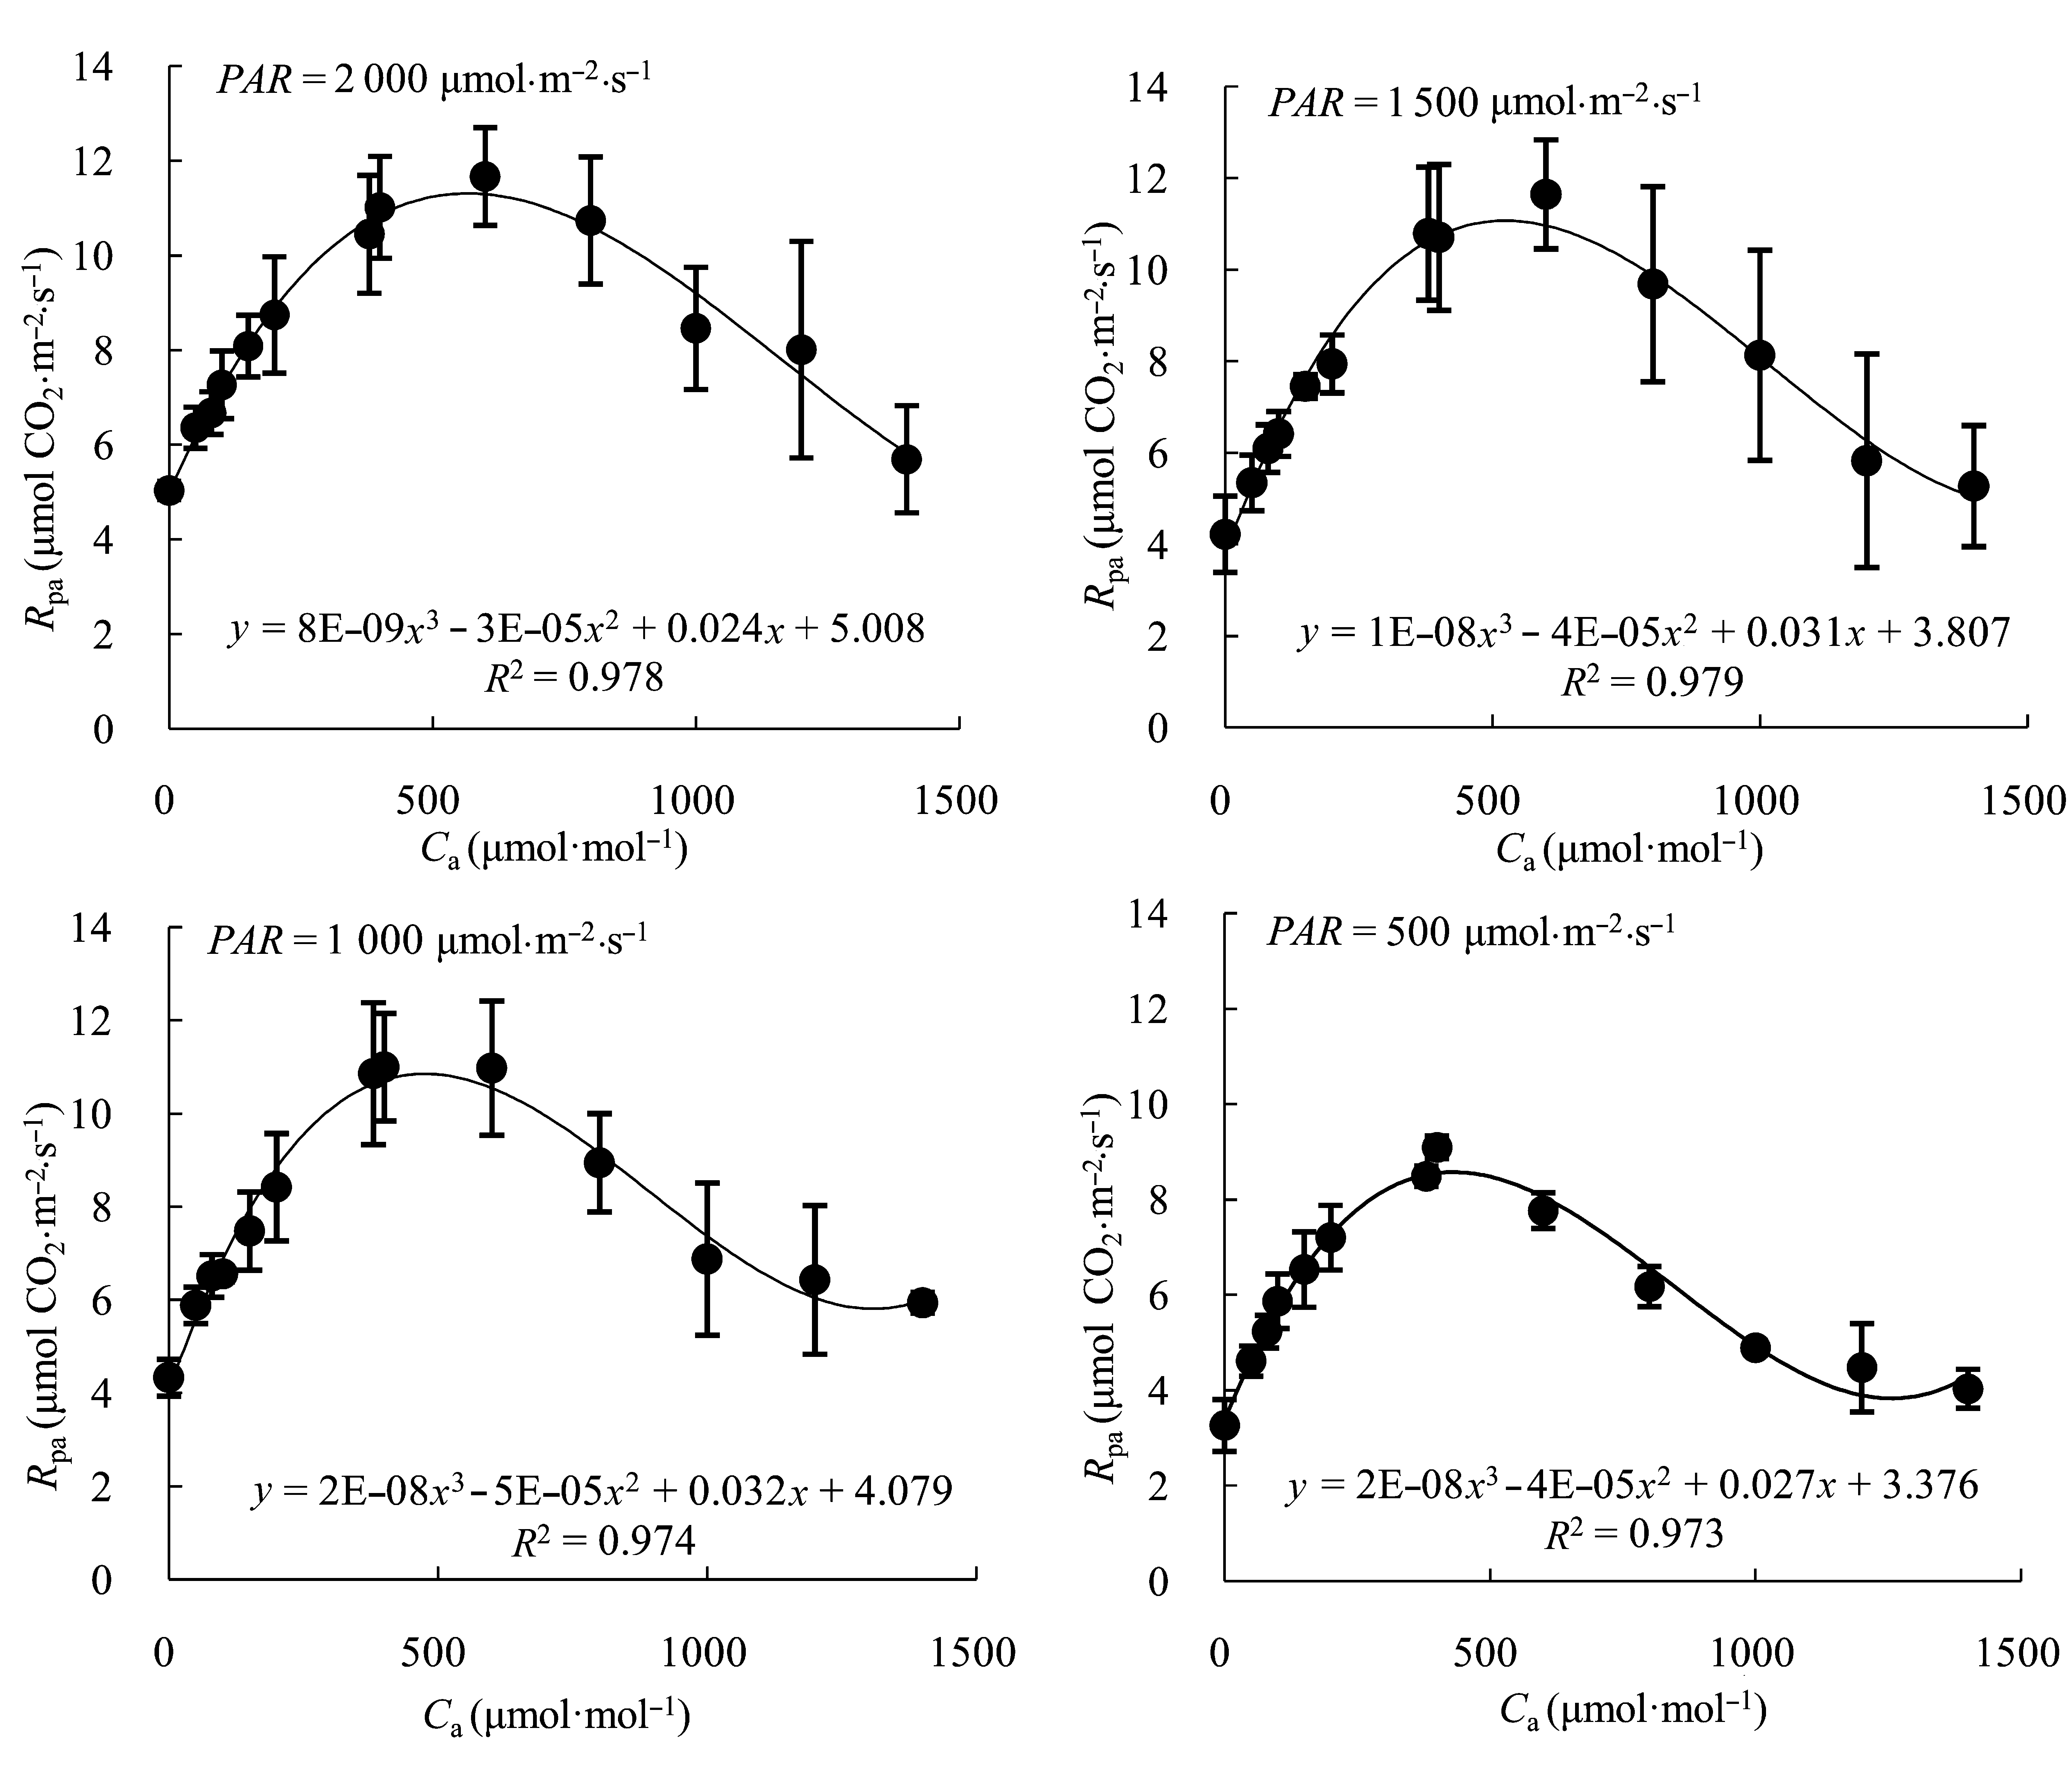
图1 不同光合有效辐射(PAR)下小麦旗叶表观光呼吸速率(Rpa)对CO2浓度(Ca)的响应(平均值±标准偏差)。
Fig. 1 Apparent photorespiration rate (Rpa) in response to CO2 concentration (Ca) at different photosynthetically active radiation (PAR) in flag leaves of wheat (mean ± SD).
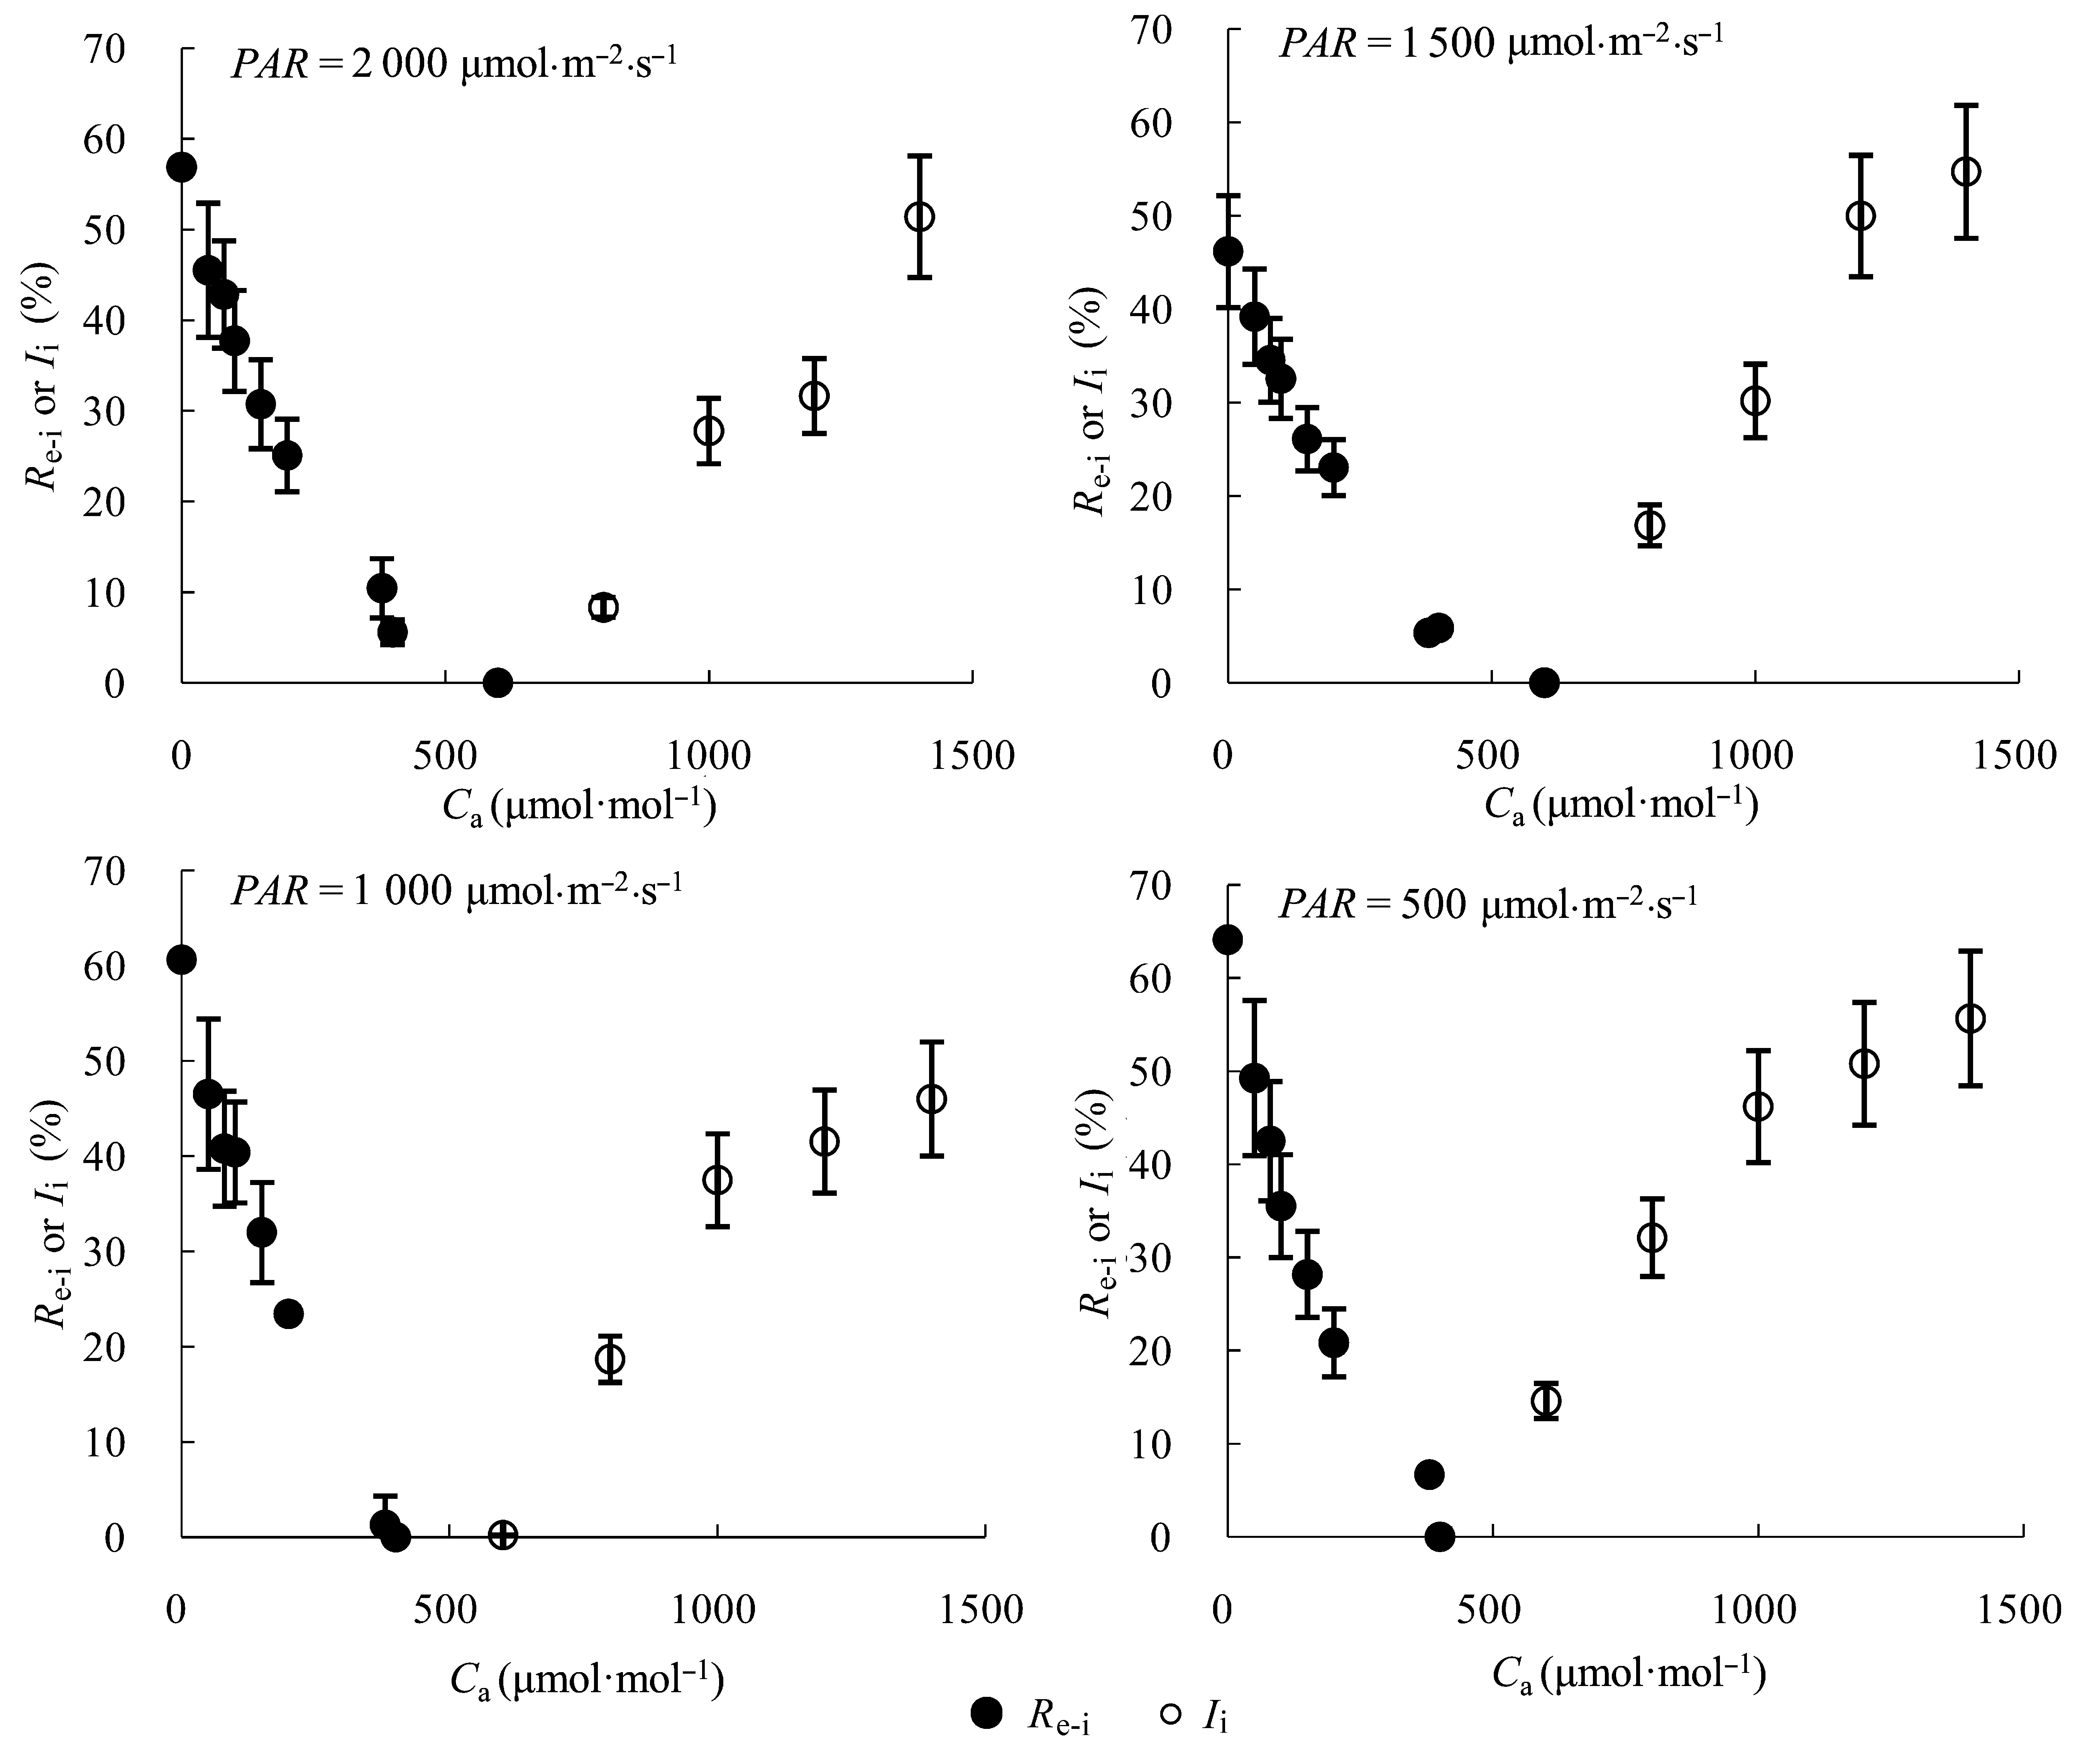
图2 不同光合有效辐射(PAR)下小麦叶片光呼吸CO2回收利用率(Re-i)或被抑制率(Ii)对CO2浓度(Ca)的响应(平均值±标准偏差)。
Fig. 2 Recovery (Re-i) or inhibition (Ii) of photorespiratory CO2 in response to CO2 concentration (Ca) at different photosynthetically active radiation (PAR) (mean ± SD).
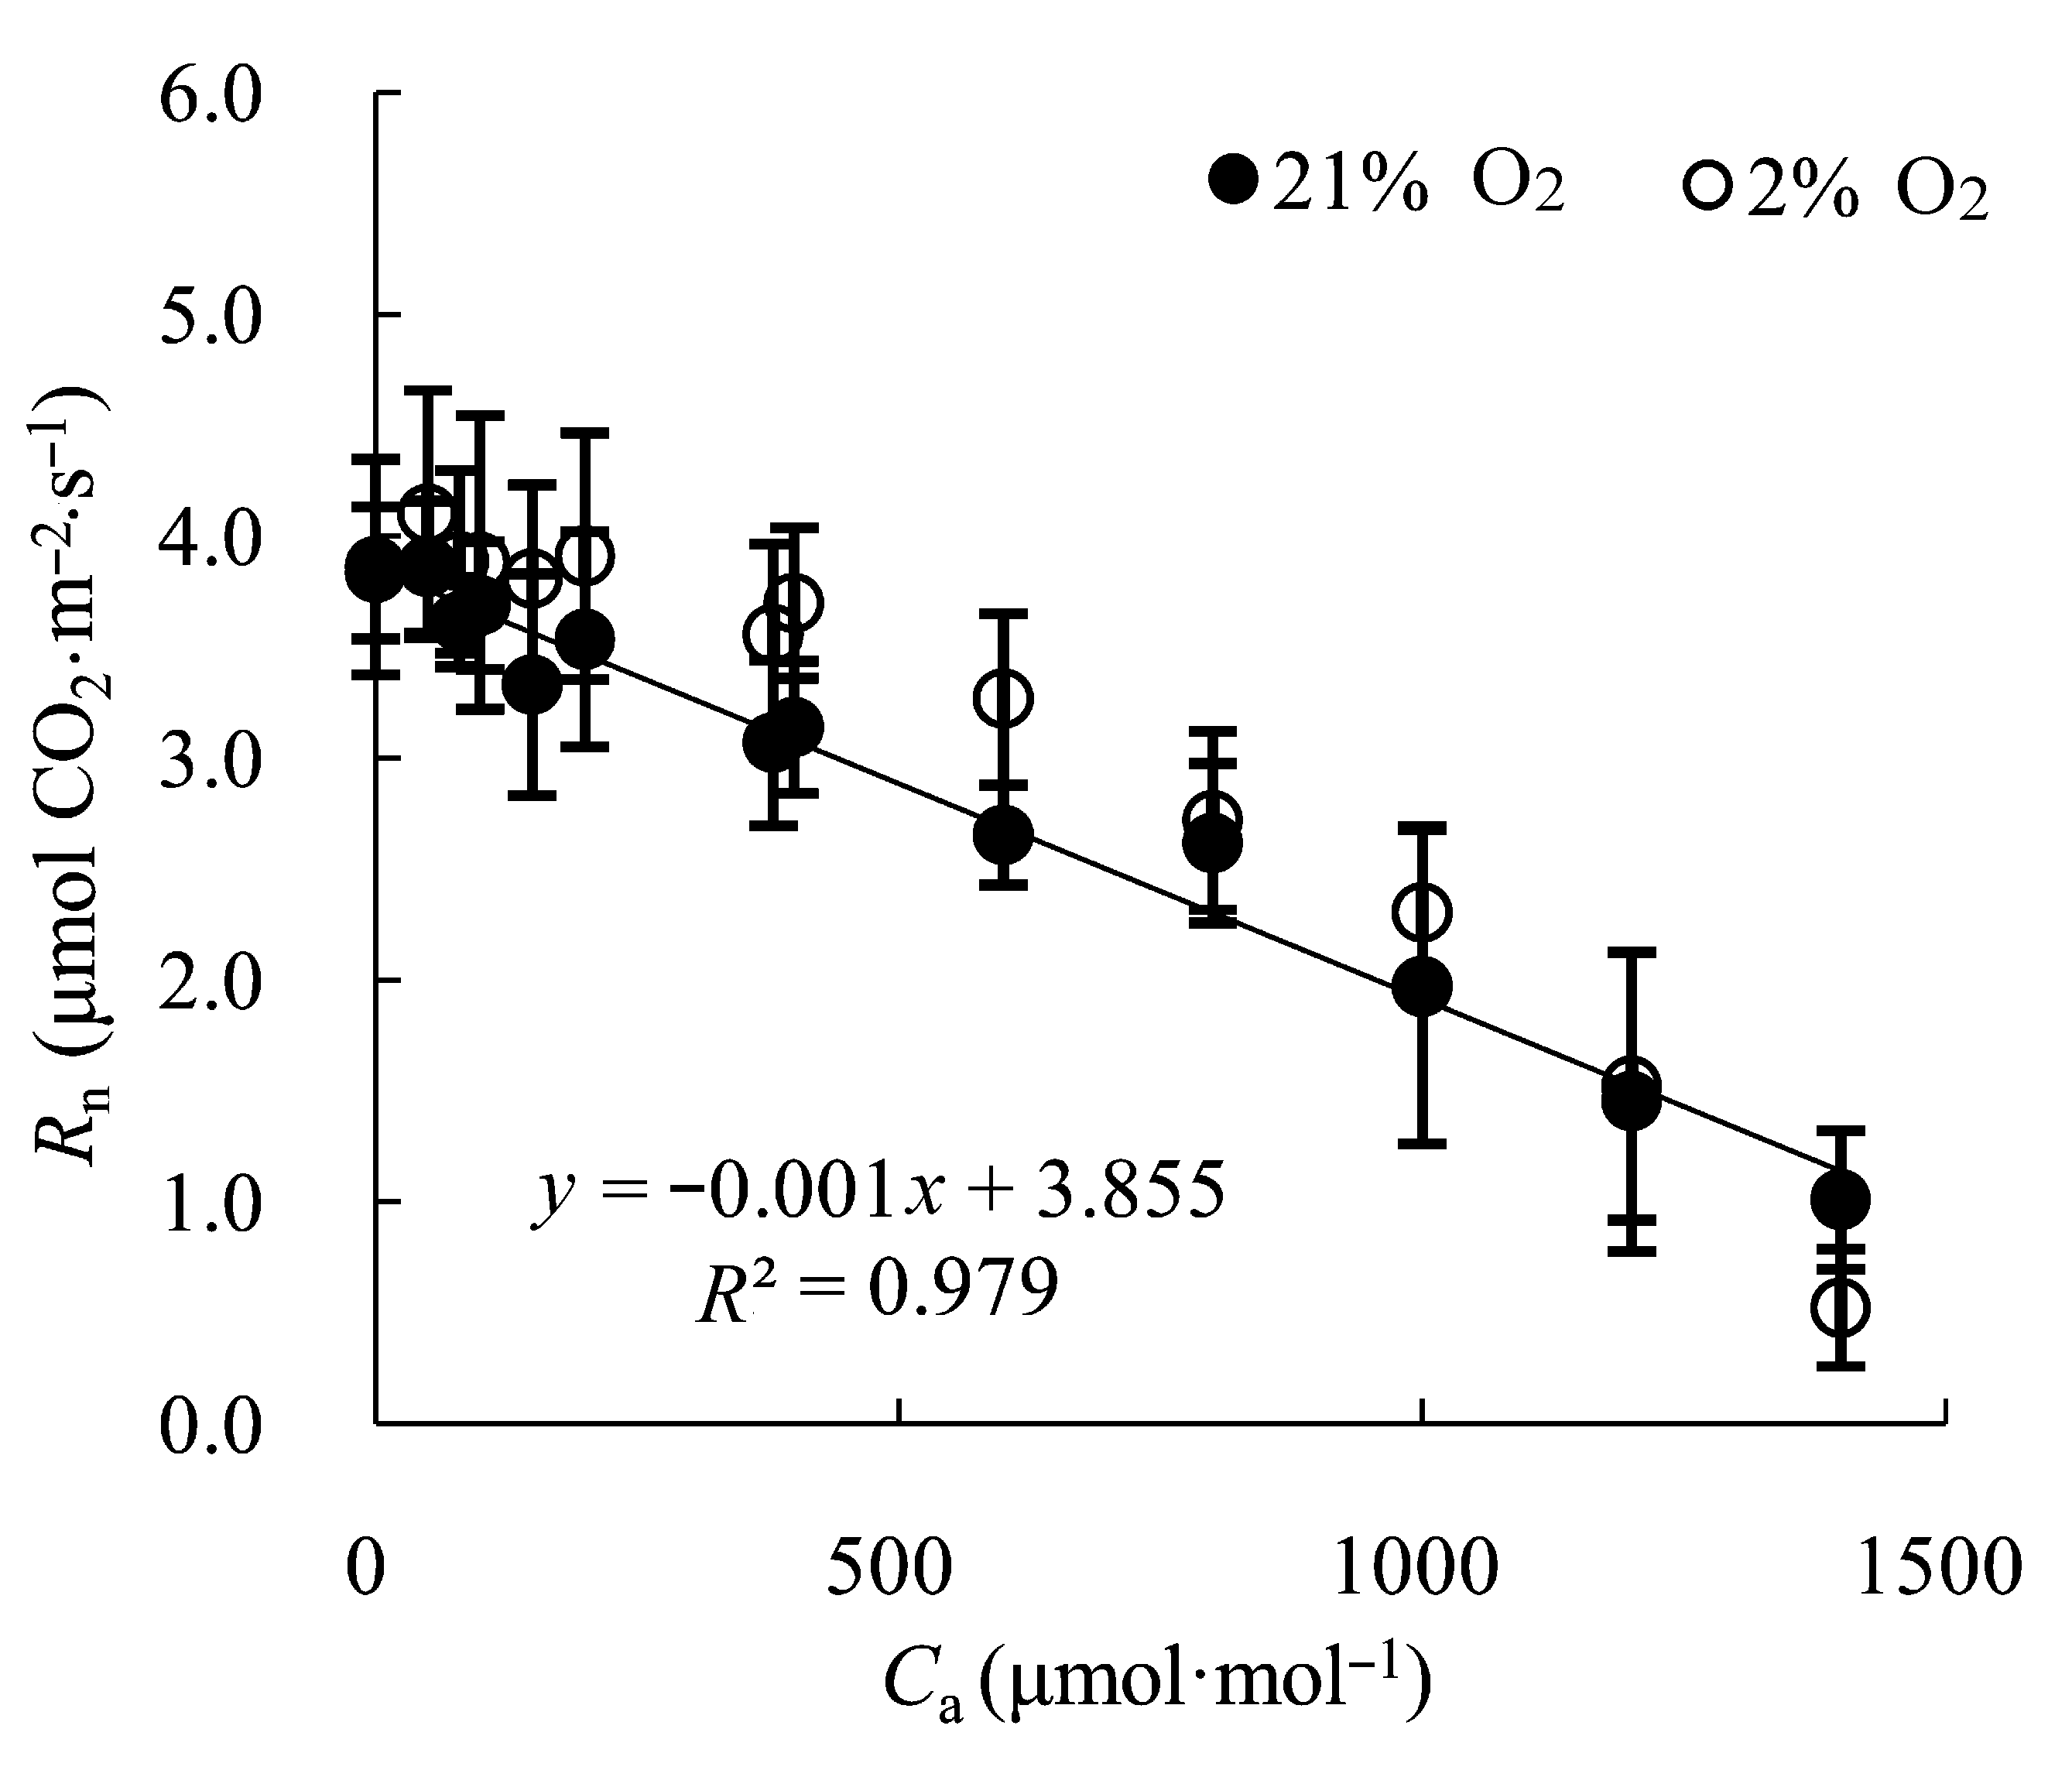
图3 21%和2%的O2浓度下小麦旗叶暗呼吸(Rn)对CO2浓度(Ca)的响应(平均值±标准偏差)。
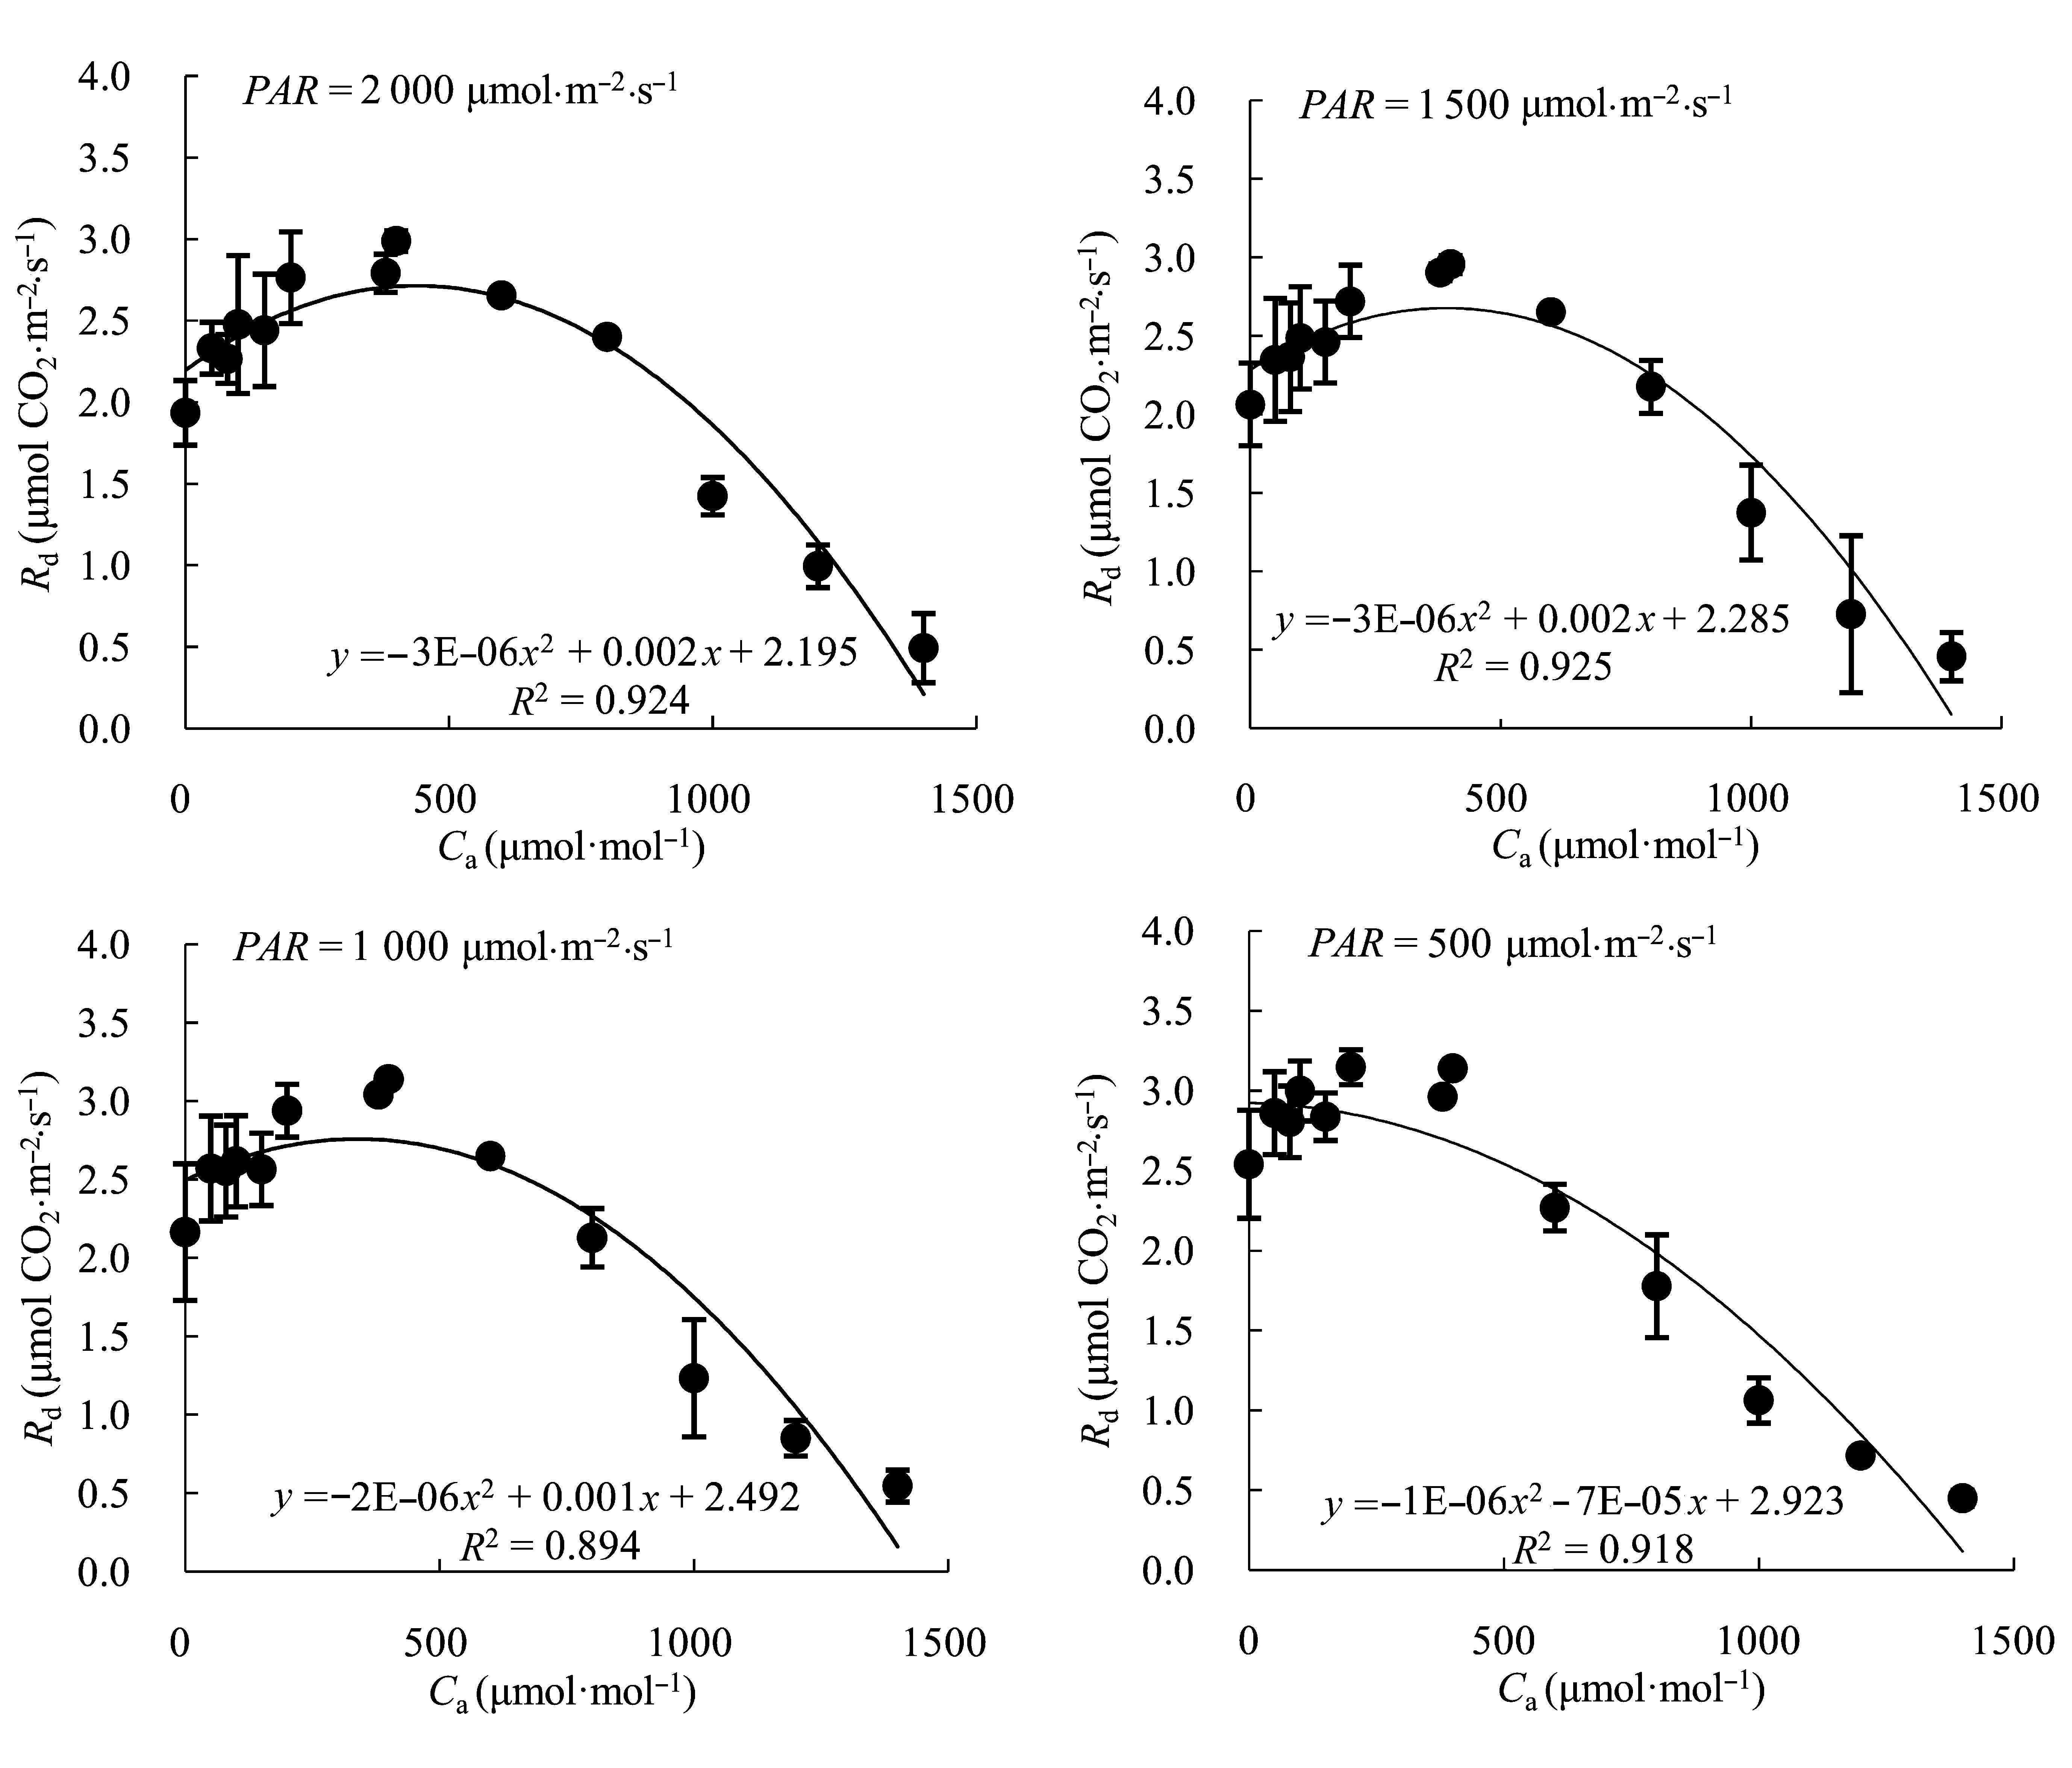
图4 不同CO2浓度(Ca)下小麦旗叶的光下暗呼吸速率(Rd) (平均值±标准偏差)。
Fig. 4 Mitochondrial respiration under light (Rd) in response to different CO2 concentration (Ca) in flag leaves of wheat (mean ± SD).
| PAR (μmol·m-2·s-1) | ||||
|---|---|---|---|---|
| 2 000 | 1 500 | 1 000 | 500 | |
| 光下呼吸速率 Pn0-21% | 6.843 ± 0.341a | 6.343 ± 0.762a | 6.536 ± 0.408a | 5.729 ± 0.499a |
| 光下暗呼吸速率 Pn0-2% | 1.934 ± 0.190c | 2.064 ± 0.091c | 2.164 ± 0.112c | 2.539 ± 0.285c |
| 表观光呼吸 Rpa0 | 5.035 ± 0.194b | 4.222 ± 0.832b | 4.330 ± 0.394b | 3.263 ± 0.544b |
表1 不同光合有效辐射(PAR)下的小麦旗叶在CO2浓度为0时表观光合速率的测量值(μmol CO2·m-2·s-1) (平均值±标准偏差)
Table 1 Measured values of photosynthetic rate in flag leaves of wheat at different photosynthetically active radiation (PAR) when CO2 concentration was 0 (μmol CO2·m-2·s-1) (mean ± SD)
| PAR (μmol·m-2·s-1) | ||||
|---|---|---|---|---|
| 2 000 | 1 500 | 1 000 | 500 | |
| 光下呼吸速率 Pn0-21% | 6.843 ± 0.341a | 6.343 ± 0.762a | 6.536 ± 0.408a | 5.729 ± 0.499a |
| 光下暗呼吸速率 Pn0-2% | 1.934 ± 0.190c | 2.064 ± 0.091c | 2.164 ± 0.112c | 2.539 ± 0.285c |
| 表观光呼吸 Rpa0 | 5.035 ± 0.194b | 4.222 ± 0.832b | 4.330 ± 0.394b | 3.263 ± 0.544b |
| PAR (μmol·m-2·s-1) | |||||
|---|---|---|---|---|---|
| 2 000 | 1 500 | 1 000 | 500 | ||
| A-Ci | A | 21.667 ± 0.577*# | 21.857 ± 0.378*# | 21.750 ± 0.500*# | 20.850 ± 1.226*# |
| B | 17.924 ± 1.250*# | 16.947 ± 0.908*# | 15.754 ± 1.200*# | 12.780 ± 0.905*# | |
| C | 14.809 ± 0.279*# | 13.745 ± 1.117*# | 13.412 ± 0.744*# | 11.655 ± 1.154*# | |
| A-Ca | A | 21.667 ± 0.577*# | 21.857 ± 0.378*# | 21.750 ± 0.500*# | 20.850 ± 1.226*# |
| B | 8.745 ± 1.340*# | 8.335 ± 0.695*# | 8.769 ± 0.931*# | 7.245 ± 0.589*# | |
| C | 7.743 ± 0.556*# | 6.907 ± 0.528* | 7.579 ± 0.570*# | 6.491 ± 0.616*# | |
表2 不同光合有效辐射(PAR)下小麦旗叶的光下(暗)呼吸速率拟合值(21%的O2) (平均值±标准偏差)
Table 2 Fitted values of mitochondrial respiration in flag leaves of wheat under light at different photosynthetically active radiation (PAR) and 21% O2 (mean ± SD)
| PAR (μmol·m-2·s-1) | |||||
|---|---|---|---|---|---|
| 2 000 | 1 500 | 1 000 | 500 | ||
| A-Ci | A | 21.667 ± 0.577*# | 21.857 ± 0.378*# | 21.750 ± 0.500*# | 20.850 ± 1.226*# |
| B | 17.924 ± 1.250*# | 16.947 ± 0.908*# | 15.754 ± 1.200*# | 12.780 ± 0.905*# | |
| C | 14.809 ± 0.279*# | 13.745 ± 1.117*# | 13.412 ± 0.744*# | 11.655 ± 1.154*# | |
| A-Ca | A | 21.667 ± 0.577*# | 21.857 ± 0.378*# | 21.750 ± 0.500*# | 20.850 ± 1.226*# |
| B | 8.745 ± 1.340*# | 8.335 ± 0.695*# | 8.769 ± 0.931*# | 7.245 ± 0.589*# | |
| C | 7.743 ± 0.556*# | 6.907 ± 0.528* | 7.579 ± 0.570*# | 6.491 ± 0.616*# | |
| PAR (μmol·m-2·s-1) | |||||
|---|---|---|---|---|---|
| 2 000 | 1 500 | 1 000 | 500 | ||
| A-Ci | A | 12.067 ± 0.808* | 12.286 ± 0.445* | 12.400 ± 0.783* | 11.350 ± 0.823* |
| B | 8.293 ± 1.500* | 9.245 ± 1.093* | 9.320 ± 0.843* | 9.416 ± 1.475* | |
| C | 6.099 ± 0.730* | 6.507 ± 0.913* | 6.609 ± 0.515* | 7.264 ± 0.561* | |
| A-Ca | A | 21.667 ± 0.577* | 21.857 ± 0.378* | 21.750 ± 0.500* | 20.850 ± 1.226* |
| B | 4.520 ± 1.118* | 5.022 ± 1.306* | 5.345 ± 0.828* | 4.919 ± 0.244* | |
| C | 2.766 ± 0.564* | 3.323 ± 0.977* | 3.326 ± 0.554* | 3.798 ± 0.251* | |
表3 不同光合有效辐射(PAR)下小麦旗叶的光下暗呼吸速率拟合值(2%的O2) (平均值±标准偏差)
Table 3 Fitted values of mitochondrial respiration in flag leaves of wheat under light at different photosynthetically active radiation (PAR) and 2% O2 (mean ± SD)
| PAR (μmol·m-2·s-1) | |||||
|---|---|---|---|---|---|
| 2 000 | 1 500 | 1 000 | 500 | ||
| A-Ci | A | 12.067 ± 0.808* | 12.286 ± 0.445* | 12.400 ± 0.783* | 11.350 ± 0.823* |
| B | 8.293 ± 1.500* | 9.245 ± 1.093* | 9.320 ± 0.843* | 9.416 ± 1.475* | |
| C | 6.099 ± 0.730* | 6.507 ± 0.913* | 6.609 ± 0.515* | 7.264 ± 0.561* | |
| A-Ca | A | 21.667 ± 0.577* | 21.857 ± 0.378* | 21.750 ± 0.500* | 20.850 ± 1.226* |
| B | 4.520 ± 1.118* | 5.022 ± 1.306* | 5.345 ± 0.828* | 4.919 ± 0.244* | |
| C | 2.766 ± 0.564* | 3.323 ± 0.977* | 3.326 ± 0.554* | 3.798 ± 0.251* | |
| 1 | Bernacchi CJ, Singsaas EL, Pimentel C, Portis AR, Long SP (2001). Improved temperature response functions for models of Rubisco-limited photosynthesis. Plant, Cell & Environment, 24, 253-259. |
| 2 | Berry JA, Downton WJ (1982). Environmental regulation of photosynthesis. In: Govindjee ed. Photosynthesis. Academic Press, New York. |
| 3 | Cai SQ, Xu DQ (2000). Relationship between the CO2 compensation point and photorespiration in soybean leaves. Acta Phytophysiol Sinica, 26, 545-550.(in Chinese with English abstract) |
| [蔡时青, 许大全 (2000). 大豆叶片CO2补偿点和光呼吸的关系. 植物生理学报, 26, 545-550.] | |
| 4 | Ethier GJ, Livingston NJ (2004). On the need to incorporate sensitivity to CO2 transfer conductance into the Farquhar- von Caemmerer-Berry leaf photosynthesis model. Plant, Cell & Environment, 27, 137-153. |
| 5 | Farquhar GD, Caemmerers S, Berry JA (1980). A biochemical model of photosynthetic CO2 assimilation in leaves of C3 species. Planta, 149, 78-90. |
| 6 | Guan XQ, Zhao SJ, Li DQ, Zhao XJ (2003). Photorespiration of C3 plant and its physiological function. Acta Botanica Boreali-Occidentalia Sinica, 23, 1849-1854.(in Chinese with English abstract) |
| [管雪强, 赵世杰, 李德全, 赵新节 (2003). C3植物光呼吸及其生理功能. 西北植物学报,23, 1849-1854.] | |
| 7 |
Harley PC, Sharkey TD (1991). An improved model of C3 photosynthesis at high CO2: reversed O2 sensitivity explained by lack of glycerate reentry into the chloroplast. Photosynthesis Research, 27, 169-178.
DOI URL PMID |
| 8 | Harley PC, Thomas RB, Reynolds JF, Strain BR (1992). Modelling photosynthesis of cotton grown in elevated CO2 . Plant,Cell & Environment, 15, 271-282. |
| 9 | Kang HJ, Tao YL, Quan W, Ouyang Z (2013). Response of photorespiration of wheat flag leaf to light intensities and CO2 concentrations. Journal of Triticeae Crops, 33, 1252-1257.(in Chinese with English abstract) |
| [康华靖, 陶月良, 权伟, 王伟, 欧阳竹 (2013). 小麦旗叶光呼吸对光强和CO2浓度的响应. 麦类作物学报,33, 1252-1257.] | |
| 10 |
Long SP, Bernacchi CJ (2003). Gas exchange measurements, what can they tell us about the underlying limitations to photosynthesis? Procedures and sources of error. Journal of Experimental Botany, 54, 2393-2401.
DOI URL PMID |
| 11 | Loreto F, Delfine S, Di-marco G (1999). Estimation of photorespiratory carbon dioxide recycling during photosynthesis. Australian Journal of Plant Physiology, 26, 733-736. |
| 12 | Loreto F, Velikova VB, Marco GDA (2001). Respiration in the light measured by 12CO2 emission in 13CO2 atmosphere in maize leaves. Australian Journal of Plant Physiology, 28, 1103-1108. |
| 13 | Peng CL, Lin ZF, Sun ZJ, Lin GZ, Chen YZ (1998). Response of rice photosynthesis to CO2 enrichment. Acta Photophysiologica Sinica, 24, 272-278.(in Chinese with English abstract) |
| [彭长连, 林植芳, 孙梓健, 林桂珠, 陈贻竹 (1998). 水稻光合作用对加富CO2的响应. 植物生理学报, 24, 272-278.] | |
| 14 |
von Caemmerer S, Farquhar GD (1981). Some relationships between the biochemistry of photosynthesis and the gas exchange of leaves. Planta, 153, 376-387.
URL PMID |
| 15 | Ye ZP (2010). A review on modeling of responses of photosynthesis to light and CO2. Chinese Journal of Plant Ecology, 34, 727-740.(in Chinese with English abstract) |
| [叶子飘 (2010). 光合作用对光和CO2响应模型的研究进展. 植物生态学报, 34, 727-740.] | |
| 16 | Ye ZP, Yu Q (2009). A comparison of response curves of winter wheat photosynthesis to flag leaf intercellular and air CO2 concentrations. Chinese Journal of Ecology, 28, 2233-2238.(in Chinese with English abstract) |
| [叶子飘, 于强 (2009). 光合作用对胞间和大气CO2响应曲线的比较. 生态学杂志, 28, 2233-2238.] | |
| 17 |
Yin XY, Sun ZP, Struik PC, Gu JF (2011). Evaluating a new method to estimate the rate of leaf respiration in the light by analysis of combined gas exchange and chlorophyll fluorescence measurements. Journal of Experimental Botany, 62, 3489-3499.
DOI URL PMID |
| [1] | 祖姆热提·于苏甫江 董正武 成鹏 叶茂 刘隋赟昊 李生宇 赵晓英. 多枝柽柳水分利用策略对沙堆堆积过程的响应[J]. 植物生态学报, 2024, 48(预发表): 0-0. |
| [2] | 李伟斌, 张红霞, 张玉书, 陈妮娜. 昼夜不对称增温对长白山阔叶红松林碳汇能力的影响[J]. 植物生态学报, 2023, 47(9): 1225-1233. |
| [3] | 李安艳, 黄先飞, 田源斌, 董继兴, 郑菲菲, 夏品华. 贵州草海草-藻型稳态转换过程中叶绿素a的变化及其影响因子[J]. 植物生态学报, 2023, 47(8): 1171-1181. |
| [4] | 钟姣, 姜超, 刘世荣, 龙文兴, 孙建新. 海南长臂猿食源植物的潜在物种丰富度分布格局[J]. 植物生态学报, 2023, 47(4): 491-505. |
| [5] | 苏启陶, 杜志喧, 周兵, 廖永辉, 王呈呈, 肖宜安. 牯岭凤仙花及其传粉昆虫在中国的潜在分布区域分析[J]. 植物生态学报, 2022, 46(7): 785-796. |
| [6] | 陈奕竹, 郎伟光, 陈效逑. 中国北方树木秋季物候的过程模拟及其区域分异归因[J]. 植物生态学报, 2022, 46(7): 753-765. |
| [7] | 熊博文, 李桐, 黄樱, 鄢春华, 邱国玉. 不同参考温度取值对三温模型反演植被蒸腾精度的影响[J]. 植物生态学报, 2022, 46(4): 383-393. |
| [8] | 马艳泽, 杨熙来, 徐彦森, 冯兆忠. 四种常见树木叶片光合模型关键参数对臭氧浓度升高的响应[J]. 植物生态学报, 2022, 46(3): 321-329. |
| [9] | 原媛, 母艳梅, 邓钰洁, 李鑫豪, 姜晓燕, 高圣杰, 查天山, 贾昕. 植被覆盖度和物候变化对典型黑沙蒿灌丛生态系统总初级生产力的影响[J]. 植物生态学报, 2022, 46(2): 162-175. |
| [10] | 熊淑萍, 曹文博, 曹锐, 张志勇, 付新露, 徐赛俊, 潘虎强, 王小纯, 马新明. 水平结构配置对冬小麦冠层垂直结构、微环境及产量的影响[J]. 植物生态学报, 2022, 46(2): 188-196. |
| [11] | 李红琴, 张亚茹, 张法伟, 马文婧, 罗方林, 王春雨, 杨永胜, 张雷明, 李英年. 增强回归树模型在青藏高原高寒灌丛通量数据插补中的应用[J]. 植物生态学报, 2022, 46(12): 1437-1447. |
| [12] | 郑周涛, 张扬建. 1982-2018年青藏高原水分利用效率变化及归因分析[J]. 植物生态学报, 2022, 46(12): 1486-1496. |
| [13] | 王晶苑, 魏杰, 温学发. 土壤CO2通量梯度观测技术和方法的理论、假设与应用进展[J]. 植物生态学报, 2022, 46(12): 1523-1536. |
| [14] | 高璐鑫, 兰天元, 赵志霞, 邓舒雨, 熊高明, 谢宗强, 申国珍. 中国中亚热带北部灌丛群落植物空间周转及其驱动因素[J]. 植物生态学报, 2022, 46(11): 1411-1421. |
| [15] | 刘超, 李平, 武运涛, 潘胜难, 贾舟, 刘玲莉. 一种基于数码相机图像和群落冠层结构调查的草地地上生物量估算方法[J]. 植物生态学报, 2022, 46(10): 1280-1288. |
| 阅读次数 | ||||||
|
全文 |
|
|||||
|
摘要 |
|
|||||
Copyright © 2022 版权所有 《植物生态学报》编辑部
地址: 北京香山南辛村20号, 邮编: 100093
Tel.: 010-62836134, 62836138; Fax: 010-82599431; E-mail: apes@ibcas.ac.cn, cjpe@ibcas.ac.cn
备案号: 京ICP备16067583号-19