基于异速生长理论的准噶尔盆地荒漠灌丛形态研究
Morphological investigation of desert shrubs of China’s Junggar Basin based on allometric theory
基于异速生长理论的准噶尔盆地荒漠灌丛形态研究 |
| 李嵩, 郑新军, 唐立松, 李彦 |
|
Morphological investigation of desert shrubs of China’s Junggar Basin based on allometric theory |
| LI Song, ZHENG Xin-Jun, TANG Li-Song, LI Yan |
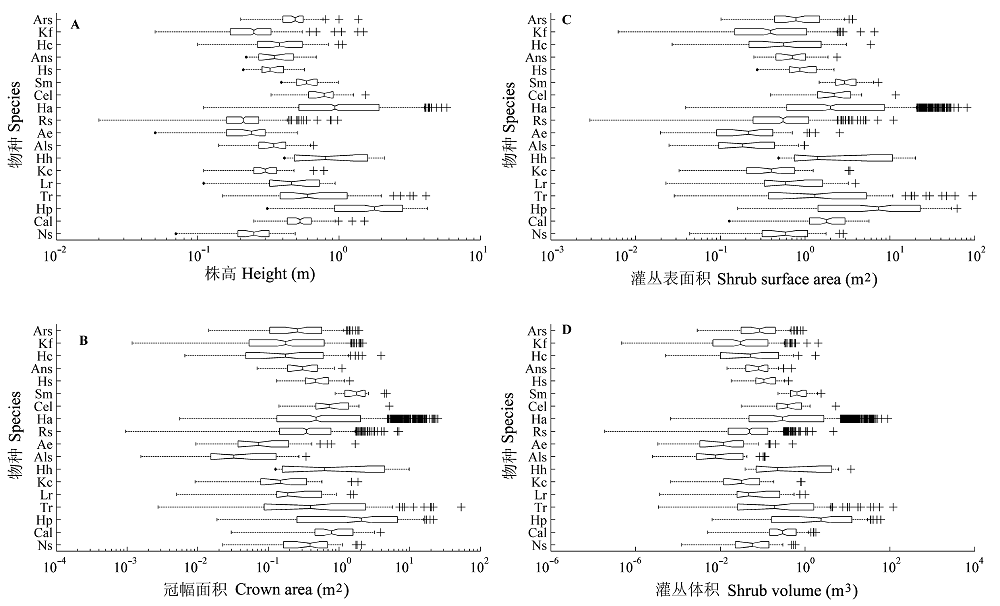
| 图1 18种灌木的株高(A)、冠幅面积(B)、灌丛表面积(C)和体积(D)的分布。箱型图左、右的竖线为样本的25%和75%分位数, 箱型顶端和底部的差值为四分位极值; 箱型中间的竖线为样本中值, 若线不在箱型中央, 则表明存在偏度; 箱型向左或向右延伸的直线称为“触须”, 若没有统计异常值, 则样本最大值为右触须顶部, 样本最小值为左触须的底部。若样本中存在距离箱型左侧或右侧大于1.5倍内四分位极值的数值, 则认为样本中有统计异常值(如图用“+”表示)。若触须外无数据, 则底部触须有一点; 箱型上下两侧的V型槽口对应样本中值95%置信区间。物种代号见 |
| Fig. 1 Distribution of 18 shrubs’ height (A), crown area (B), shrub surface area (C) and volume (D). On each box, the reft and right edges of the box are the 25th and 75th percentiles, the difference of the top and bottom is quartile extreme; the central mark is the median, if the line doesn’t lie the central of the box, it shows skewness; box to the left or right extension of the line were known as “whisker”, if there were no statistical outliers, the maximum value of the sample should be the top of the right whiskers, and the sample minimum should be the bottom of the left whisker. It will be considered as statistical outliers in the samples if there are values more than 1.5 times of the quartile extreme from the left or right side of the box (see Figure with “+” indicates). A dot will be at the bottom of the tentacles if no data out of tentacles; the notch of both sides of the box corresponding to 95% confidence interval of the samples. Species code see |
|
|