光响应曲线的指数改进模型与常用模型比较
Comparison between modified exponential model and common models of light-response curve
光响应曲线的指数改进模型与常用模型比较 |
| 陈卫英, 陈真勇, 罗辅燕, 彭正松, 余懋群 |
|
Comparison between modified exponential model and common models of light-response curve |
| CHEN Wei-Ying, CHEN Zhen-Yong, LUO Fu-Yan, PENG Zheng-Song, YU Mao-Qun |
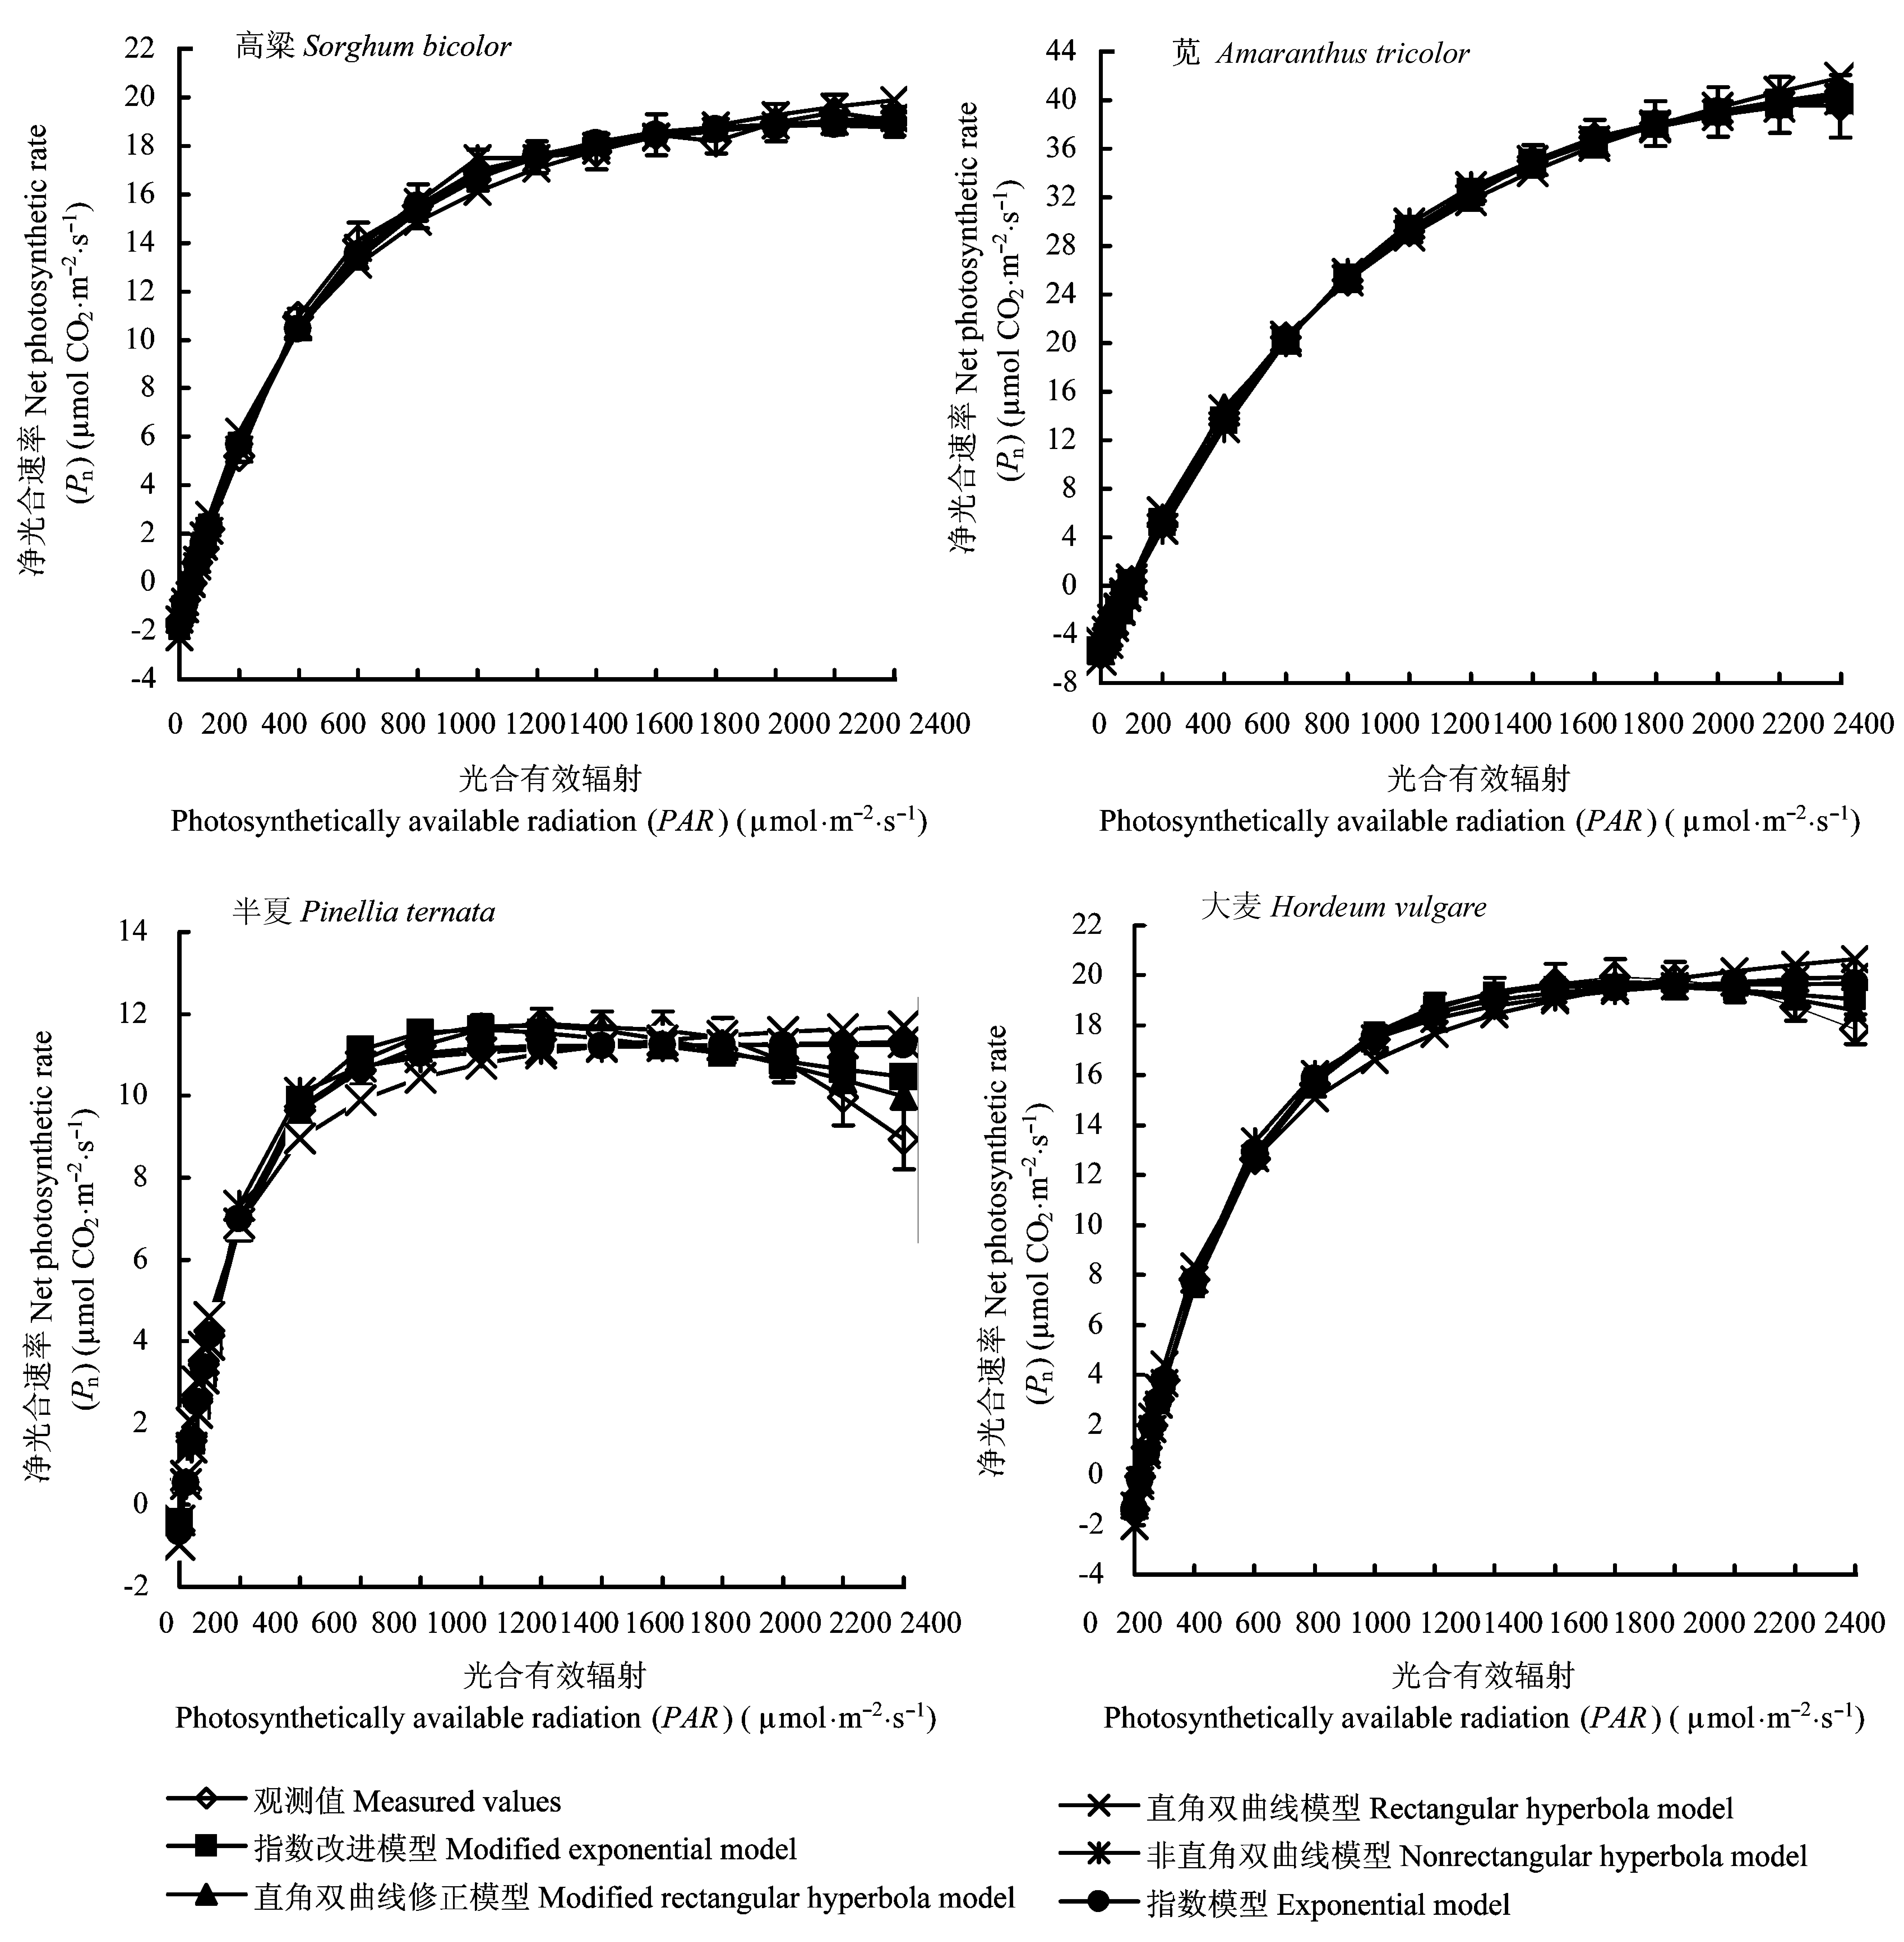
| 图1 高粱、苋、大麦和半夏的光响应曲线。模型中PAR为2400、1000、400、80、40、20 μmol·m-2·s-1时, 对应点为预测值, 其余各点为拟合值。 |
| Fig. 1 Light-response curves of Sorghum bicolor, Amaranthus tricolor, Hordeum vulgare and Pinellia ternata. PAR of 2400, 1000, 400, 80, 40, 20 μmol·m-2·s-1 are predicted values, and the rests are fitted values. |
|
|