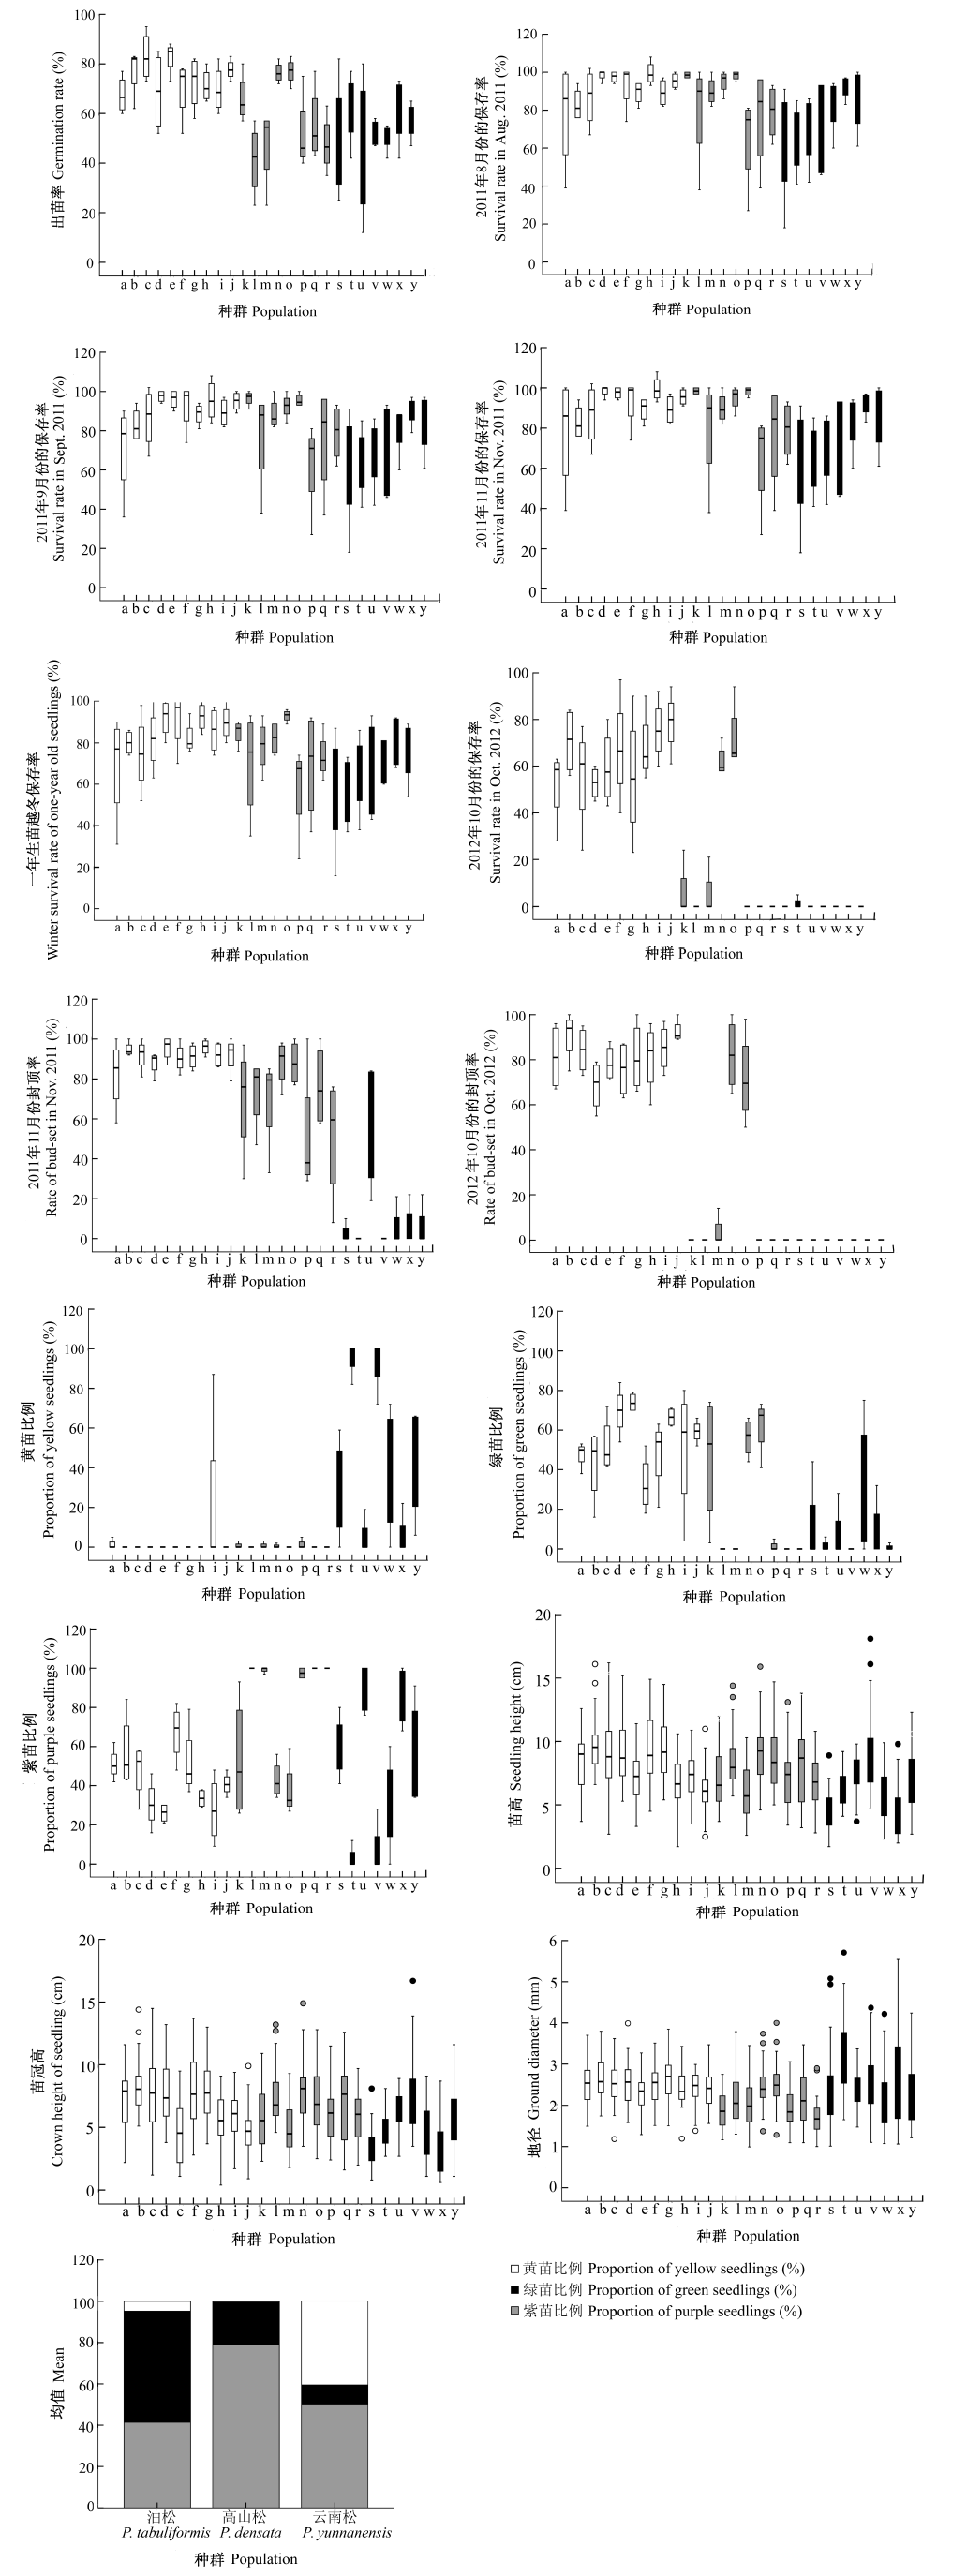
高山松及其亲本种群在油松生境下的苗期性状
Seedling performance of Pinus densata and its parental population in the habitat of P. tab- uliformis
图中矩形框是箱图的主体, 上中下3条线分别表示变量值的第75、50、25百分位数。箱图中间的纵向直线是触须线, 上截至横线和下截至横线分别表示变量值除奇异值和极值以外的最大值和最小值。箱图中的“°”代表奇异值, 表示其变量值超过了第75百分位数和第25百分位数差值的1.5倍。箱图中的“*”代表极值, 表示其变量值超过了第75百分位数与第25百分位数差值的3倍。种群同
The rectangle region is the main part of the box-plot in the above chart. The three lines of upper, middle and lower represent the 75th, 50th and 25th percentile value of the variables respectively. The vertical line in the middle of the box-plot is the tentacles line. The upper and lower ends of the line represent the maximum and minimum value of the variable except singular value and extreme value. “°” represents the singular value; it means variable value exceeds 1.5 times the difference between the 75th percentile and 25th percentile. “*” represents the extreme value, it means variable value exceeds 3 times the difference between the 75th percentile and 25th percentile. Populations see