),何永涛1,3,张宪洲1,3
),HE Yong-Tao1,3,ZHANG Xian-Zhou1,3
),何永涛1,3,张宪洲1,3
),HE Yong-Tao1,3,ZHANG Xian-Zhou1,3
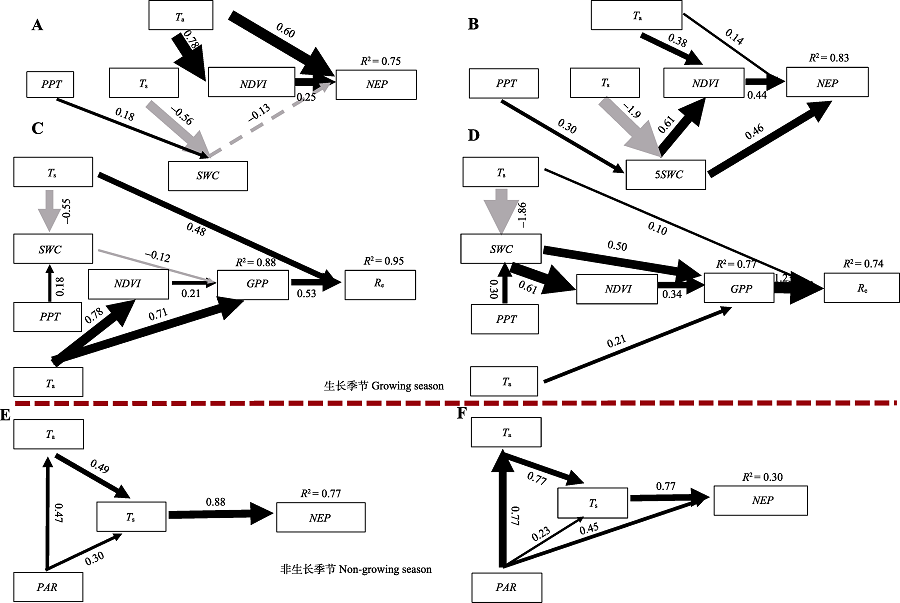
图5. 高寒灌丛草甸和草原化草甸2004-2008年16天平均生物和环境影响因子(气温, Ta, ℃; 5 cm土壤温度, Ts, ℃; 5 cm土壤含水量, SWC, m3·m-3; 降水量PPT, mm; 光合有效辐射, PAR, μmol·m-2·s-1; 归一化植被指数, NDVI)对CO2通量(净初级生产力, NEP, g C·m-2·d-1; 总初级生产力, GPP, g C·m-2·d-1; 生态系统呼吸, Re, g C·m-2·d-1)的结构方程模型图。A, C, E, 海北高寒灌丛草甸。B, D, F, 当雄高寒草原化草甸。A, B, C, D, 生长季节。E, F, 非生长季。黑色箭头是正相关, 灰色箭头是负相关, 实线箭头表示p ≤ 0.05, 虚线箭头表示p > 0.05, 箭头上的数字代表通径系数, 箭头的宽窄代表通径系数的大小。
Fig. 5. Path diagrams illustrating the effects of 16-day mean biotic and abiotic factors (air temperature, Ta, ℃; soil temperature at the depth of 5 cm, Ts, ℃; soil water content at the depth of 5 cm, SWC, m3·m-3; precipitation, PPT, mm; photosynthetically active radiation, PAR, μmol·m-2·s-1; normalized difference vegetation index, NDVI) on 16-day mean CO2 fluxes (net ecosystem productivity, NEP, g C·m-2·d-1, gross primary productivity, GPP, g C·m-2·d-1 and ecosystem respiration, Re, g C·m-2·d-1) during the growing season (A-D) and non-growing season (E, F) from 2004-2008 in the alpine shrub-meadow (A, C, E) and steppe-meadow (B, D, F). The grey solid arrows represent significantly negative correlation and the black solid arrows denote significantly positive correlation (p ≤ 0.05). The dashed arrows represent non-significantly correlation (p > 0.05). Data on the arrows are the standardized SEM coefficients. The thickness of the arrows reflects the magnitude of the standardized SEM coefficient.