),李臻3,辛智鸣3,刘明虎3,李艳丽1,2,4,郝玉光3
),LI Zhen3,XIN Zhi-Ming3,LIU Ming-Hu3,LI Yan-Li1,2,4,HAO Yu-Guang3
),李臻3,辛智鸣3,刘明虎3,李艳丽1,2,4,郝玉光3
),LI Zhen3,XIN Zhi-Ming3,LIU Ming-Hu3,LI Yan-Li1,2,4,HAO Yu-Guang3
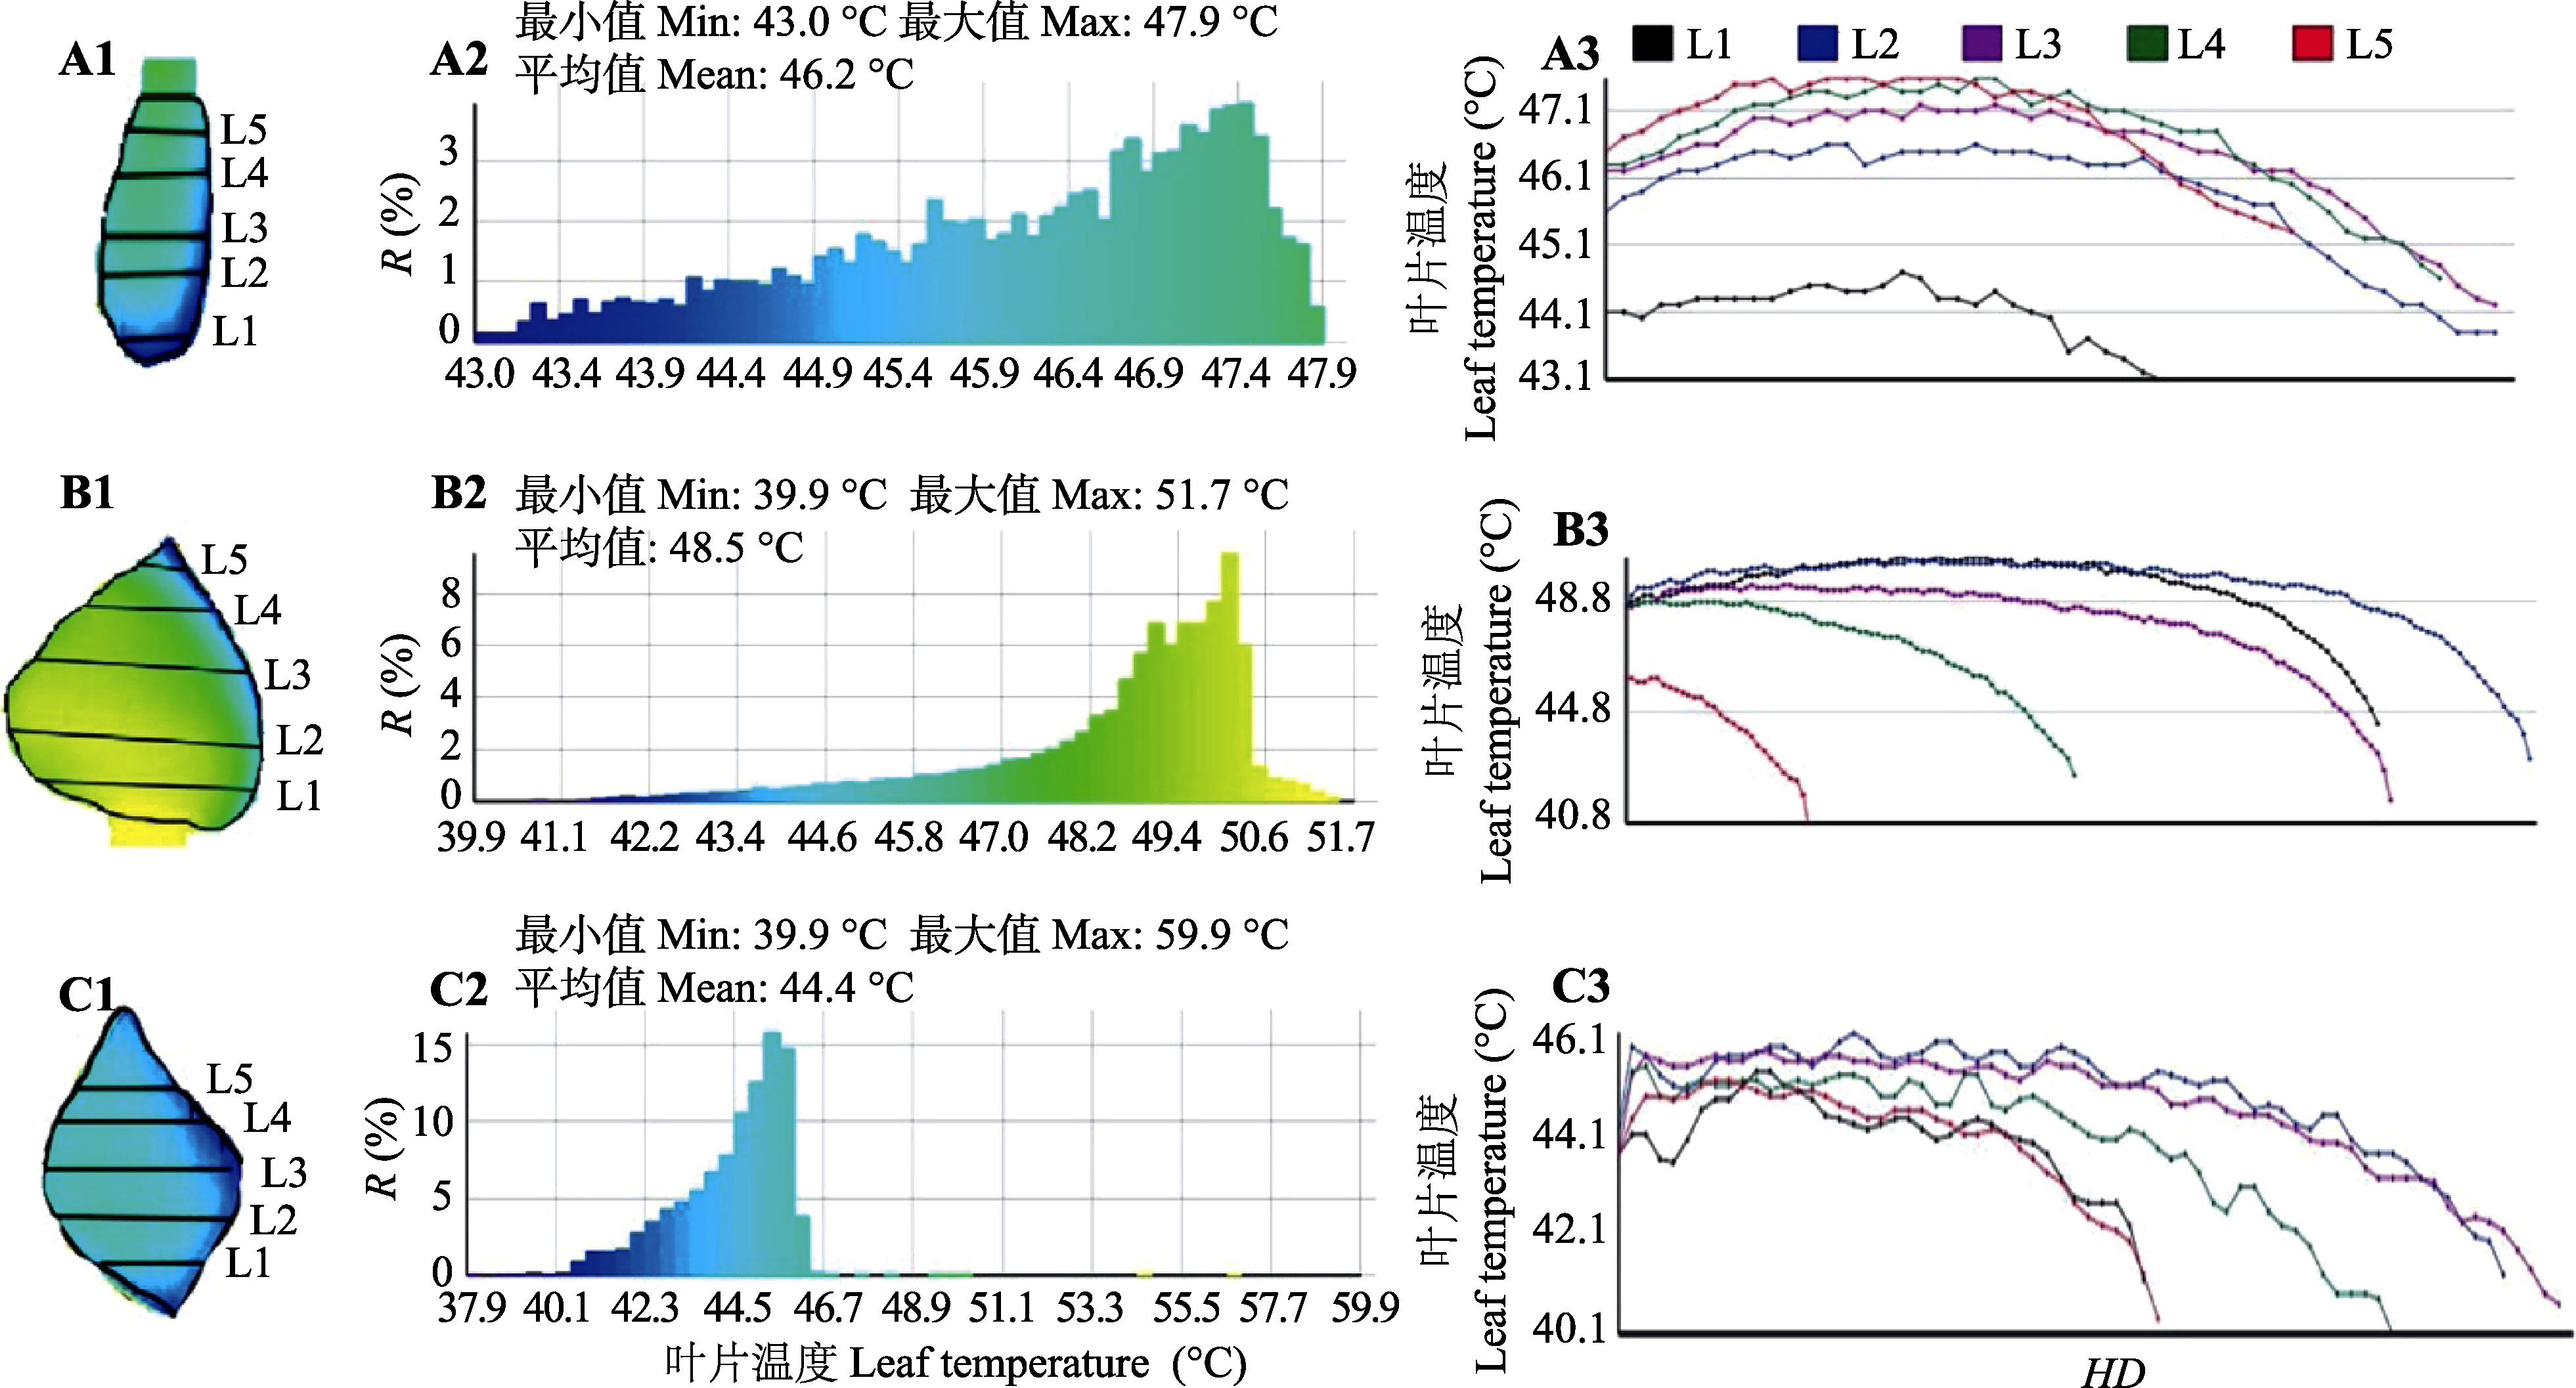
图6. 单叶表面温度分布特征。A, 模拟叶片, 面积1.80 cm2, 气温32.3 ℃, 辐射478.6 W·m-2, 风速< 0.3 m·s-1。B, 模拟叶片, 面积23.7 cm2, 气温31.9 ℃, 辐射483.1 W· m-2, 风速< 0.3 m·s-1。C, 真实叶片, 面积5.4 cm2, 气温33.8 ℃, 辐射1β152.9 W·m-2, 风速0.7 m·s-1, 蒸腾1.9 mmol· m-2·s-1。A1、B1、C1是叶片热图像。A2、B2、C2是叶片表面温度分布特征。A3、B3、C3是叶片表面温度剖面线。HD, 距离下风向叶片边缘的水平距离; R, 不同叶片温度的分布区面积占叶片总面积的比例。L1-L5, 叶片上的位置。
Fig. 6. Spatial changes in leaf temperature. A, Simulated leaf, leaf area 1.80 cm2, air temperature 32.3 °C, solar radiation 478.6 W·m-2, wind speed < 0.3 m·s-1. B, Simulated leaf, leaf area 23.7 cm2, air temperature 31.9 °C, solar radiation 483.1 W·m-2, wind speed < 0.3 m·s-1. C, Real leaf, leaf area 5.4 cm2, air temperature 33.8 °C, solar radiation 1β152.9 W·m-2, wind speed 0.7 m·s-1, transpiration rate 1.9 mmol·m-2·s-1. A1, B1, C1 were the thermal image of three leaf. A2, B2, C2 were temperature distributions on a leaf. A3, B3, C3 were temperature profile of a leaf. HD, horizontal distance from the leaf edge of the downwind direction; R, ratio of the distribution area of different leaf temperatures to the total leaf area. L1-L5, location on the leaves.