)
)
)
)
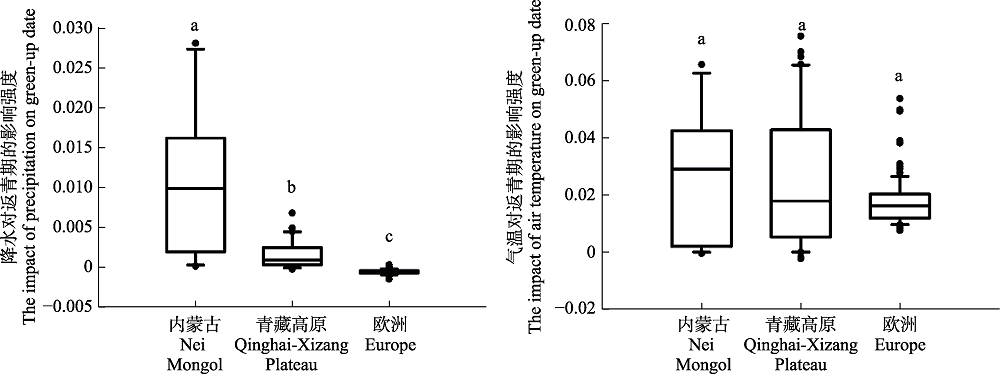
图2. 春季降水与气温对内蒙古草原、青藏高原草甸和欧洲地区木本植物返青期的影响。每一方框的上下横线分别表示样本统计量的四分位值即75%和25%的位点, 框内中央横线是中位数, 上下端短横线分别是统计量的90%和10%的位点, 圆点表示统计分布的特异最大或最小值。
Fig. 2. The changes in model coefficients of green-up date with spring precipitation and air temperature for the grasslands in Nei Mongol, meadows in Qinghai-Xizang Plateau, and woody plants in Europe. In these boxplots, the top and bottom values of the bars indicate the 25th and 75th percentiles, respectively; the black line within the box indicates the median; whiskers below and above the box indicate the 10th and 90th percentiles; and points indicate outliers. Letters on top of the whiskers are the results of an analysis of variance: different letters indicate statistically significant difference between the mean values (p < 0.01, t-test).