)
)
)
)
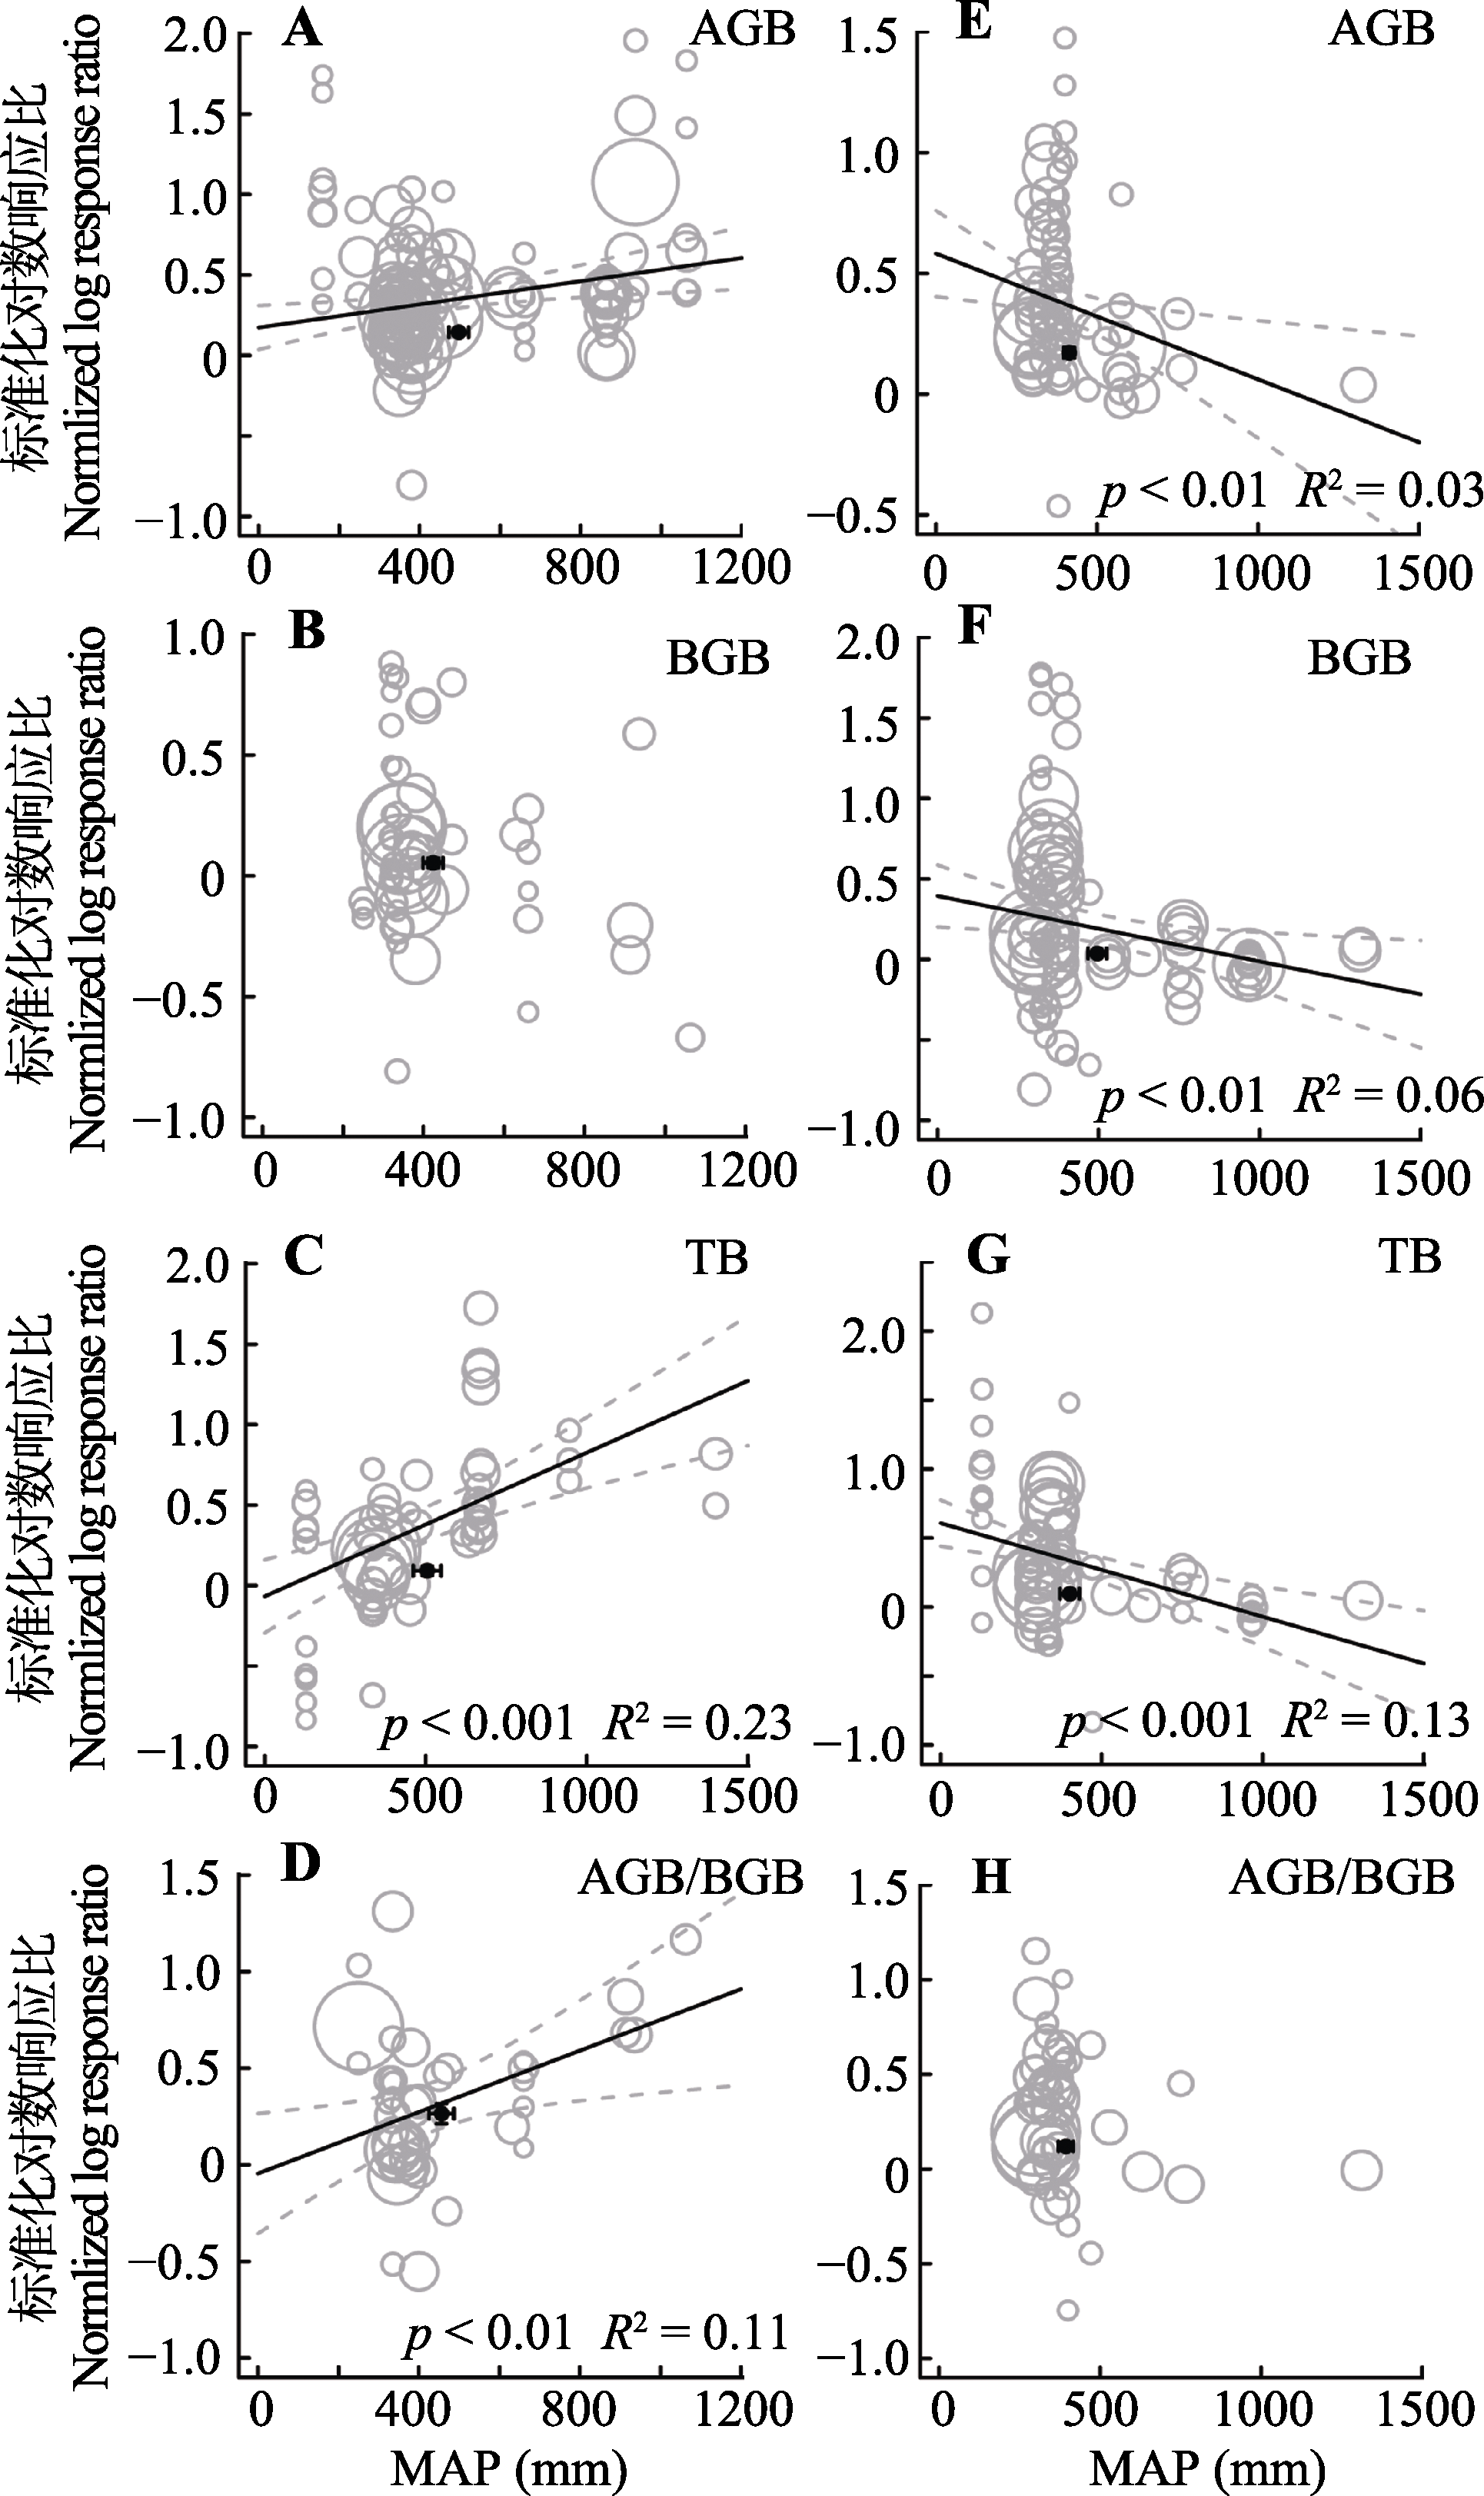
图5. 整合回归结果显示随着实验站点年降水量(MAP)增加, 地上生物量(AGB)(A, E)、地下生物量(BGB)(B, F)、总生物量(TB)(C, G)和地上地下生物量比(AGB/BGB)(D, H)在不同处理下的变化。A-D代表氮添加, E-H代表增雨处理, 圆圈的大小代表响应比在随机效应meta回归中的权重。圆圈越大, 权重越大, 贡献度越高。黑色圆点纵坐标为响应比平均值±标准误差, 横坐标为处理梯度平均值±标准误差。
Fig. 5. Bubble plots of the meta-regression results between the response of aboveground biomass (AGB)(A, E), belowground biomass (BGB)(B, F), total biomass(TB)(C, G) and the ratio of aboveground biomass to belowground biomass (AGB/BGB)(D, H) to the mean annual precipitation (MAP) in the study sites. A-D represent the N addition treatment; E-H represent the precipitation increasing treatment. The size of the bubble is the relative weight of the effect size (response ratio, RR) in the random-effects meta-regression. Larger bubbles indicate study outcomes that contribute a great overall weight in meta-regression. The y-direction error bars of the black dots represent the standard error of the means of response ratio; the x-direction error bars represent the standard error of the means of mean annual precipitation (MAP).