中国蔷薇科植物多样性格局及其资源植物保护现状
邹东廷1,王庆刚2,罗奥1,王志恒1,*( )
)
)
Species richness patterns and resource plant conservation assessments of Rosaceae in China
Dong-Ting ZOU1,Qing-Gang WANG2,Ao LUO1,Zhi-Heng WANG1,*()
)
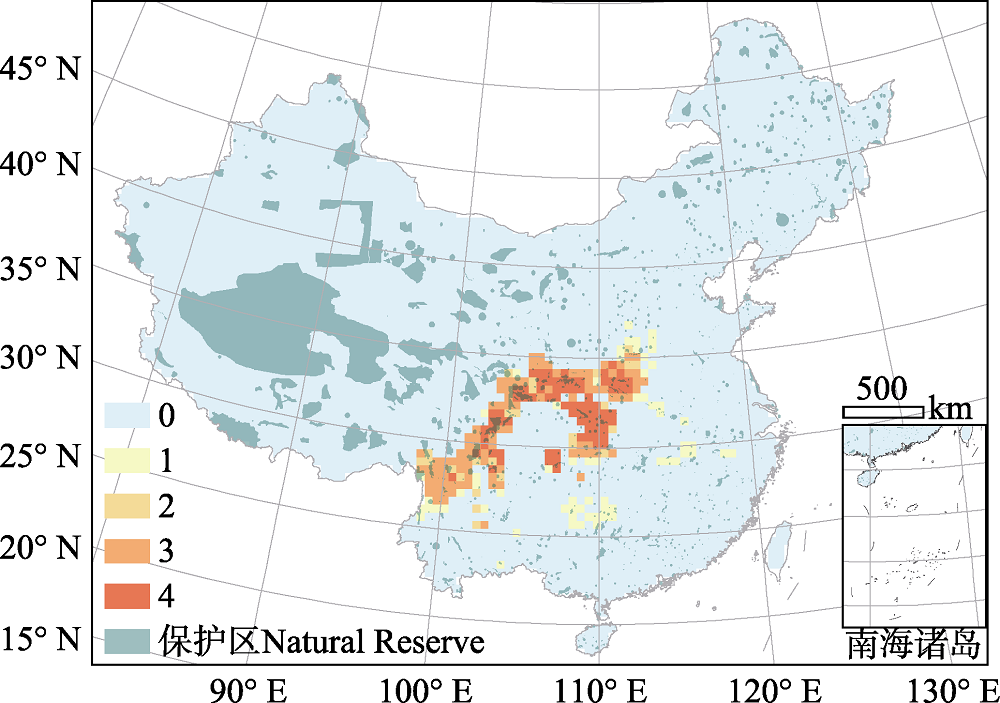
图3. 中国蔷薇科各资源类别(食用植物、园林绿化植物、药用植物、水果种质资源)物种多样性热点地区叠加图。橙红深浅表示该热点地区资源类别的种数, 详见材料与方法1.5。绿色表示我国国家级和省级自然保护区的分布。
Fig. 3. The overlaid map of species richness hotspots of the four resource groups (edible, ornamental, medicinal plants and fruit germplasm resources) of Rosaceae. The orange and red colors represent the number of resource groups sharing the grid cell as their hotspot (see Materials and Methods 1.5). Green color represents national and provincial natural reserves in China.