)
)
)
)
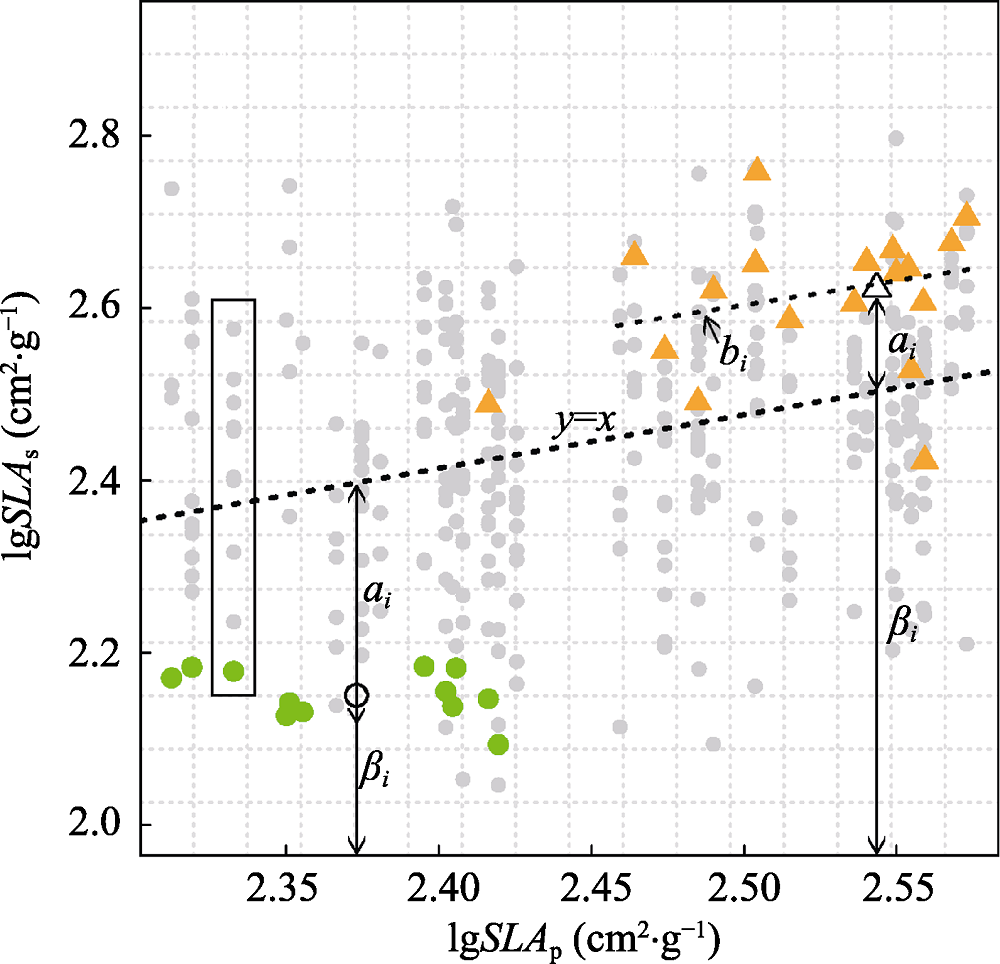
图1. 漓江河岸带植物阴香和牡荆物种平均比叶面积(lgSLAs)和群落平均比叶面积(lgSLAp)散点图。灰色圆点代表群落中的各个物种, 绿色实心圆点和橙色三角形分别表示阴香和牡荆, 在某pj处被矩形框起来的一列点表示群落j内所有共生物种。每个物种空心的图形点对应的横坐标代表该物种在样地中所处的平均位置(即该物种性状的β组分βi), 纵坐标是物种的平均性状值ti, 二者的差值即空心的图形点到y = x的距离(因为αi = ti - βi)就是物种功能性状的α组分αi, 代表群落中物种i平均比叶面积与共存物种平均比叶面积的差值, bi为物种i平均比叶面积(ti)对群落平均SLA (pj)的回归直线的斜率, 反映物种平均SLA沿群落平均性状梯度在种内的变化大小。
Fig. 1. The scatterplot between species mean specific leaf area (i.e. lgSLAs, cm2·g-1) vs. plot mean specific leaf area (i.e. lgSLAp, cm2·g-1) between Cinnamomum burmannii and Vitex negundo in the riparian zone of the Lijiang River. Each grey point represents a species in a specific plot; the green solid points and the orange solid triangles represent Cinnamomum burmannii and Vitex negundo respectively, and a column of grey points in a black rectangle represent all the species within community. For each species, the abscissa values of the large open point show the mean position of occupied plots (i.e., the beta component of the species trait value, βi), while the ordinate values of the solid symbols are their mean species trait value (ti). The difference between βi and ti, or the distance from the y = x line is αi (because αi = ti - βi ). Regression line shows abundance-weighted least squares regression of species trait values relative to plot mean trait values, with slope bi. bi is the slope of each species’ s regression line of species mean trait values (ti) relative to plot mean trait values (pj), it reflects the intraspecific variation of the species mean specific leaf area along a gradient defined by community-level mean trait values.