模拟降雨格局变化对亚热带地区两树种液流特征的影响
张振振1,*( ),杨轲嘉1,顾宇璐1,赵平2,欧阳磊2
),杨轲嘉1,顾宇璐1,赵平2,欧阳磊2
Effects of simulated changes in precipitation pattern on sap flux in two tree species in subtropical region
ZHANG Zhen-Zhen1,*(),YANG Ke-Jia1,GU Yu-Lu1,ZHAO Ping2,OUYANG Lei2
),YANG Ke-Jia1,GU Yu-Lu1,ZHAO Ping2,OUYANG Lei2
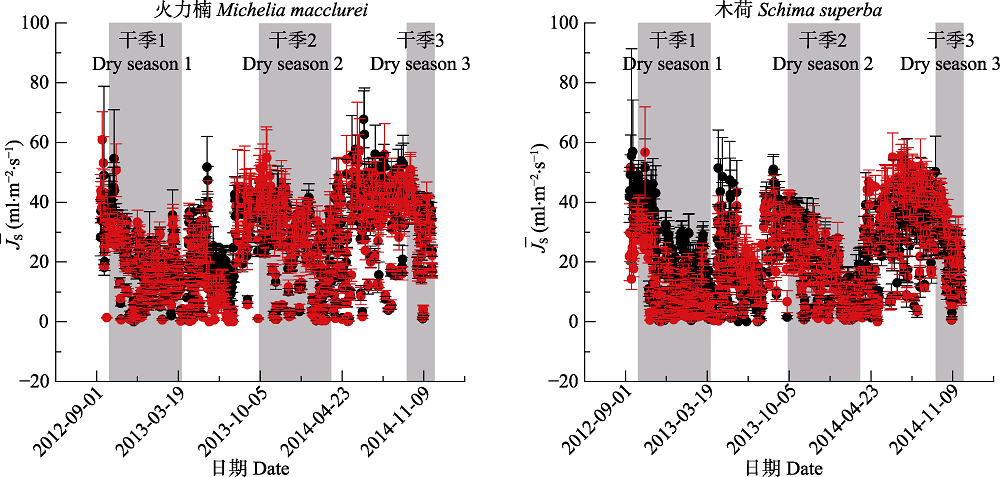
图3. 遮雨组(DD, 红色圆点)和对照组(AC, 黑色圆点)火力楠(n = 15)和木荷(n = 9)平均最大液流通量密度(¯JS)(平均值±标准偏差)的年际变化。图中阴影部分为隔除降雨处理期, 其他时间为增加降雨期。
Fig. 3. Annual variations of mean maximum sap flux density (¯JS)(mean ± SD) for trees in DD (red dot) and AC (black dot) groups in Michelia macclurei (n = 15) and Schima superba (n = 9). The shaded sections indicate the period of throughfall exclusion, and other sections the period of enhanced rainfall. AC, control; DD, drier dry season and wetter wet season.