),张志勇1,陈陆丹1,彭焱松1,汪旭2
),ZHANG Zhi-Yong1,CHEN Lu-Dan1,PENG Yan-Song1,WANG Xu2
),张志勇1,陈陆丹1,彭焱松1,汪旭2
),ZHANG Zhi-Yong1,CHEN Lu-Dan1,PENG Yan-Song1,WANG Xu2
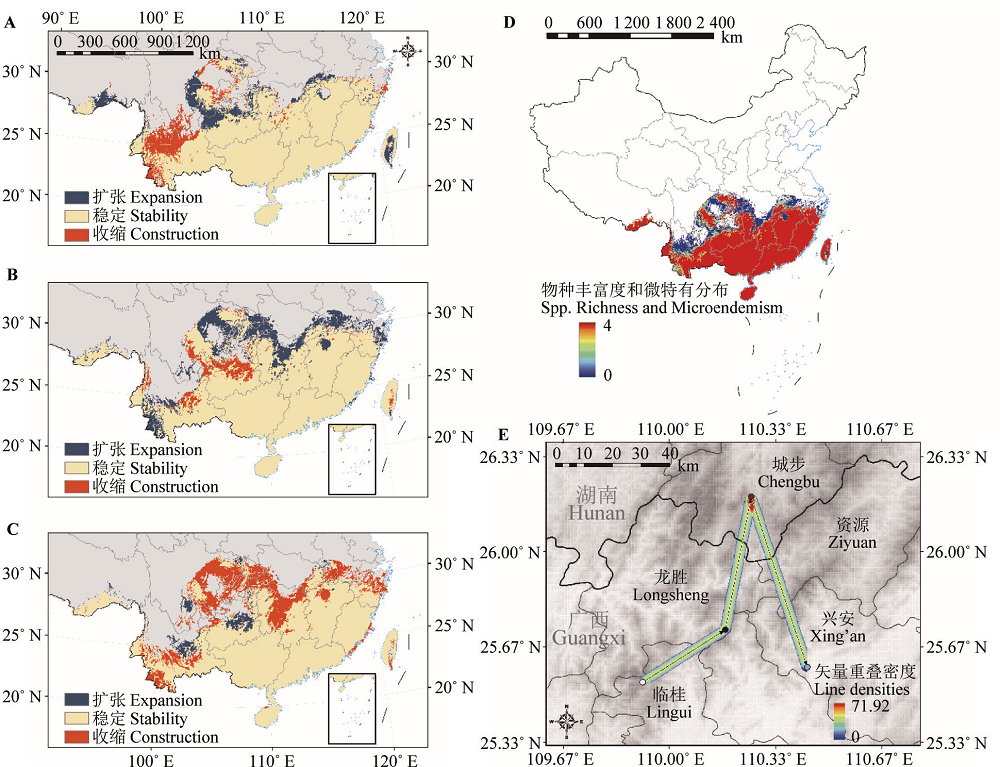
图2. 不同历史时期观光木的地理分布模式。A, 末次盛冰期到全新世中期的分布变化。B, 全新世中期到现代的分布变化。C, 现代到未来2070s的分布变化。D, 四个时期物种丰富度和加权特有分布的叠加分布图。E, 几何中心位移以及矢量重叠密度情况, 白色圆点表示末次盛冰期几何分布中心, 黑色圆点表示全新世中期几何分布中心, 红色圆点表示现代几何分布中心, 蓝色圆点表示未来几何分布中心, 黑色箭头表示几何分布中心变化。
Fig. 2. Major distribution changes of Tsoongiodendron odorum between different periods simulated by MaxEnt. A, Distribution changes from the Last Glacial Maximum to Mid-Holocene. B, Distribution changes from the Mid-Holocene to Current. C, Distribution changes from the current to the future. D, Summed distributions and micro-endemism during the four periods (Last Glacial Maximum, Mid-Holocene, current and future). E, Core range shifts and the line densities, white dots represent the Last Glacial Maximum centroid, black dots represent Mid-Holocene centroid, red dots represent current centroid, blue dots represent future centroid, black arrow represent centroid change.