基于随机森林模型的内陆干旱区植被指数变化与驱动力分析: 以北天山北坡中段为例
张文强1,2, 罗格平1,2,3,*( ), 郑宏伟1,2, 王浩4, HAMDI Rafiq1,5,6, 何惠丽1,2, 蔡鹏1,2, 陈春波1,2
), 郑宏伟1,2, 王浩4, HAMDI Rafiq1,5,6, 何惠丽1,2, 蔡鹏1,2, 陈春波1,2
Analysis of vegetation index changes and driving forces in inland arid areas based on random forest model: a case study of the middle part of northern slope of the north Tianshan Mountains
ZHANG Wen-Qiang1,2, LUO Ge-Ping1,2,3,*(), ZHENG Hong-Wei1,2, WANG Hao4, HAMDI Rafiq1,5,6, HE Hui-Li1,2, CAI Peng1,2, CHEN Chun-Bo1,2
), ZHENG Hong-Wei1,2, WANG Hao4, HAMDI Rafiq1,5,6, HE Hui-Li1,2, CAI Peng1,2, CHEN Chun-Bo1,2
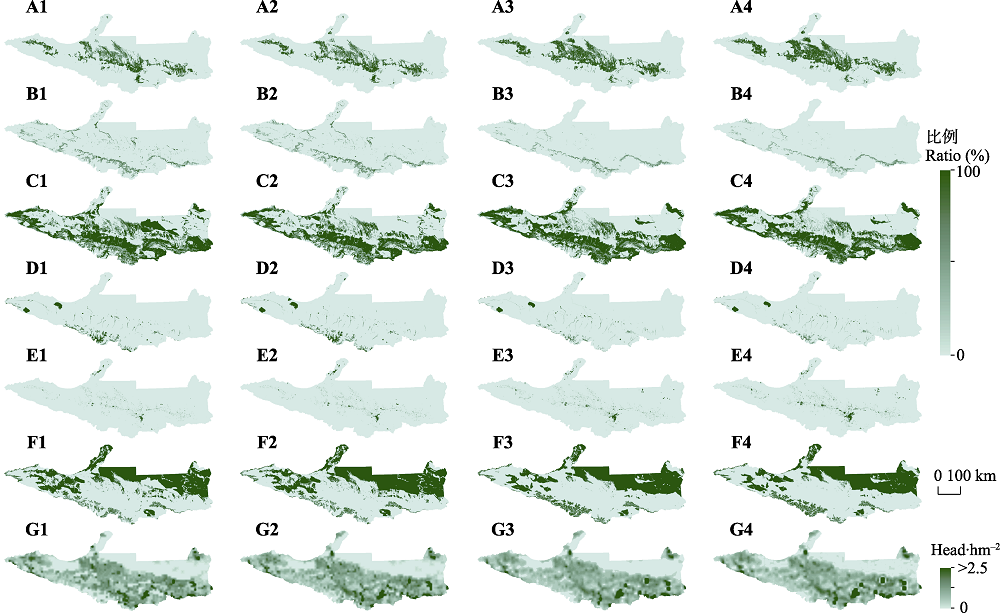
图4. 北天山北坡中段耕地(A)、林地(B)、草地(C)、水体(D)、城市(E)和荒漠(F)在每个像元中所占面积比例与放牧强度(G)在2000 (1)、2005 (2)、2010 (3)和2015年(4)的空间分布。放牧强度数据来源于国际粮农组织(FAO)。
Fig. 4. Proportion of arable lands (A), forest (B), grassland (C),water body (D), urban (E) and desert (F) in each pixel and grazing intensity (G) spatial distribution in the study area of the middle part of northern slope of the north Tianshan Mountains in 2000 (1), 2005 (2), 2010 (3) and 2015 (4). Grazing intensity data comes from Food and Agriculture Organization of the United Nations (FAO).