利用聚类算法监测森林乔木物种多样性
衣海燕1,2, 曾源1,2,*( ), 赵玉金3, 郑朝菊1, 熊杰1,2, 赵旦1
), 赵玉金3, 郑朝菊1, 熊杰1,2, 赵旦1
Forest species diversity mapping based on clustering algorithm
YI Hai-Yan1,2, ZENG Yuan1,2,*(), ZHAO Yu-Jin3, ZHENG Zhao-Ju1, XIONG Jie1,2, ZHAO Dan1
), ZHAO Yu-Jin3, ZHENG Zhao-Ju1, XIONG Jie1,2, ZHAO Dan1
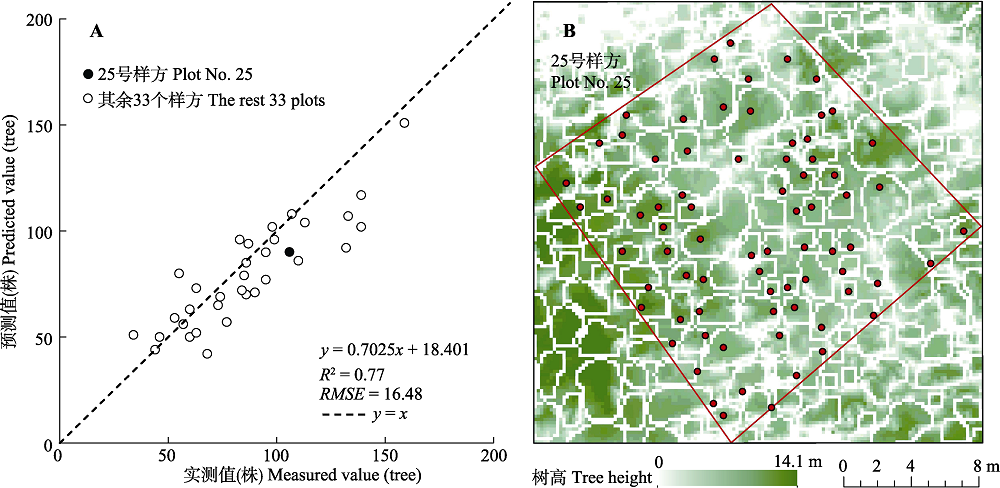
图4. 古田山研究区样方单木分离精度验证散点图(A)和25号样方的单木分离结果图(B)。红框为样方边界, 白框为分离出的单木树冠, 红点为实测单木根部位置。
Fig. 4. Validation result of individual tree isolation (A) and individual tree isolation result of plot No. 25 (B) in Gutianshan study area. The red polygon represents plot border, the white polygons represent canopy locations, and the red dots represent field-measured positions of the base of tree trunk.