), 王鹤松
), WANG He-Song
), 王鹤松
), WANG He-Song
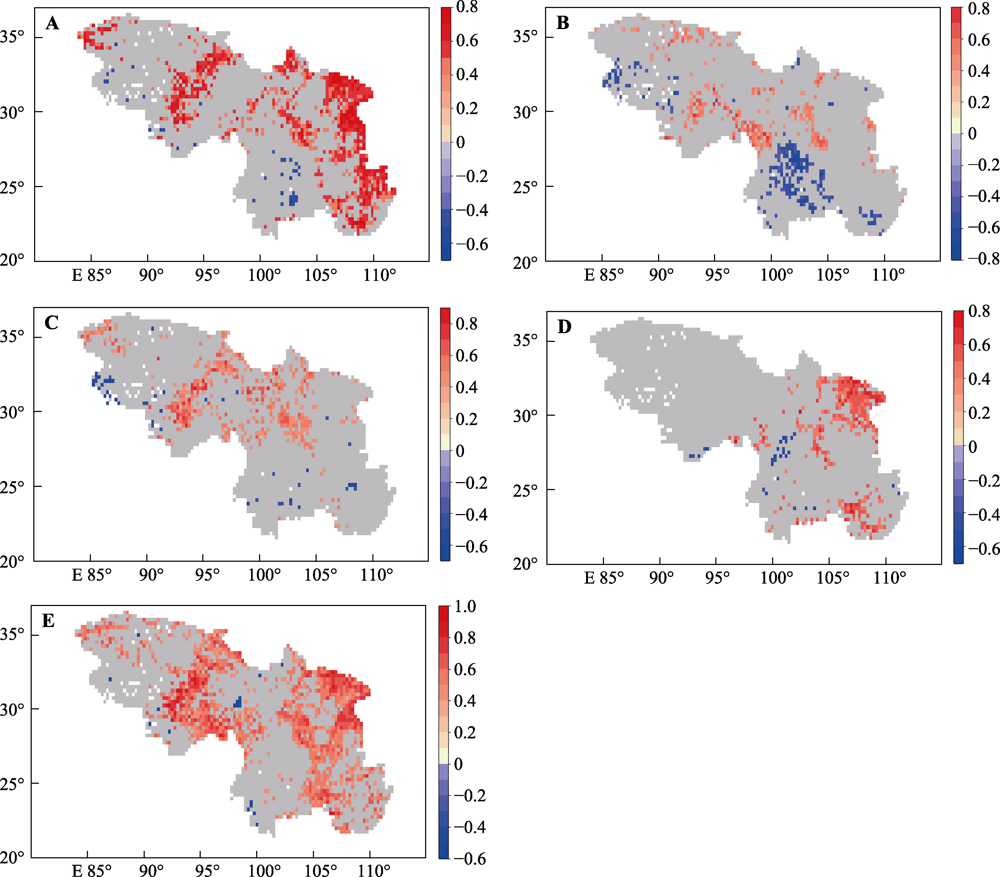
图4. 中国西南部地区1994-2015年归一化植被指数(NDVI)与极端温度指数去趋势后的相关关系空间分布。A, 年平均气温。B, 日最高气温的最大值。C, 暖昼日数。D, 夏季日数。E, 冷昼日数。F, 气温日较差。灰色表示没有通过显著性检验(p > 0.05), 暖色表示显著正相关(r > 0, p < 0.05), 冷色表示显著负相关(r < 0, p < 0.05)。
Fig. 4. Spatial patterns of correlation between normalized differential vegetation index (NDVI) and temperature-variables after data detrending in southwestern China from 1994 to 2015. A, Mean annual air temperature. B, Maximum value of daily maximum air temperature. C, Warm days. D, Summer days. E, Diel temperature range. Gray-coded areas are where no significant correlation was detected between NDVI and temperature-extreme variables (p > 0.05). The warm tone indicates positive significance (r > 0, p < 0.05), and the cold tone indicates negative significance (r < 0, p < 0.05).