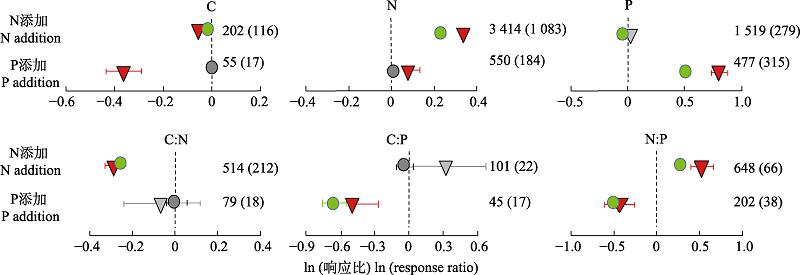
Fig. 2. Natural log response ratios of plant carbon (C), nitrogen (N), phosphorus (P) and their stoichiometric ratios to N and P additions, respectively (replotted based on Yuan & Chen (2015)). Circles are for results in natural environments with grey and green representing insignificant (p > 0.05) and significant (p ≤ 0.05) difference between the log response ratio and zero, respectively. Triangles are for results in controlled environments with grey and red representing insignificant (p > 0.05) and significant (p ≤ 0.05) difference between the log response ratio and zero, respectively. Error bars are the 95% confidence intervals for the mean. The numbers out- and inside parentheses represent the numbers of observations for experiments in natural and controlled environments, respectively.
|
 ), 严正兵2, 方精云3,**(