), 刘洪妤
), LIU Hong-Yu
), 刘洪妤
), LIU Hong-Yu
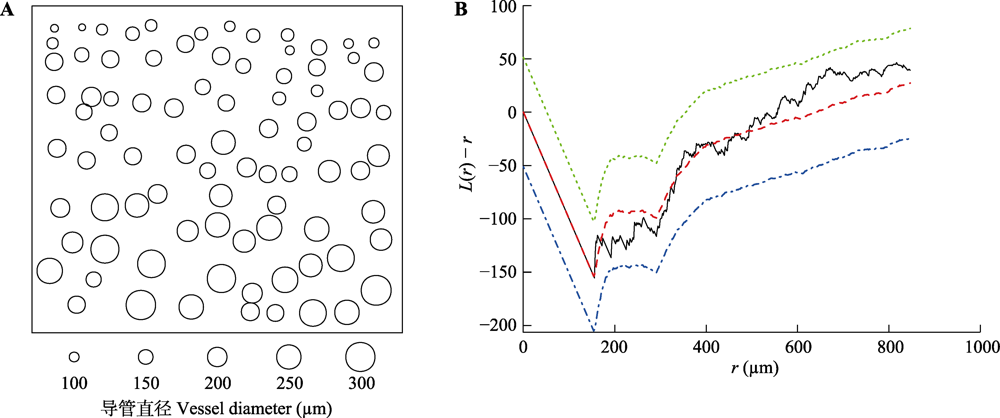
图1. Stewartia pseudocamelliashi的导管空间分布及其Strauss-Hardcore (SH)模型的包络检验。A, 木质部横切面的导管分布情况。每个圆圈代表一个导管, 圆圈直径为导管直径(µm)。B, 显著性水平为0.05的L函数包络检验。r, 点对距离; 纵坐标为公式(3)定义的L函数。黑色线代表实际数据拟合得到SH模型的L函数值, 红色线代表采用相同参数的SH理论分布模型的19次拟合平均值, 绿色和蓝色线分别代
Fig. 1. Spatial distribution of vessels in xylem of Stewartia pseudocamelliashi and envelope test of fitted Strauss-Hardcore (SH) model. A, Distribution of vessels in xylem cross-section. Each cycle stands for a vessel with cycle diameter as vessel diameter (µm). B, Envelope test for L function at significance of 0.05. r, the distance of paired points; Y-axis is the L function defined in equation (3). Black line represents L value from data fitted SH model, red line for average L value from 19 simulation of theoretical SH model, green and blue lines represent 2.5% and 97.5% quantile of L value from 19 simulation of theoretical SH model respectively.