), 王易恒1, 何奕成1, 崔清国2, 李跃林3, 申小莉2, 原作强4,5, 王扬2
), WANG Yi-Heng1, HE Yi-Cheng1, CUI Qing-Guo2, LI Yue-Lin3, SHEN Xiao-Li2, YUAN Zuo-Qiang4,5, WANG Yang2
), 王易恒1, 何奕成1, 崔清国2, 李跃林3, 申小莉2, 原作强4,5, 王扬2
), WANG Yi-Heng1, HE Yi-Cheng1, CUI Qing-Guo2, LI Yue-Lin3, SHEN Xiao-Li2, YUAN Zuo-Qiang4,5, WANG Yang2
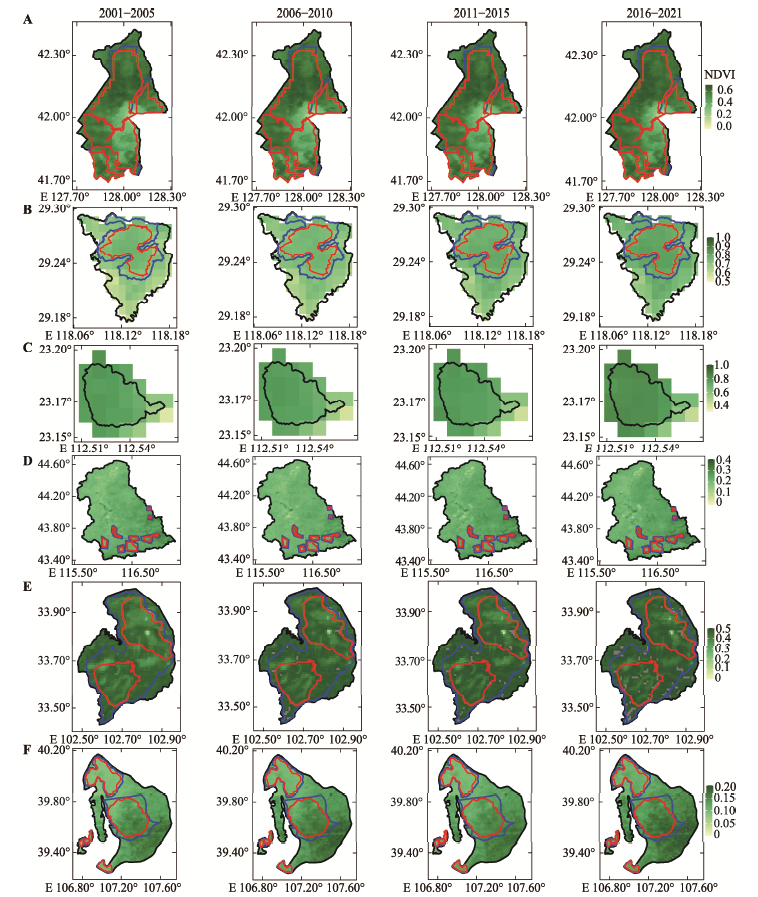
图4. 2001-2021年6个国家级自然保护区归一化植被指数(NDVI)的时空变化特征。A, 长白山自然保护区。B, 古田山自然保护区。C, 鼎湖山自然保护区。D, 锡林郭勒草原自然保护区。E, 若尔盖湿地自然保护区。F, 西鄂尔多斯自然保护区。每个保护区的4幅图中的NDVI分别为2001-2005、2006-2010、2011-2015、2016-2021年的平均值。红线和蓝线圈内的区域分别表示自然保护区的核心区和缓冲区。
Fig. 4. Spatial and temporal variations in the normalized difference vegetation index (NDVI) of the six national nature reserves from 2001 to 2021. A, Changbai Mountain Nature Reserve. B, Gutian Mountain Nature Reserve. C, Dinghu Mountain Nature Reserve. D, Xilin Gol Grassland Nature Reserve. E, Zoigê Wetland Nature Reserve. F, West Ordos Nature Reserve. NDVI data used in the four plots of each nature reserve were the averages from 2001 to 2005, 2006 to 2010, 2011 to 2015, and 2016 to 2021, respectively. Areas circled by red and blue lines indicate the core zone and buffer zone of a nature reserve, respectively.