)
)
)
)
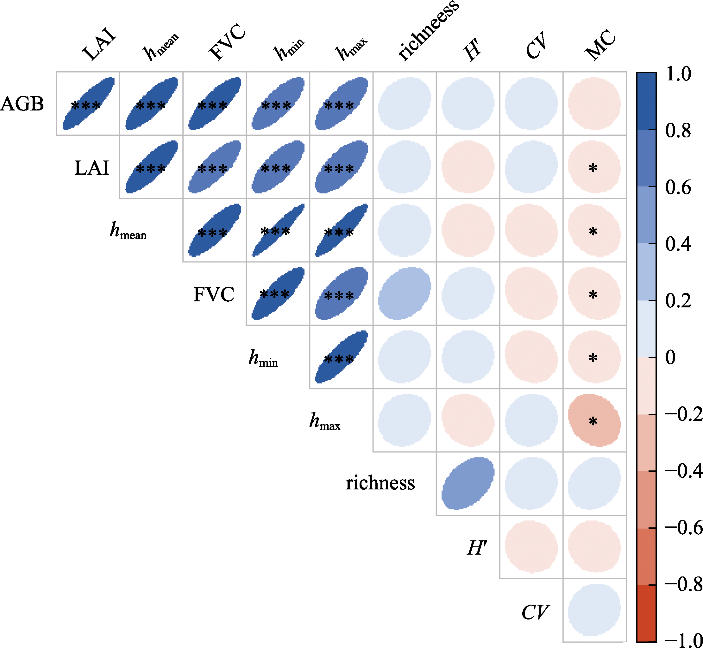
图2. 草地地上生物量估算中各变量的相关矩阵。每个方框内的椭圆颜色和尺寸大小代表变量间的相关方向和程度, 蓝色代表正相关, 红色代表负相关, 颜色越深代表相关性越强。AGB, 地上生物量; CV, 高度变异系数; FVC, 植被覆盖度; H', 香农-维纳多样性指数; hmax, 植被最大高度; hmean, 植被平均高度; hmin, 植被最小高度; LAI, 叶面积指数; MC, 含水量; richness, 物种丰富度。*, p < 0.05; ***, p < 0.001。
Fig. 2. Correlation matrix among variables in grassland aboveground biomass estimation. The color and size of each ellipse represent the correlation direction and degree between variables; the blue and red colors represent positive and negative correlations, respectively, and the correlation degree is stronger when the red or blue color of each ellipse gets deeper. AGB, aboveground biomass; CV, coefficient of variation for vegetation height; FVC, fractional vegetation cover; H', Shannon-Wiener index; hmax, maximum vegetation height; hmean, mean vegetation height; hmin, minimum vegetation height; LAI, leaf area index; MC, moisture content; richness, species richness. *, p < 0.05; ***, p < 0.001.