)
)
)
)
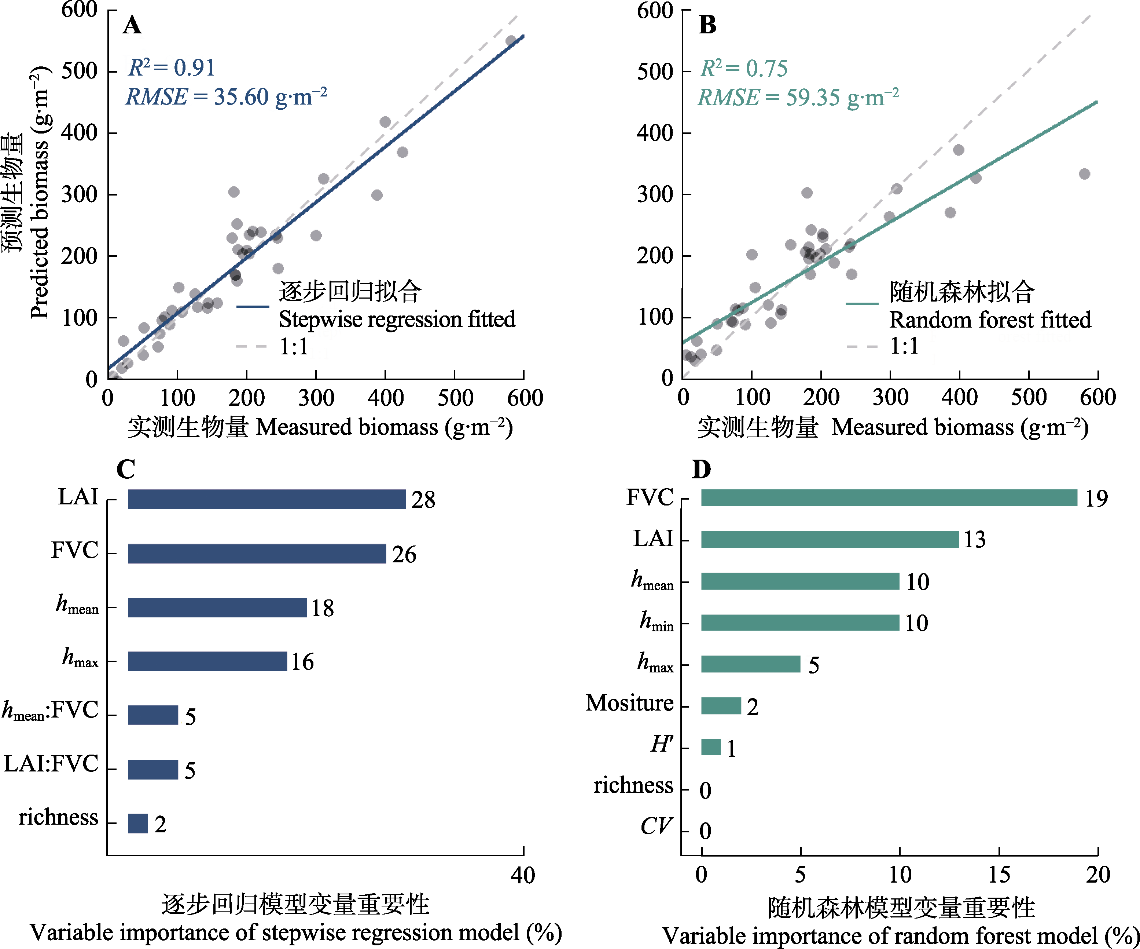
图4. 草地地上生物量预测模型及变量相对重要性。蓝色实线代表逐步回归模型(A)的拟合线, 绿色实线代表随机森林模型(B)的拟合线, 灰色虚线为1:1线, 对应模型的决定系数(R2)和均方根误差(RMSE)在左上角进行标示。模型变量重要性: 逐步回归模型(C), 随机森林模型(D)。条柱旁边的数字代表变量对应的相对重要性, 冒号连接的变量代表变量间的交互作用; 逐步回归模型的变量重要性来源于不同变量对R2的贡献, 随机森林模型的变量重要性来源于均值递减精度的方法。CV, 高度变异系数; FVC, 植被覆盖度; hmean, 植被平均高度; hmax, 植被最大高度; hmin, 植被最小高度; H', 香农-维纳多样性指数; LAI, 叶面积指数。
Fig. 4. Grassland aboveground biomass prediction models and relative importance of variables. The blue and green solid lines represent the fitted lines of the stepwise regression model (A) and random forest model (B), respectively; the grey dashed line denotes the 1:1 line. The determination coefficient (R2) and root mean square error (RMSE) of the two models are also marked by the corresponding color. The relative importance of variables in the stepwise regression model (C) and random forest model (D) are shown; numbers next to the bars indicate the relative importance of each variable; variables connected by colons represent interactions between variables; the variable importance of stepwise regression model is derived from the contributions of different variables to R2, and the variable importance of random forest model is derived from the mean decrease accuracy. CV, coefficient of variation for vegetation height; FVC, fractional vegetation cover; hmean, mean vegetation height; hmax, maximum vegetation height; hmin, minimum vegetation height; H', Shannon-Wiener index; LAI, leaf area index.