黄土高原生态工程实施下基于日光诱导叶绿素荧光的植被恢复生产力效益评价
薛金儒, 吕肖良*( )
)
)
Assessment of vegetation productivity under the implementation of ecological programs in the Loess Plateau based on solar-induced chlorophyll fluorescence
XUE Jin-Ru, LÜ Xiao-Liang*()
)
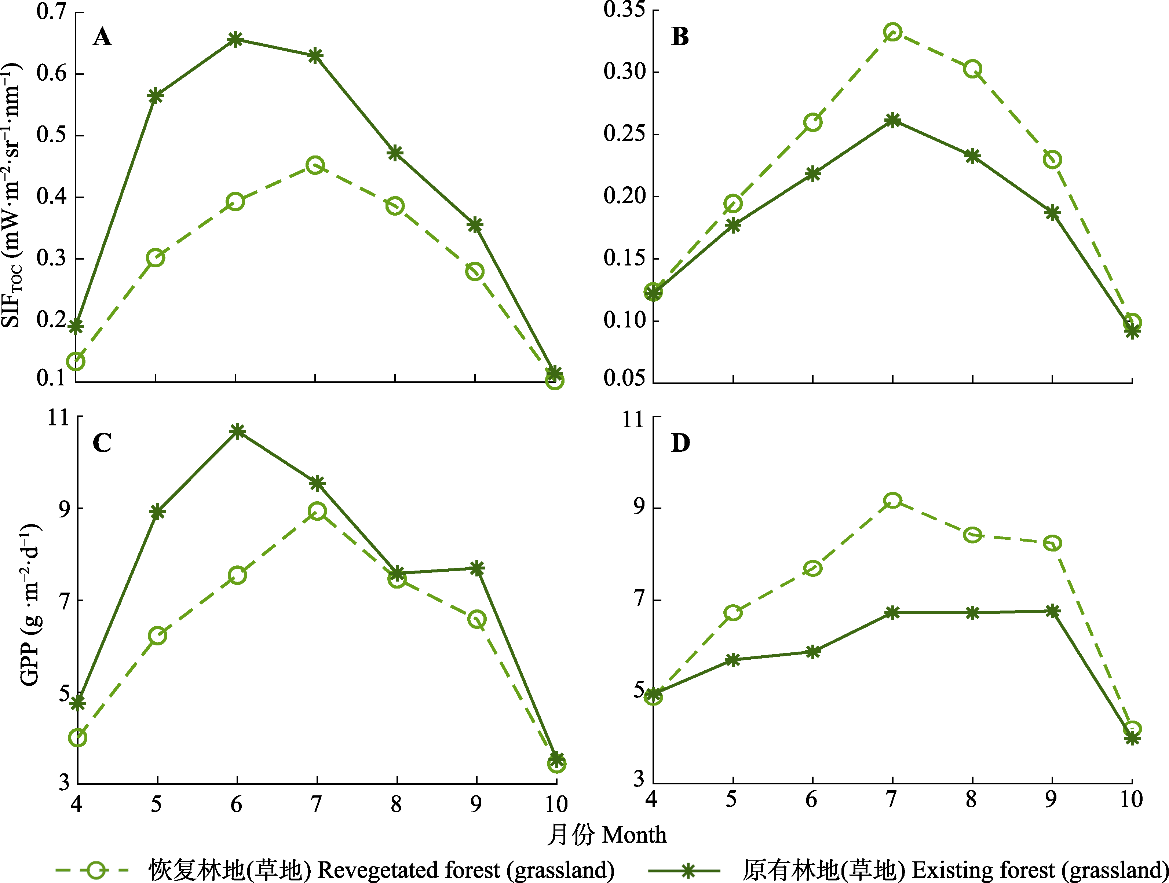
图5. 黄土高原2020年植被恢复区域与原有植被区域平均冠层顶部日光诱导叶绿素荧光(SIFTOC)、总初级生产力(GPP)对比。A, 林地恢复区域与原有林地区域平均SIFTOC对比。B, 草地恢复区域与原有草地区域平均SIFTOC对比。C, 林地恢复区域与原有林地区域平均GPP对比。D, 草地恢复区域与原有草地区域平均GPP对比。
Fig. 5. Comparison of mean top-of-canopy solar-induced chlorophyll fluorescence (SIFTOC) and gross primary production (GPP) between revegetation and existing vegetation area in the Loess Plateau in 2020. A, Mean SIFTOC comparison between revegetated forest and existing forest. B, Mean SIFTOC comparison between revegetated grassland and existing grassland. C, mean GPP comparison between revegetated forest and existing forest. D, Mean GPP comparison between revegetated grassland and existing grassland.