卫星遥感监测产品在中国森林生态系统的验证和不确定性分析——基于海量无人机激光雷达数据
刘兵兵1,2, 魏建新1,2,3,*( ), 胡天宇4,5, 杨秋丽4,5, 刘小强4,5, 吴发云6, 苏艳军4,5, 郭庆华7
), 胡天宇4,5, 杨秋丽4,5, 刘小强4,5, 吴发云6, 苏艳军4,5, 郭庆华7
Validation and uncertainty analysis of satellite remote sensing products for monitoring China’s forest ecosystems—Based on massive UAV LiDAR data
LIU Bing-Bing1,2, WEI Jian-Xin1,2,3,*(), HU Tian-Yu4,5, YANG Qiu-Li4,5, LIU Xiao-Qiang4,5, WU Fa-Yun6, SU Yan-Jun4,5, GUO Qing-Hua7
), HU Tian-Yu4,5, YANG Qiu-Li4,5, LIU Xiao-Qiang4,5, WU Fa-Yun6, SU Yan-Jun4,5, GUO Qing-Hua7
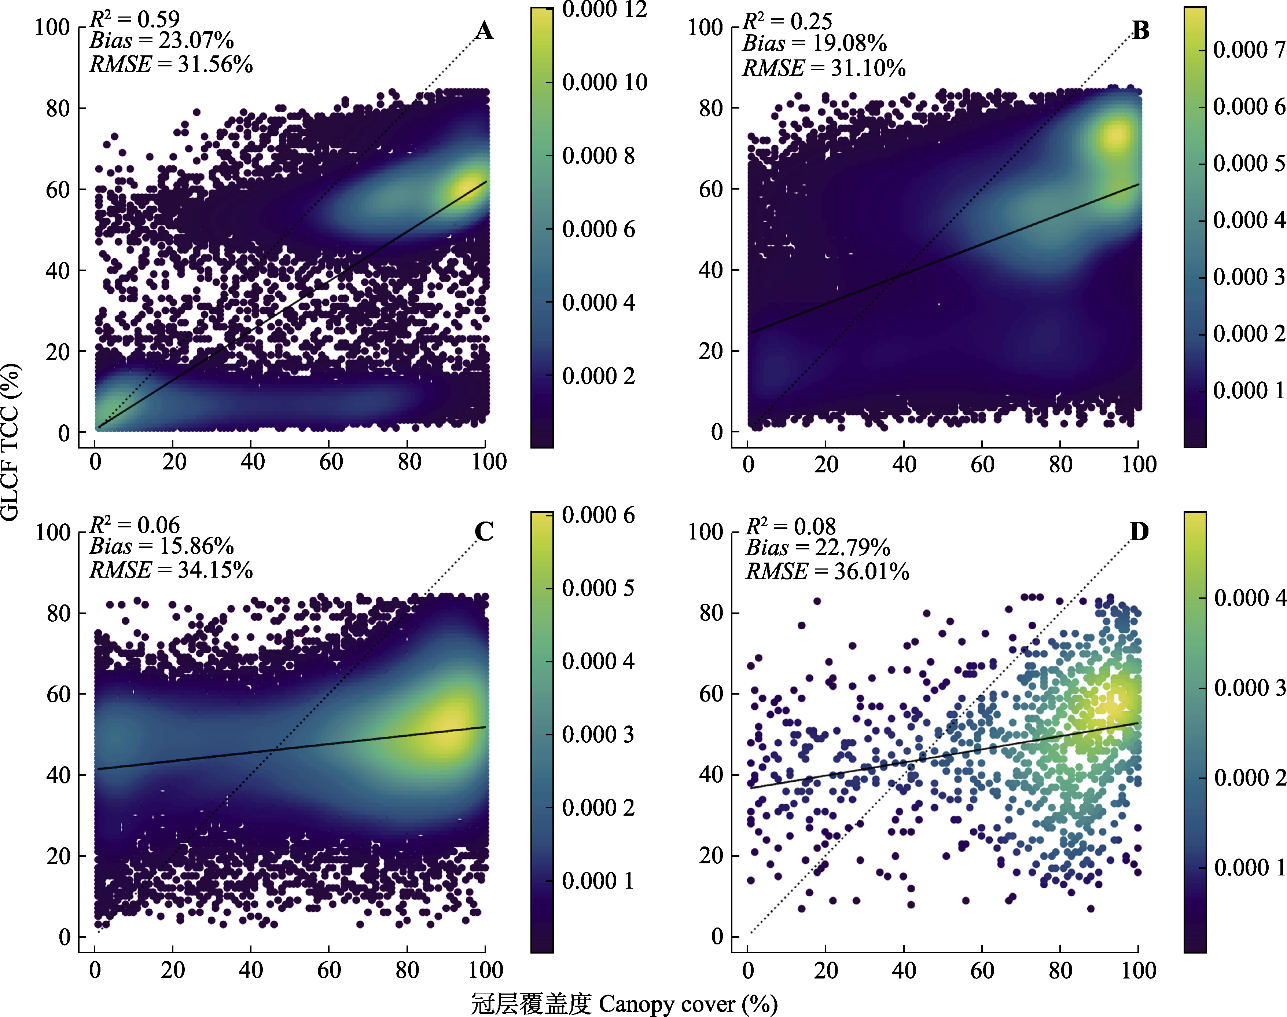
图3. 不同不确定性水平下无人机激光雷达获取的冠层覆盖度与全球冠层覆盖度产品(GLCF TCC)的散点图。虚线为1:1线, 实线为拟合线; 散点图右侧的色带表示数据点的概率密度, 颜色越黄, 点密度越大。A, 不确定性0-5%。 B, 不确定性5%-10%。C, 不确定性10%-15%。D, 不确定性≥15%。Bias, 偏差; R2, 决定系数; RMSE, 均方根误差。
Fig. 3. Scatter plots of canopy cover estimated from unmanned aerial vehicle (UAV) LiDAR data and Global Land Cover Facility-Tree Canopy Cover (GLCF TCC) under different uncertainty levels provided by GLCL TCC. The dotted lines are 1:1 lines, the solid lines are fitted lines, and color bars represent the probability density of observations with dark blue for low density and yellow for high density. A, Uncertainty: 0-5%. B, Uncertainty: 5%-10%. C, Uncertainty: 10%-15%. D, Uncertainty: above 15%. R2, determinant coefficient; RMSE, root mean square error.