格氏栲天然林林窗植物群落功能性状的变异
江蓝1, 魏晨思1, 何中声1,*( ), 朱静1, 邢聪1, 王雪琳1, 刘金福1, 沈彩霞2, 施友文3
), 朱静1, 邢聪1, 王雪琳1, 刘金福1, 沈彩霞2, 施友文3
Functional trait variation of plant communities in canopy gaps of Castanopsis kawakamii natural forest
JIANG Lan1, WEI Chen-Si1, HE Zhong-Sheng1,*(), ZHU Jing1, XING Cong1, WANG Xue-Lin1, LIU Jin-Fu1, SHEN Cai-Xia2, SHI You-Wen3
), ZHU Jing1, XING Cong1, WANG Xue-Lin1, LIU Jin-Fu1, SHEN Cai-Xia2, SHI You-Wen3
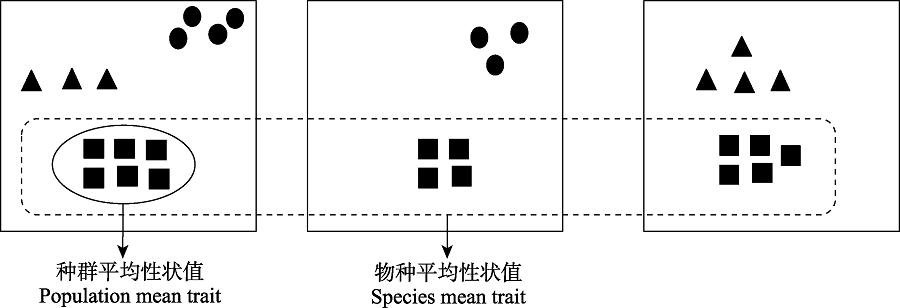
图2. 物种平均性状值与种群平均性状值概念示意图(参考Jung et al.,
Fig. 2. Conceptual illustration of species mean trait and population mean trait (developed based on Jung et al.,