)
)
)
)
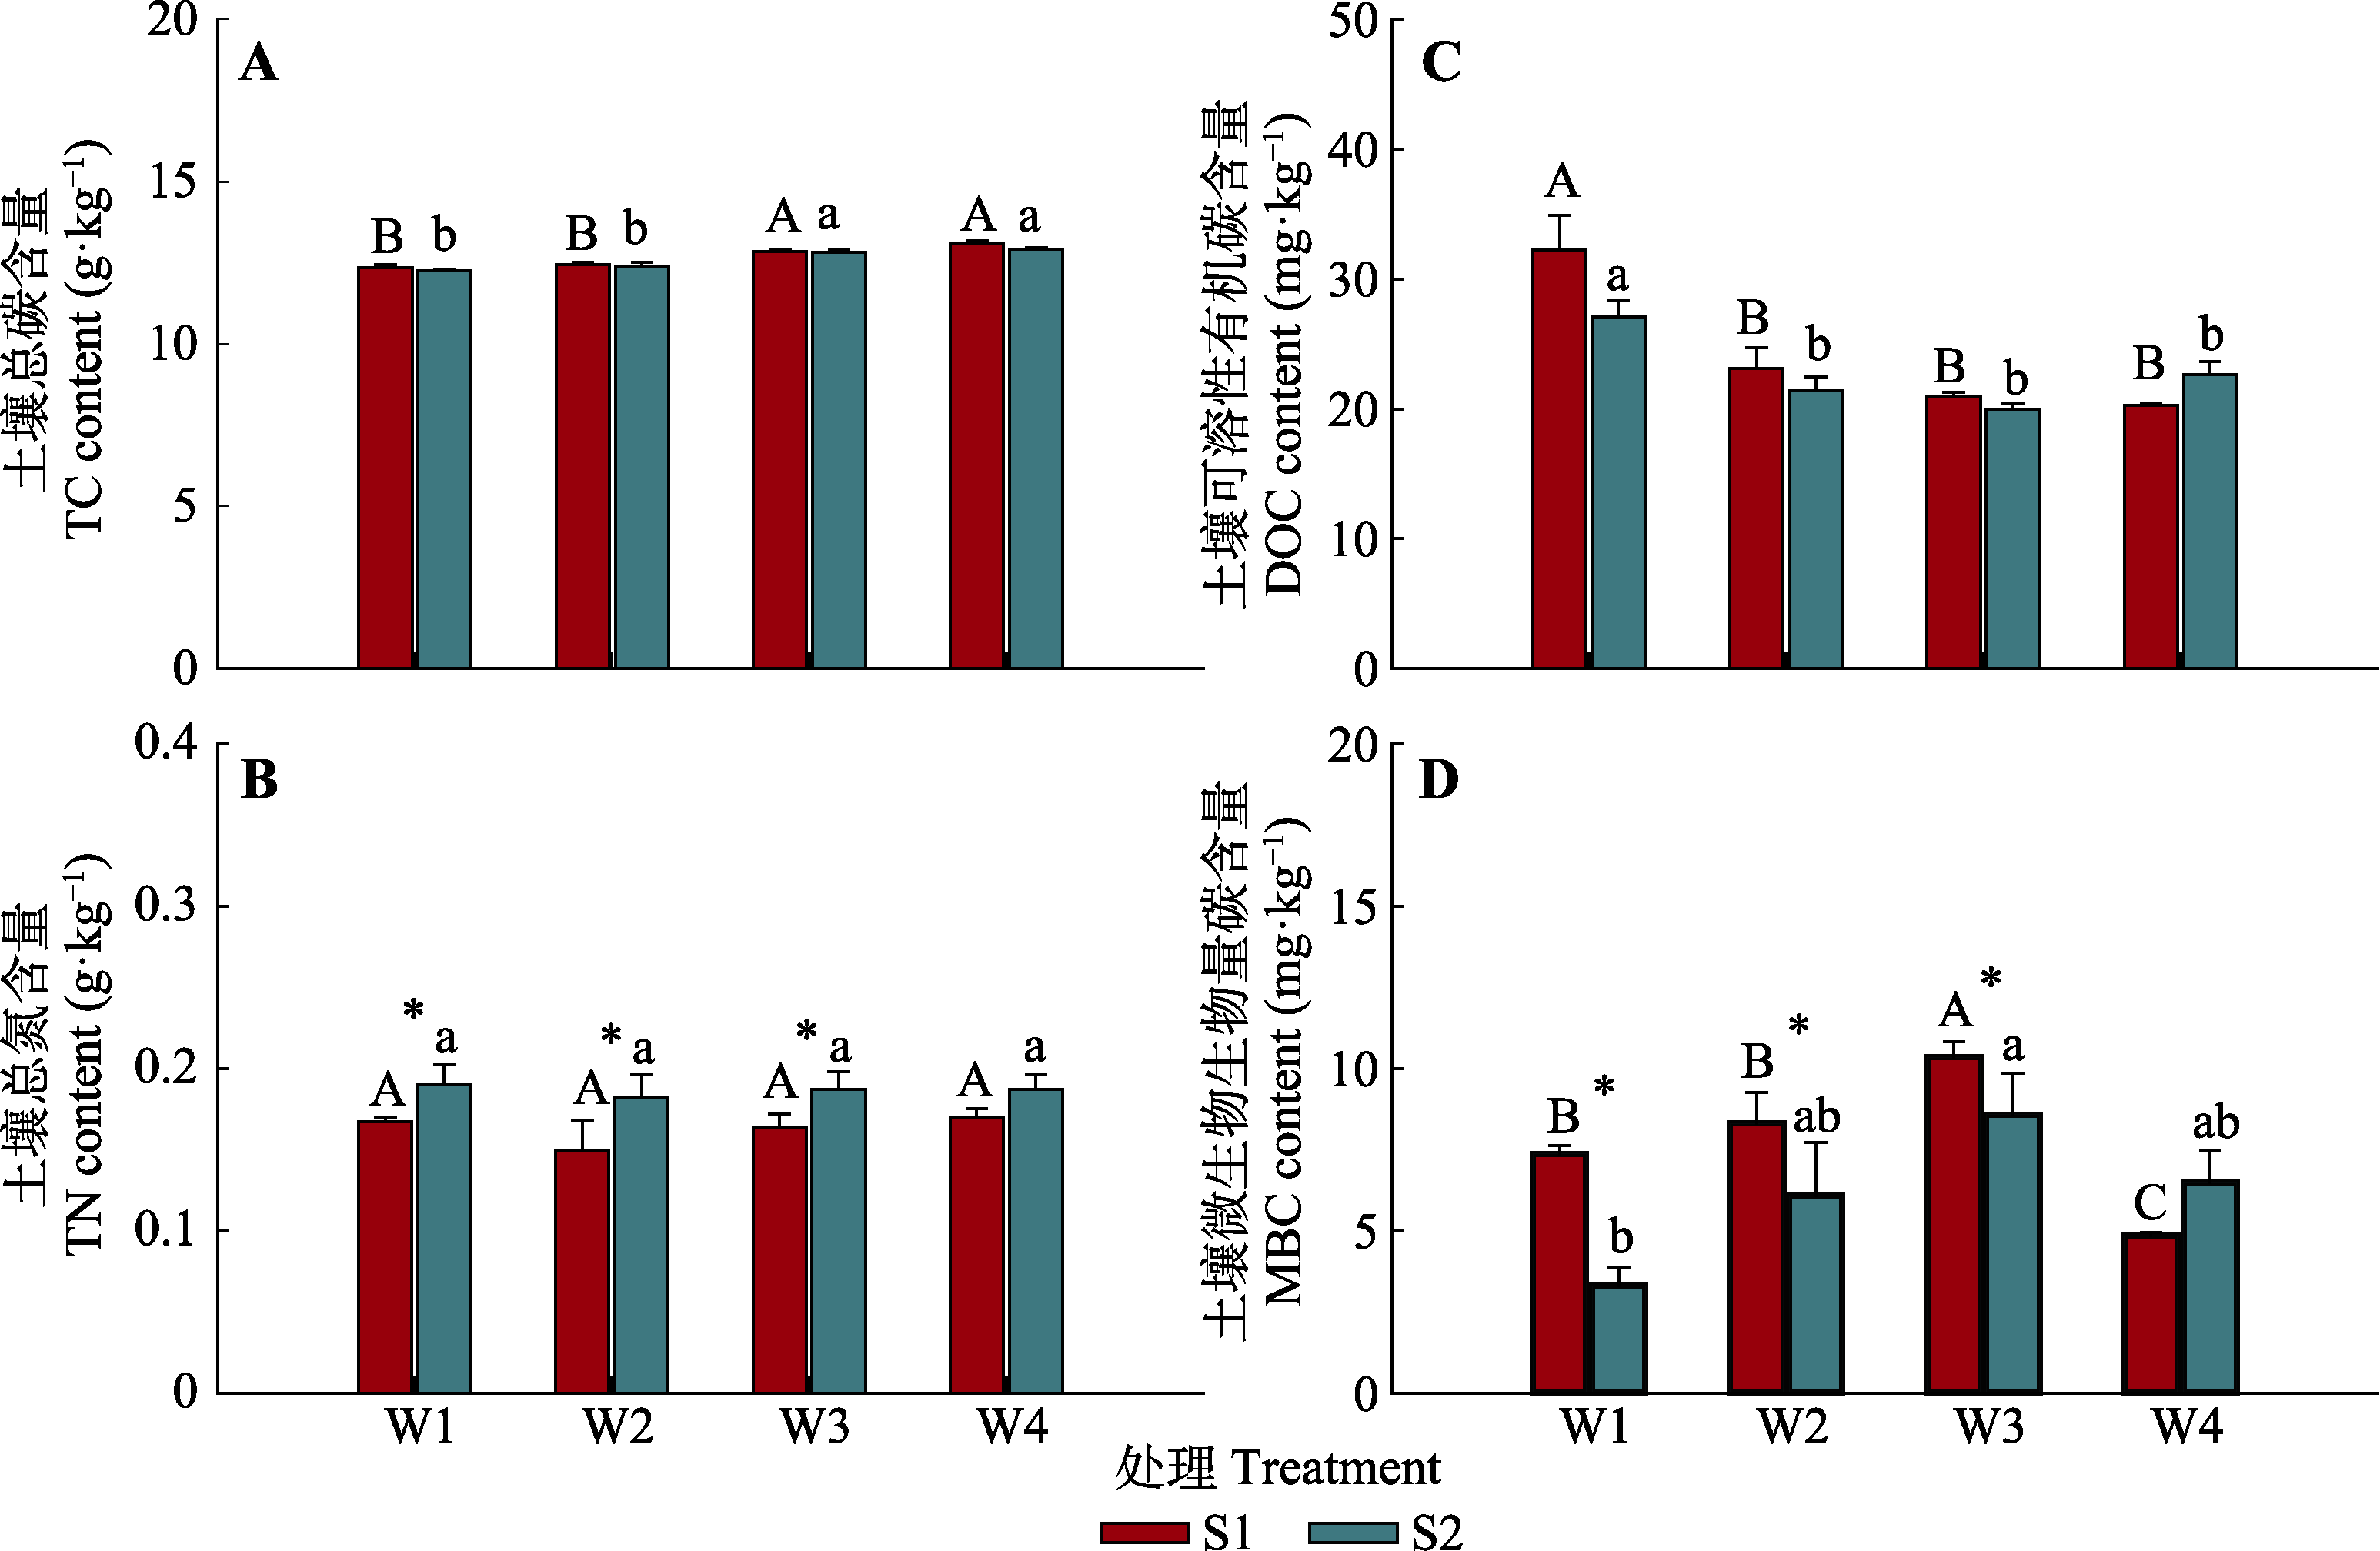
图1. 不同水盐处理下土壤总碳(TC) (A)、总氮(TN) (B)、可溶性有机碳(DOC) (C)和微生物生物量碳(MBC) (D)含量的均值变化(标准值±标准误)。不同大写字母表示在低盐分(S1)下不同水分处理间的差异显著(p < 0.05), 不同小写字母表示在高盐分(S2)下不同水分处理间的差异显著(p < 0.05), *表示相同水分下不同盐分处理间的差异显著(p < 0.05)。W1, 25%土壤饱和含水量; W2, 50%土壤饱和含水量; W3, 75%土壤饱和含水量; W4, 100%土壤饱和含水量。
Fig. 1. Effects of soil moisture and salinity on mean values of soil total carbon (TC) content (A), soil total nitrogen (TN) content (B), soil dissolved organic carbon (DOC) content (C) and soil microbial biomass carbon (MBC) content (D) (mean ± SE). Different uppercase letters indicate significant difference between soil moisture treatments under low salinity level (S1) (p < 0.05), different lowercase letters indicate significant difference between soil moisture treatments under high salinity level (S2) (p < 0.05), and * indicates the significant difference between salinity treatments under the same moisture condition (p < 0.05). W1, 25% soil saturated moisture content; W2, 50% soil saturated moisture content; W3, 75% soil saturated moisture content; W4, 100% soil saturated moisture content.