黄河三角洲典型滨海盐沼湿地土壤CO2和CH4排放对水盐变化的响应
李雪1,3,4, 董杰3, 韩广轩1,2, 张奇奇1, 谢宝华1,2, 李培广1,2, 赵明亮1,2, 陈克龙4, 宋维民1,2,*( )
)
)
Response of soil CO2 and CH4 emissions to changes in moisture and salinity at a typical coastal salt marsh of Yellow River Delta
LI Xue1,3,4, DONG Jie3, HAN Guang-Xuan1,2, ZHANG Qi-Qi1, XIE Bao-Hua1,2, LI Pei-Guang1,2, ZHAO Ming-Liang1,2, CHEN Ke-Long4, SONG Wei-Min1,2,*()
)
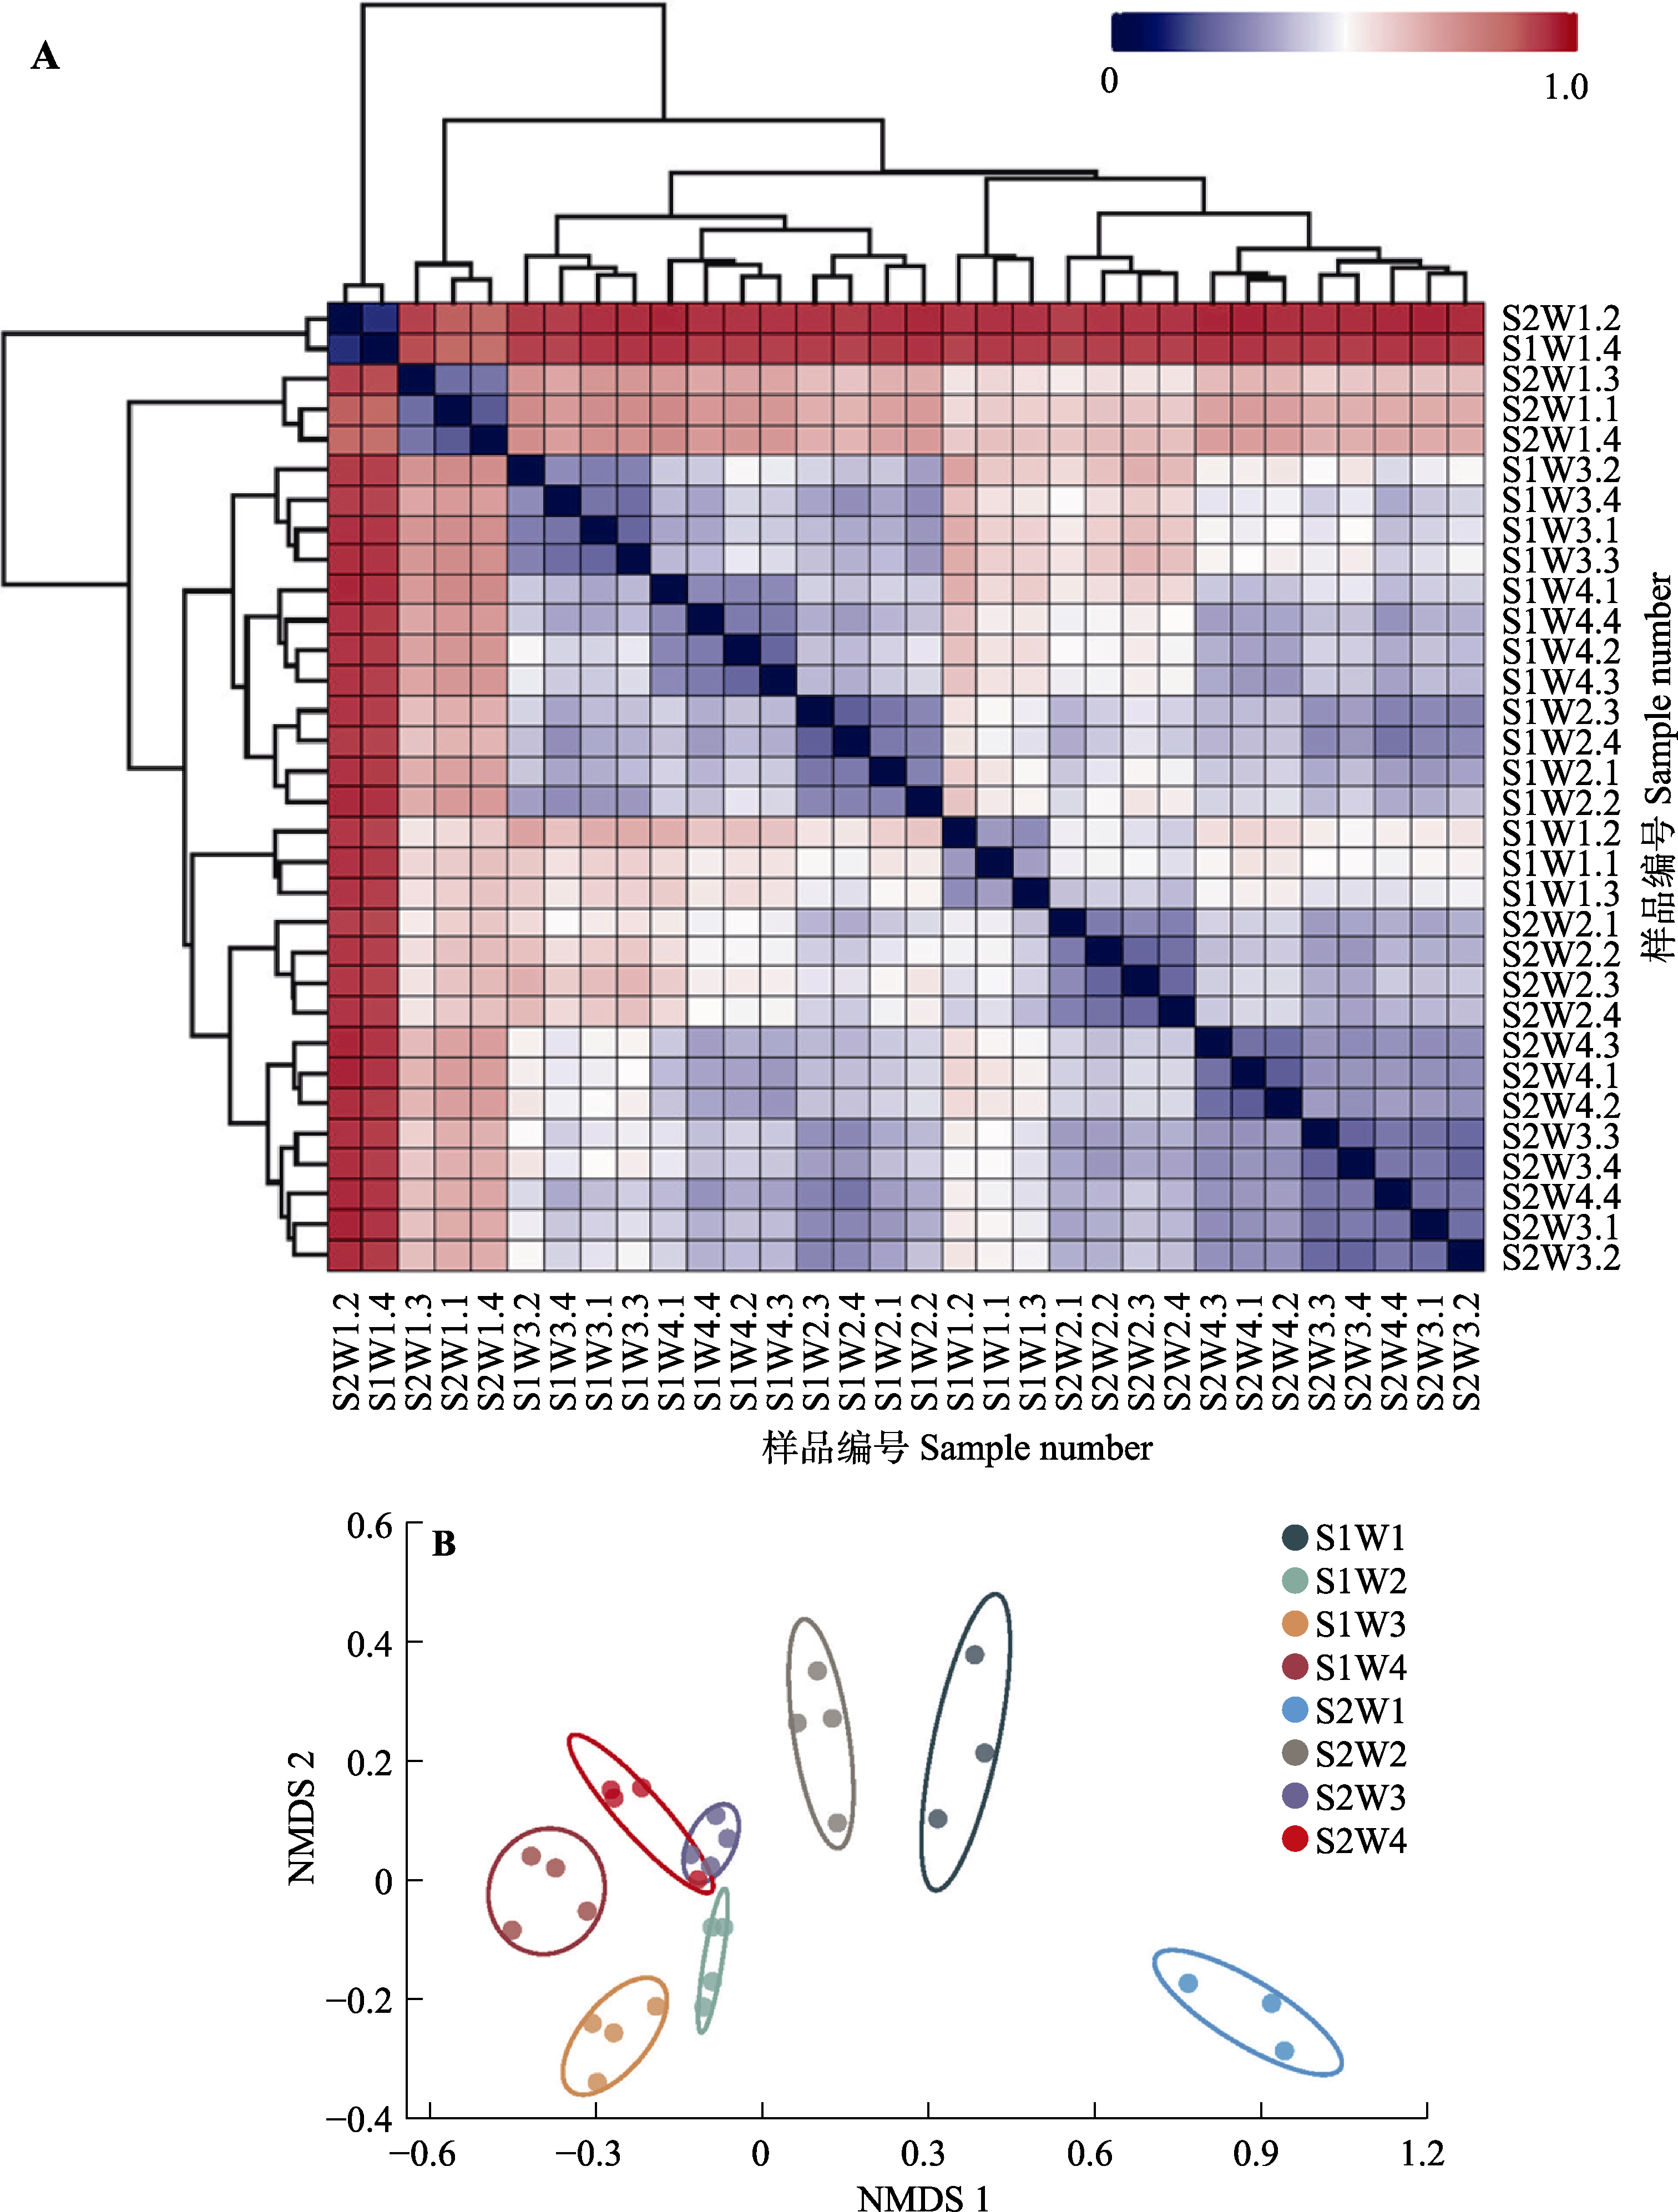
图2. 土壤细菌群落样本距离热图(A)及非度量多维尺度分析(NMDS)分析图(B)。A中大写字母和数字代表土壤样品编号, B中大写字母和数字代表实验处理编号。S1, 9 g·kg-1的土壤盐分; S2, 18 g·kg-1的土壤盐分; W1, 25%的土壤饱和含水量; W2, 50%的土壤饱和含水量; W3, 75%的土壤饱和含水量; W4, 100%的土壤饱和含水量。
Fig. 2. Heat map of soil bacterial community sample distance (A) and non-metric multidimensional scaling (NMDS) analysis (B). In A, uppercase letters and numbers represent soil sample numbers; in B, uppercase letters and numbers represent the experimental treatment number. S1, 9 g·kg-1 soil salinity; S2, 18 g·kg-1 soil salinity; W1, 25% soil saturation moisture content; W2, 50% soil saturation moisture content; W3, 75% soil saturation moisture content; W4, 100% soil saturation moisture content.