)
)
)
)
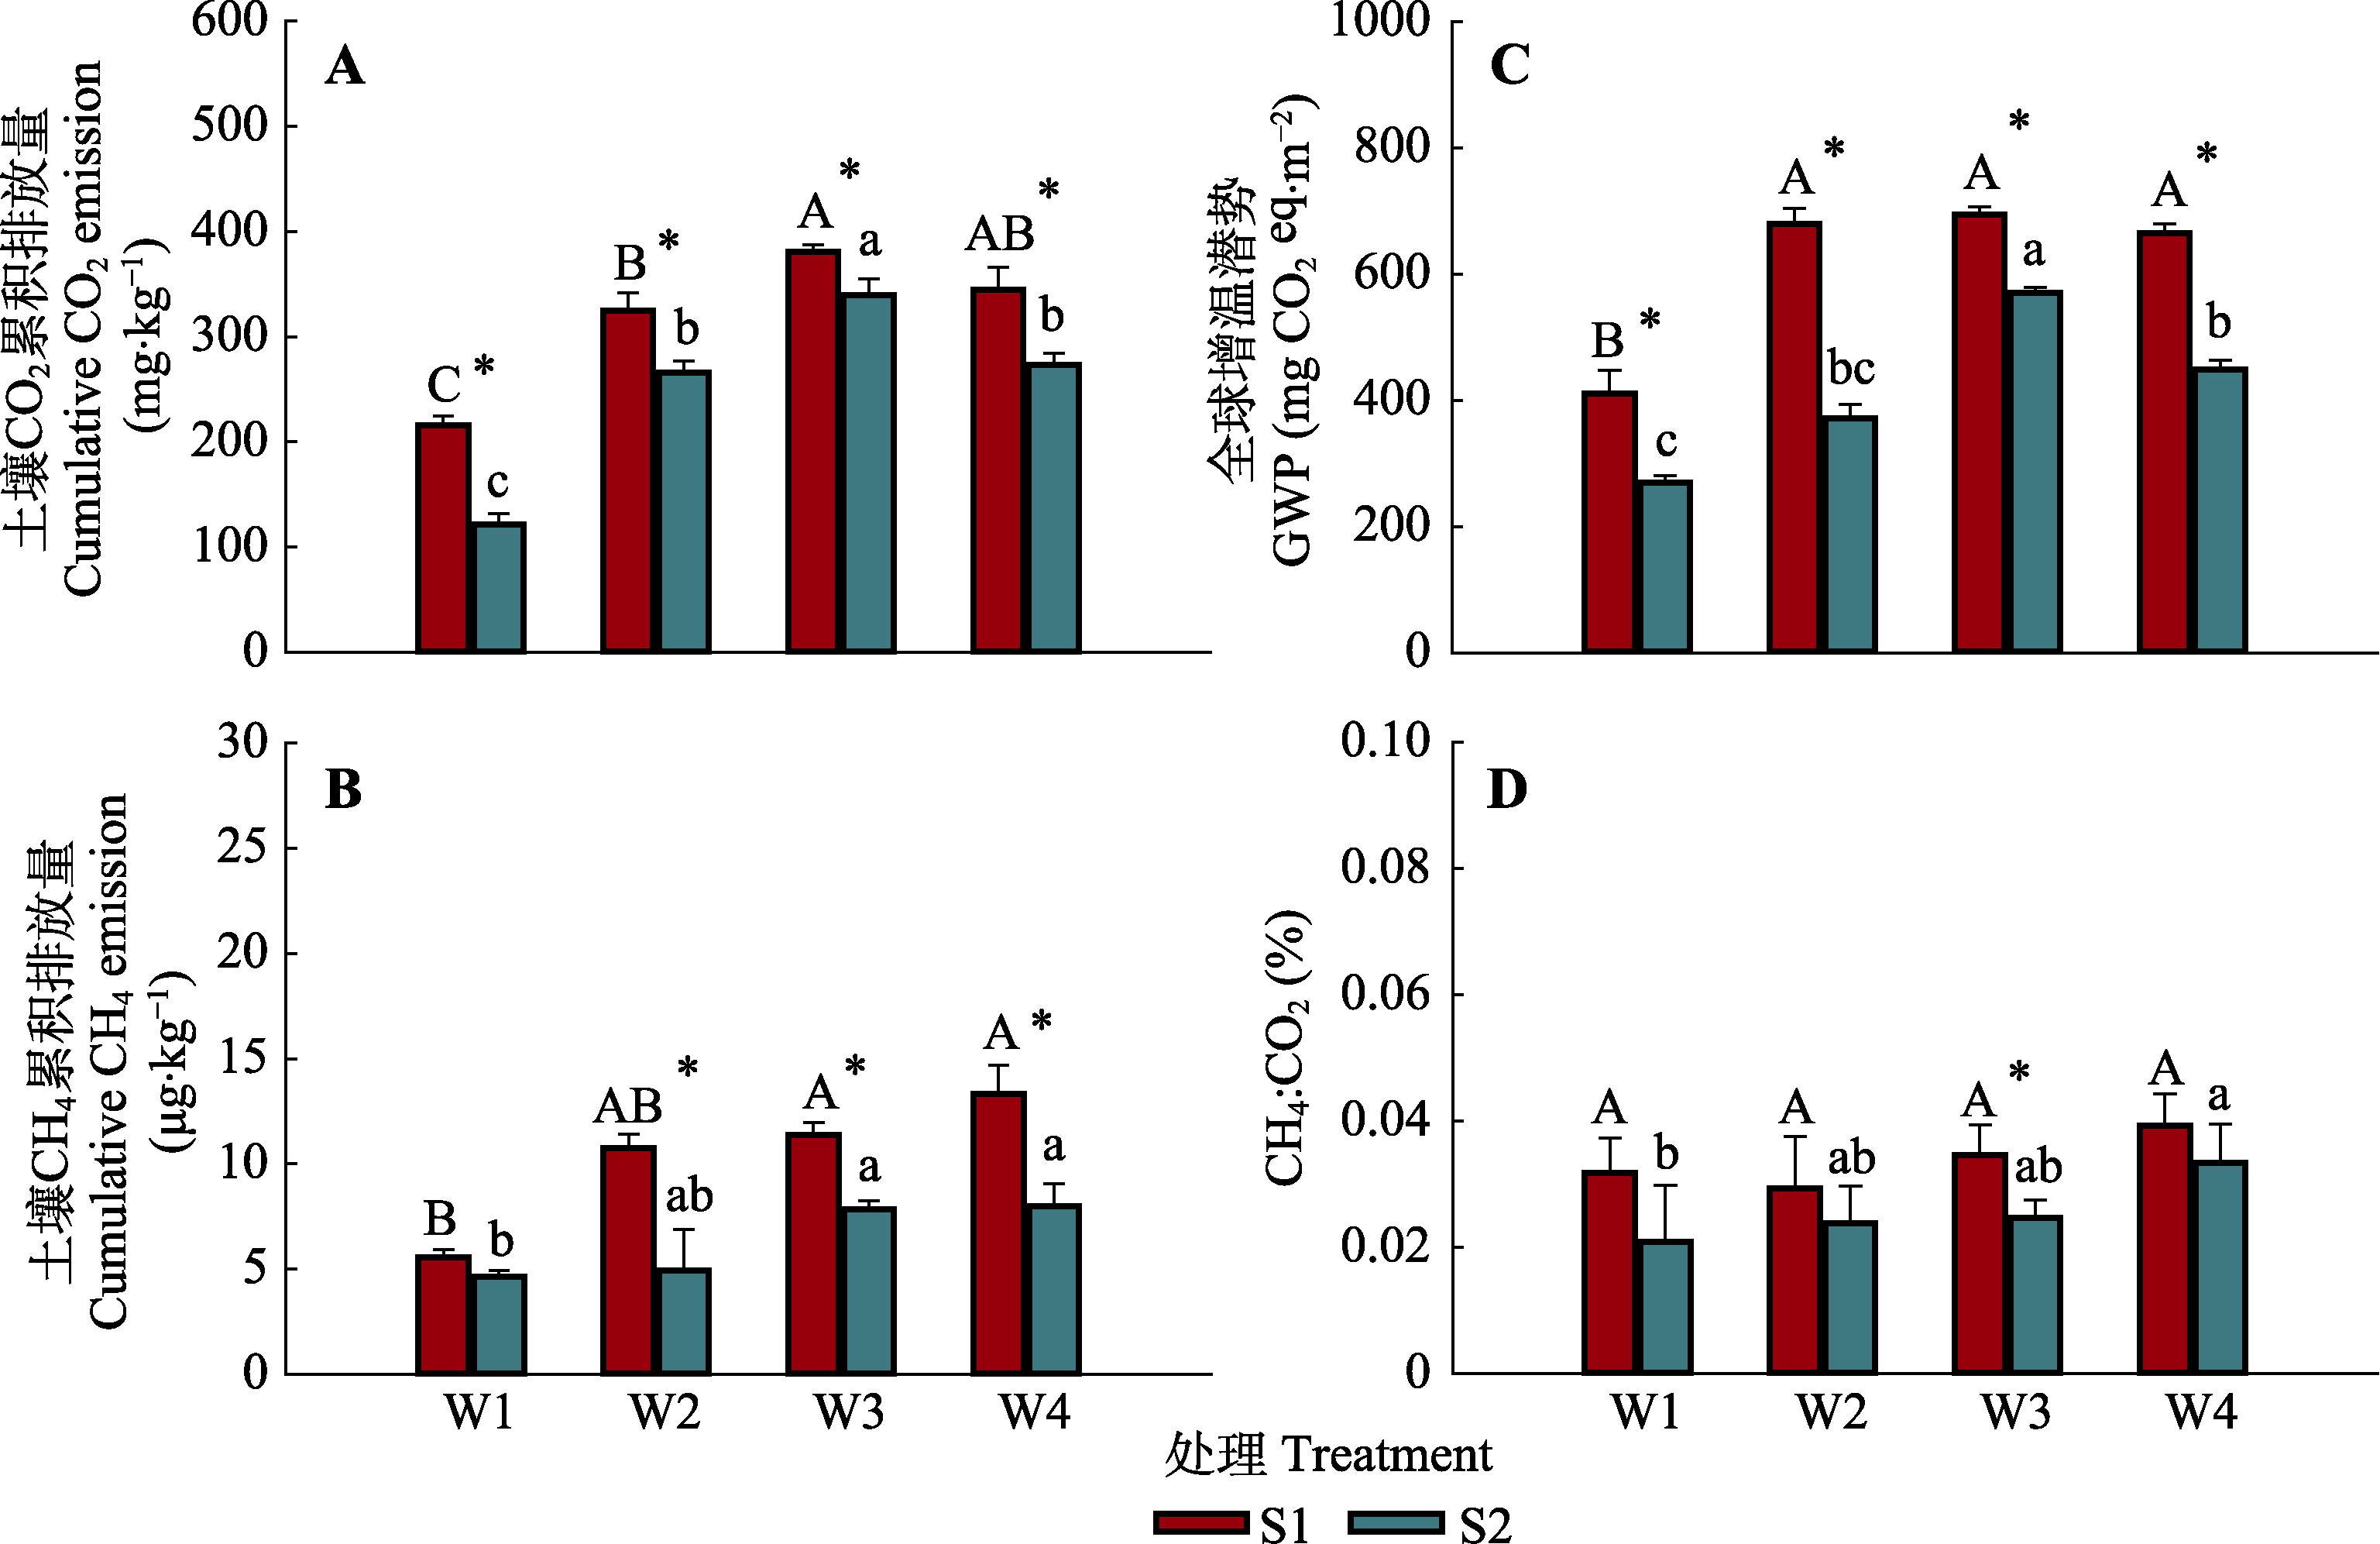
图4. 不同水盐处理下土壤CO2累积排放量(A)、CH4累积排放量(B)、全球增温潜势(GWP) (C)及CH4:CO2通量比率(D)的变化(平均值±标准误)。不同大写字母表示在低盐分(S1)下水分处理间的差异显著(p < 0.05), 不同小写字母表示在高盐分(S2)下水分处理间的差异显著(p < 0.05), *表示相同水分下盐分处理间的差异显著(p < 0.05)。S1, 9 g·kg-1的土壤盐分; S2, 18 g·kg-1的土壤盐分; W1, 25%的土壤饱和含水量; W2, 50%的土壤饱和含水量; W3, 75%的土壤饱和含水量; W4, 100%的土壤饱和含水量。eq, 当量。
Fig. 4. Effects of soil moisture and salinity on values of soil cumulative CO2 emission (A) and soil cumulative CH4 emission (B), global warming potential (GWP) (C) and CH4:CO2 (D) (mean ± SE). Different uppercase letters indicate significant difference between soil moisture treatments under low salinity level (S1) (p < 0.05), different lowercase letters indicate significant difference between soil moisture treatments under high salinity level (S2) (p < 0.05), and * indicates significant difference between salinity treatments under the same moisture condition (p < 0.05). S1, 9 g·kg-1 soil salinity; S2, 18 g·kg-1 soil salinity; W1, 25% soil saturation moisture content; W2, 50% soil saturation moisture content; W3, 75% soil saturation moisture content; W4, 100% soil saturation moisture content. eq, equivalent.