)
)
)
)
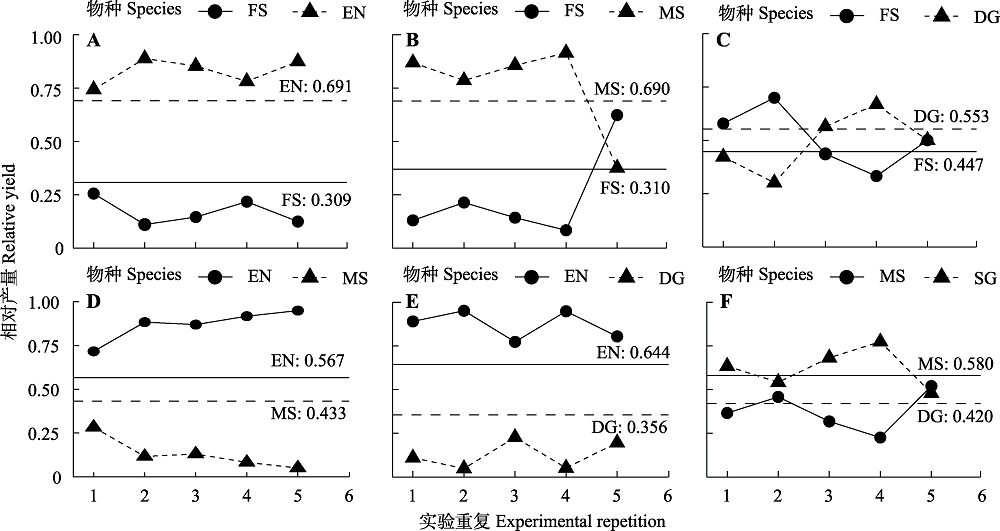
图6. 混播群落中各物种对群落地上生物量的实际贡献比例。折线表示混播群落中各物种对群落地上生物量的贡献比例的变化; 直线表示以单播群落地上生物量为基础的混播群落中各物种对群落地上生物量的期望贡献比例。A、B、C、D、E和F分别表示物种组合为FS-EN、FS-MS、FS-DG、EN-MS、EN-DG和MS-DG的混播群落。DG, 鸭茅; EN, 垂穗披碱草; FS, 中华羊茅; MS, 紫花苜蓿。
Fig. 6. Actual contribution proportion of species constituting the community to aboveground biomass in the mixed community. The broken line represents the change of the proportion of each species’ contribution to aboveground biomass in the mixed community. The straight line represents the expected contribution proportion of each species in a mixed community based on the aboveground biomass of the mixed community. A, B, C, D, E and F represent mixed communities with species combinations classified as FS-EN, FS-MS, FS-DG, EN-MS, EN-DG, and MS-DG, respectively. DG, Dactylis glomerata; EN, Elymus nutans; FS, Festuca sinensis; MS, Medicago sativa.