CMIP6模式对中国西南部地区植被碳利用率模拟能力综合评估
李伯新, 姜超*( ), 孙建新
), 孙建新
Comprehensive assessment of vegetation carbon use efficiency in southwestern China simulated by CMIP6 models
LI Bo-Xin, JIANG Chao*(), SUN Osbert Jianxin
), SUN Osbert Jianxin
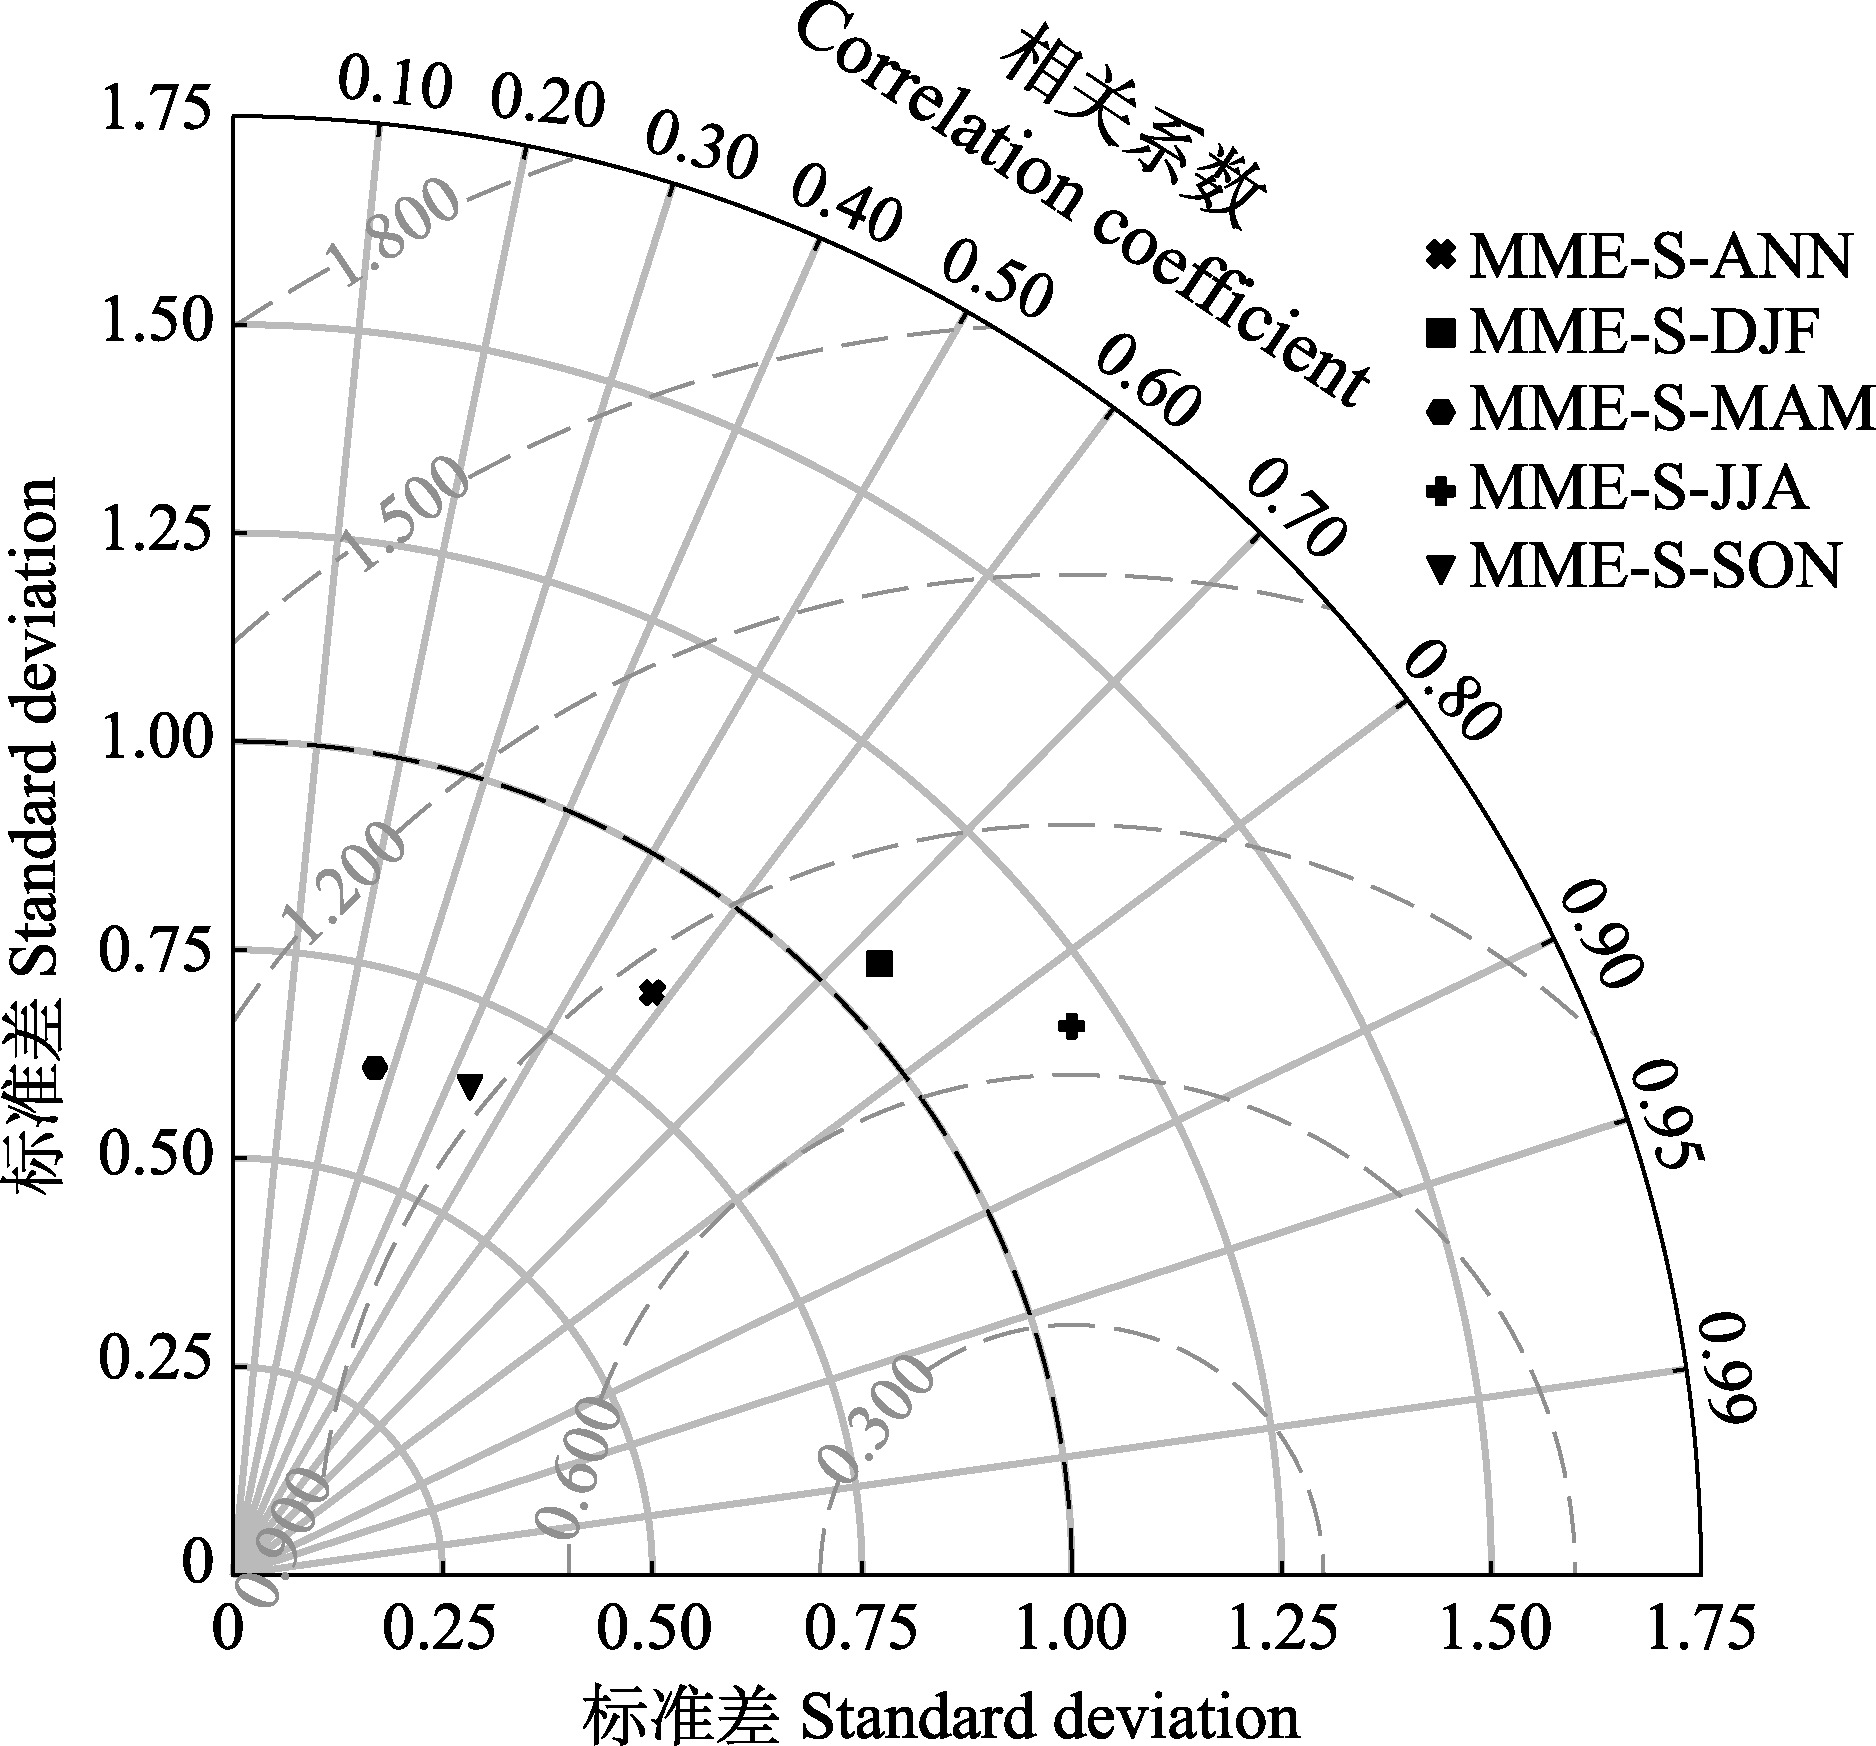
图5. 较优模式集合模拟的2001-2014年中国西南部地区年和季节尺度多年平均植被碳利用率(CUE)空间分布相对于MODIS (MOD17A2H)观测场的泰勒图。MME-S-ANN、MME-S-DJF、MME-S-MAM、MME-S-JJA、MME-S-SON分别为年、冬季、春季、夏季、秋季尺度多年平均较优模式的集合。图中辐射线代表相关系数, 虚线代表均方根误差。
Fig. 5. Annual and seasonal scale Taylor diagram for the spatial distribution of multi-year average vegetation carbon use efficiency (CUE) simulated by the MME-S from 2001 to 2014 relative to the MODIS observation (MOD17A2H) in southwestern China. MME-S-ANN, MME-S-DJF, MME-S-MAM, MME-S-JJA and MME-S-S-SON are collections of annual, winter, spring, summer and autumn multi-year mean-scale better models, respectively. The radial line represents the correlation coefficient and the dashed line represents the root mean square error.