云南香格里拉亚高山寒温性针叶林优势种空间分布格局及种内种间关联性
Spatial distribution patterns and intraspecific and interspecific associations of dominant species in subalpine cold-temperate coniferous forests of Shangri-La, Yunnan, China
云南香格里拉亚高山寒温性针叶林优势种空间分布格局及种内种间关联性 |
| 万嘉敏, 张彩彩, 邓云, 顾荣, 斯那取宗, 吴俊华, 娄启妍, 陈梅, 张志明, 林露湘 |
|
Spatial distribution patterns and intraspecific and interspecific associations of dominant species in subalpine cold-temperate coniferous forests of Shangri-La, Yunnan, China |
| WAN Jia-Min, ZHANG Cai-Cai, DENG Yun, GU Rong, SINA Qu-Zong, WU Jun-Hua, LOU Qi-Yan, CHEN Mei, ZHANG Zhi-Ming, LIN Lu-Xiang |
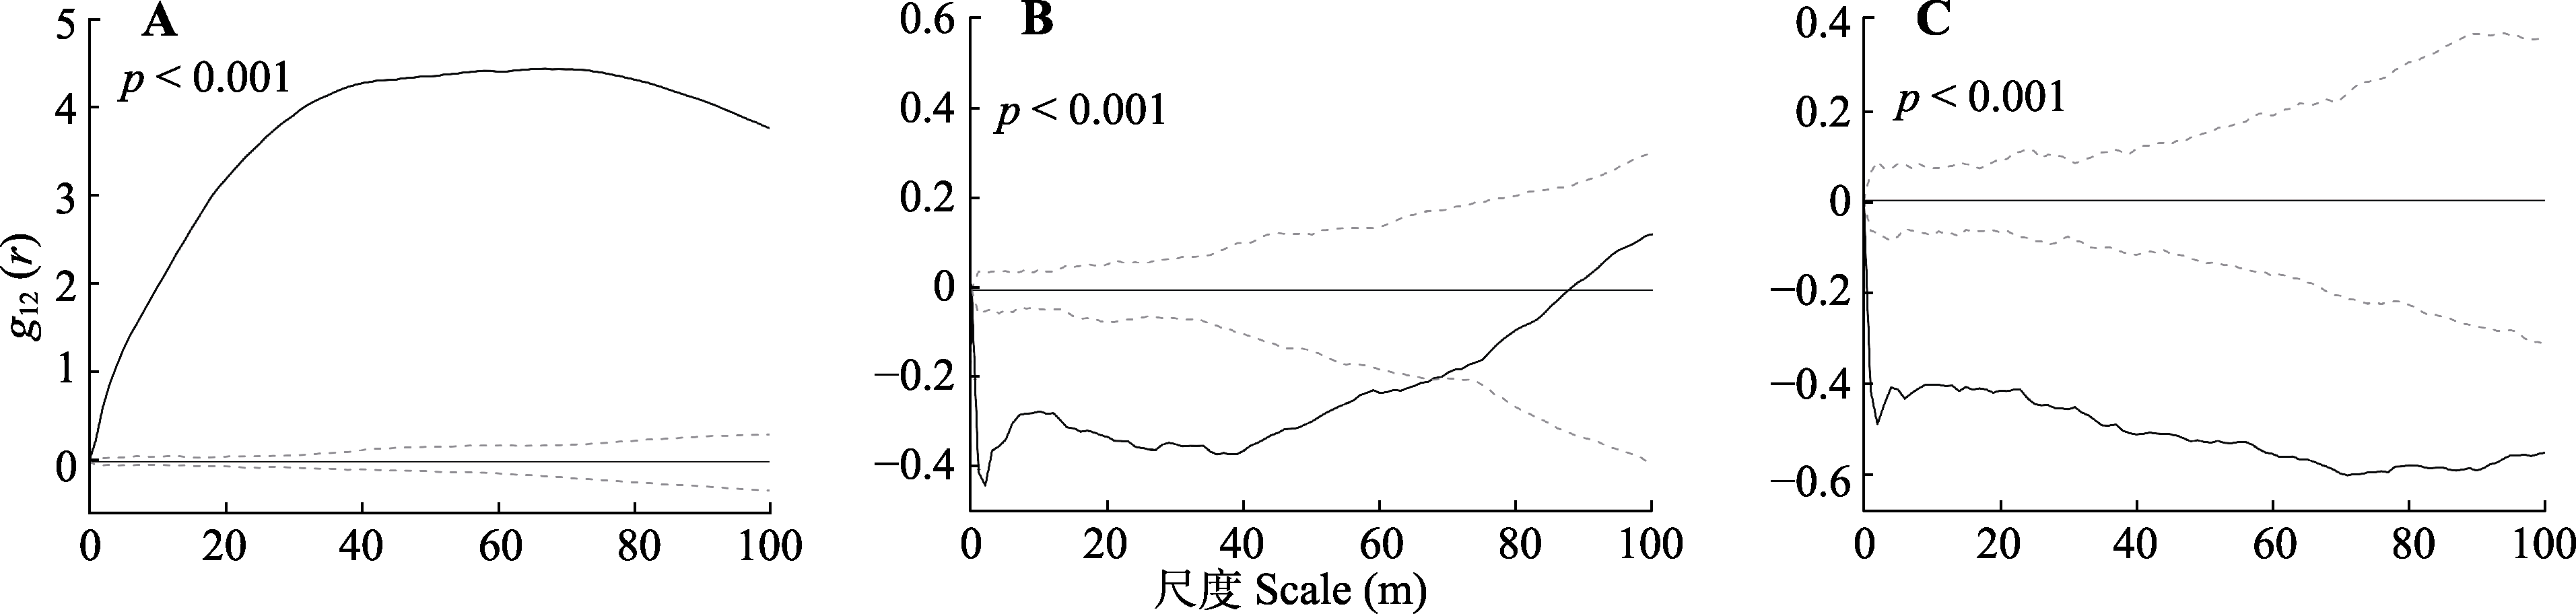
| 图3 云南香格里拉亚高山寒温性针叶林20 hm2动态监测样地中长苞冷杉种群不同发育阶段的种内关联性。A, 幼树和中树。B, 幼树和成树。C, 中树和成树。黑色曲线表示双变量成对相关函数g12(r)的函数值, 黑色直线表示双变量成对相关函数g12(r)的期望值, 灰色虚线表示99%的置信区间。p值为拟合优度检验结果。 |
| Fig. 3 Intraspecific correlation of Abies georgei population at different developmental stages in the 20 hm2 dynamics plot of subalpine cold-temperate coniferous forest in Shangri-La, Yunnan. A, Sapling and juvenile trees. B, Sapling and adult trees. C, Juvenile and adult trees. The black curve represents the function value of the bivariate pair-correlation function g12(r), and the black straight line represents the expected value of the bivariate pair-correlation g12(r) function. The dashed gray line indicates a 99% confidence interval. The p-value is the goodness of fit test result. |
|
|