
植物生态学报 ›› 2019, Vol. 43 ›› Issue (4): 305-319.DOI: 10.17521/cjpe.2018.0241 cstr: 32100.14.cjpe.2018.0241
所属专题: 全球变化与生态系统; 生态遥感及应用; 青藏高原植物生态学:遥感生态学
张富广,曾彪( ),杨太保
),杨太保
收稿日期:2019-02-11
修回日期:2019-04-17
出版日期:2019-04-20
发布日期:2019-05-30
基金资助:
ZHANG Fu-Guang,ZENG Biao(),YANG Tai-Bao
Received:2019-02-11
Revised:2019-04-17
Online:2019-04-20
Published:2019-05-30
Supported by:摘要:
高寒荒漠作为青藏高原植被带谱的顶端类型广泛分布于祁连山高海拔地区, 其生长和分布条件与周边区域差异明显, 对气候变化的响应更为敏感, 且研究较少。该文利用1990年以来的Landsat TM、OLI数据, 采用决策树分类和人工目视解译方法, 提取了祁连山高寒荒漠的分布范围。结合气候变化情况, 综合分析了气候变化背景下近30年祁连山高寒荒漠分布的动态变化及其时空差异。结果表明: (1)近30年增温气候变化过程中, 祁连山高寒荒漠分布范围呈萎缩趋势, 萎缩速率约为348.3 km 2·a -1, 萎缩变化幅度表现为西段>中段>东段, 局部地段上存在扩张现象。上述现象导致高寒荒漠下界平均海拔以每10年约15 m的平均速率向更高海拔推进, 向上推进幅度为西段>东段>中段; (2)受水热条件控制, 近30年祁连山高寒荒漠分布动态变化集中分布在低坡度地区。由于水热背景条件的空间差异, 祁连山东段和中段阳坡上高寒荒漠分布动态变化大于阴坡, 而在祁连山西段表现相反; (3) 1990年以来, 祁连山增温显著, 降水量微弱增加。在气候变化以及区域地形限制共同影响下, 祁连山高寒荒漠分布变化时空差异明显, 且过渡带上归一化植被指数与气温相关性高于降水量。以上结果表明, 气候变化影响祁连山高寒荒漠分布动态变化及其空间差异, 但气温是主要的影响因子, 增温促进了高寒荒漠下接植被带主体高寒草甸的生长。
张富广, 曾彪, 杨太保. 气候变化背景下近30年祁连山高寒荒漠分布时空变化. 植物生态学报, 2019, 43(4): 305-319. DOI: 10.17521/cjpe.2018.0241
ZHANG Fu-Guang, ZENG Biao, YANG Tai-Bao. Spatiotemporal distribution changes in alpine desert belt in Qilian Mountains under climate changes in past 30 years. Chinese Journal of Plant Ecology, 2019, 43(4): 305-319. DOI: 10.17521/cjpe.2018.0241
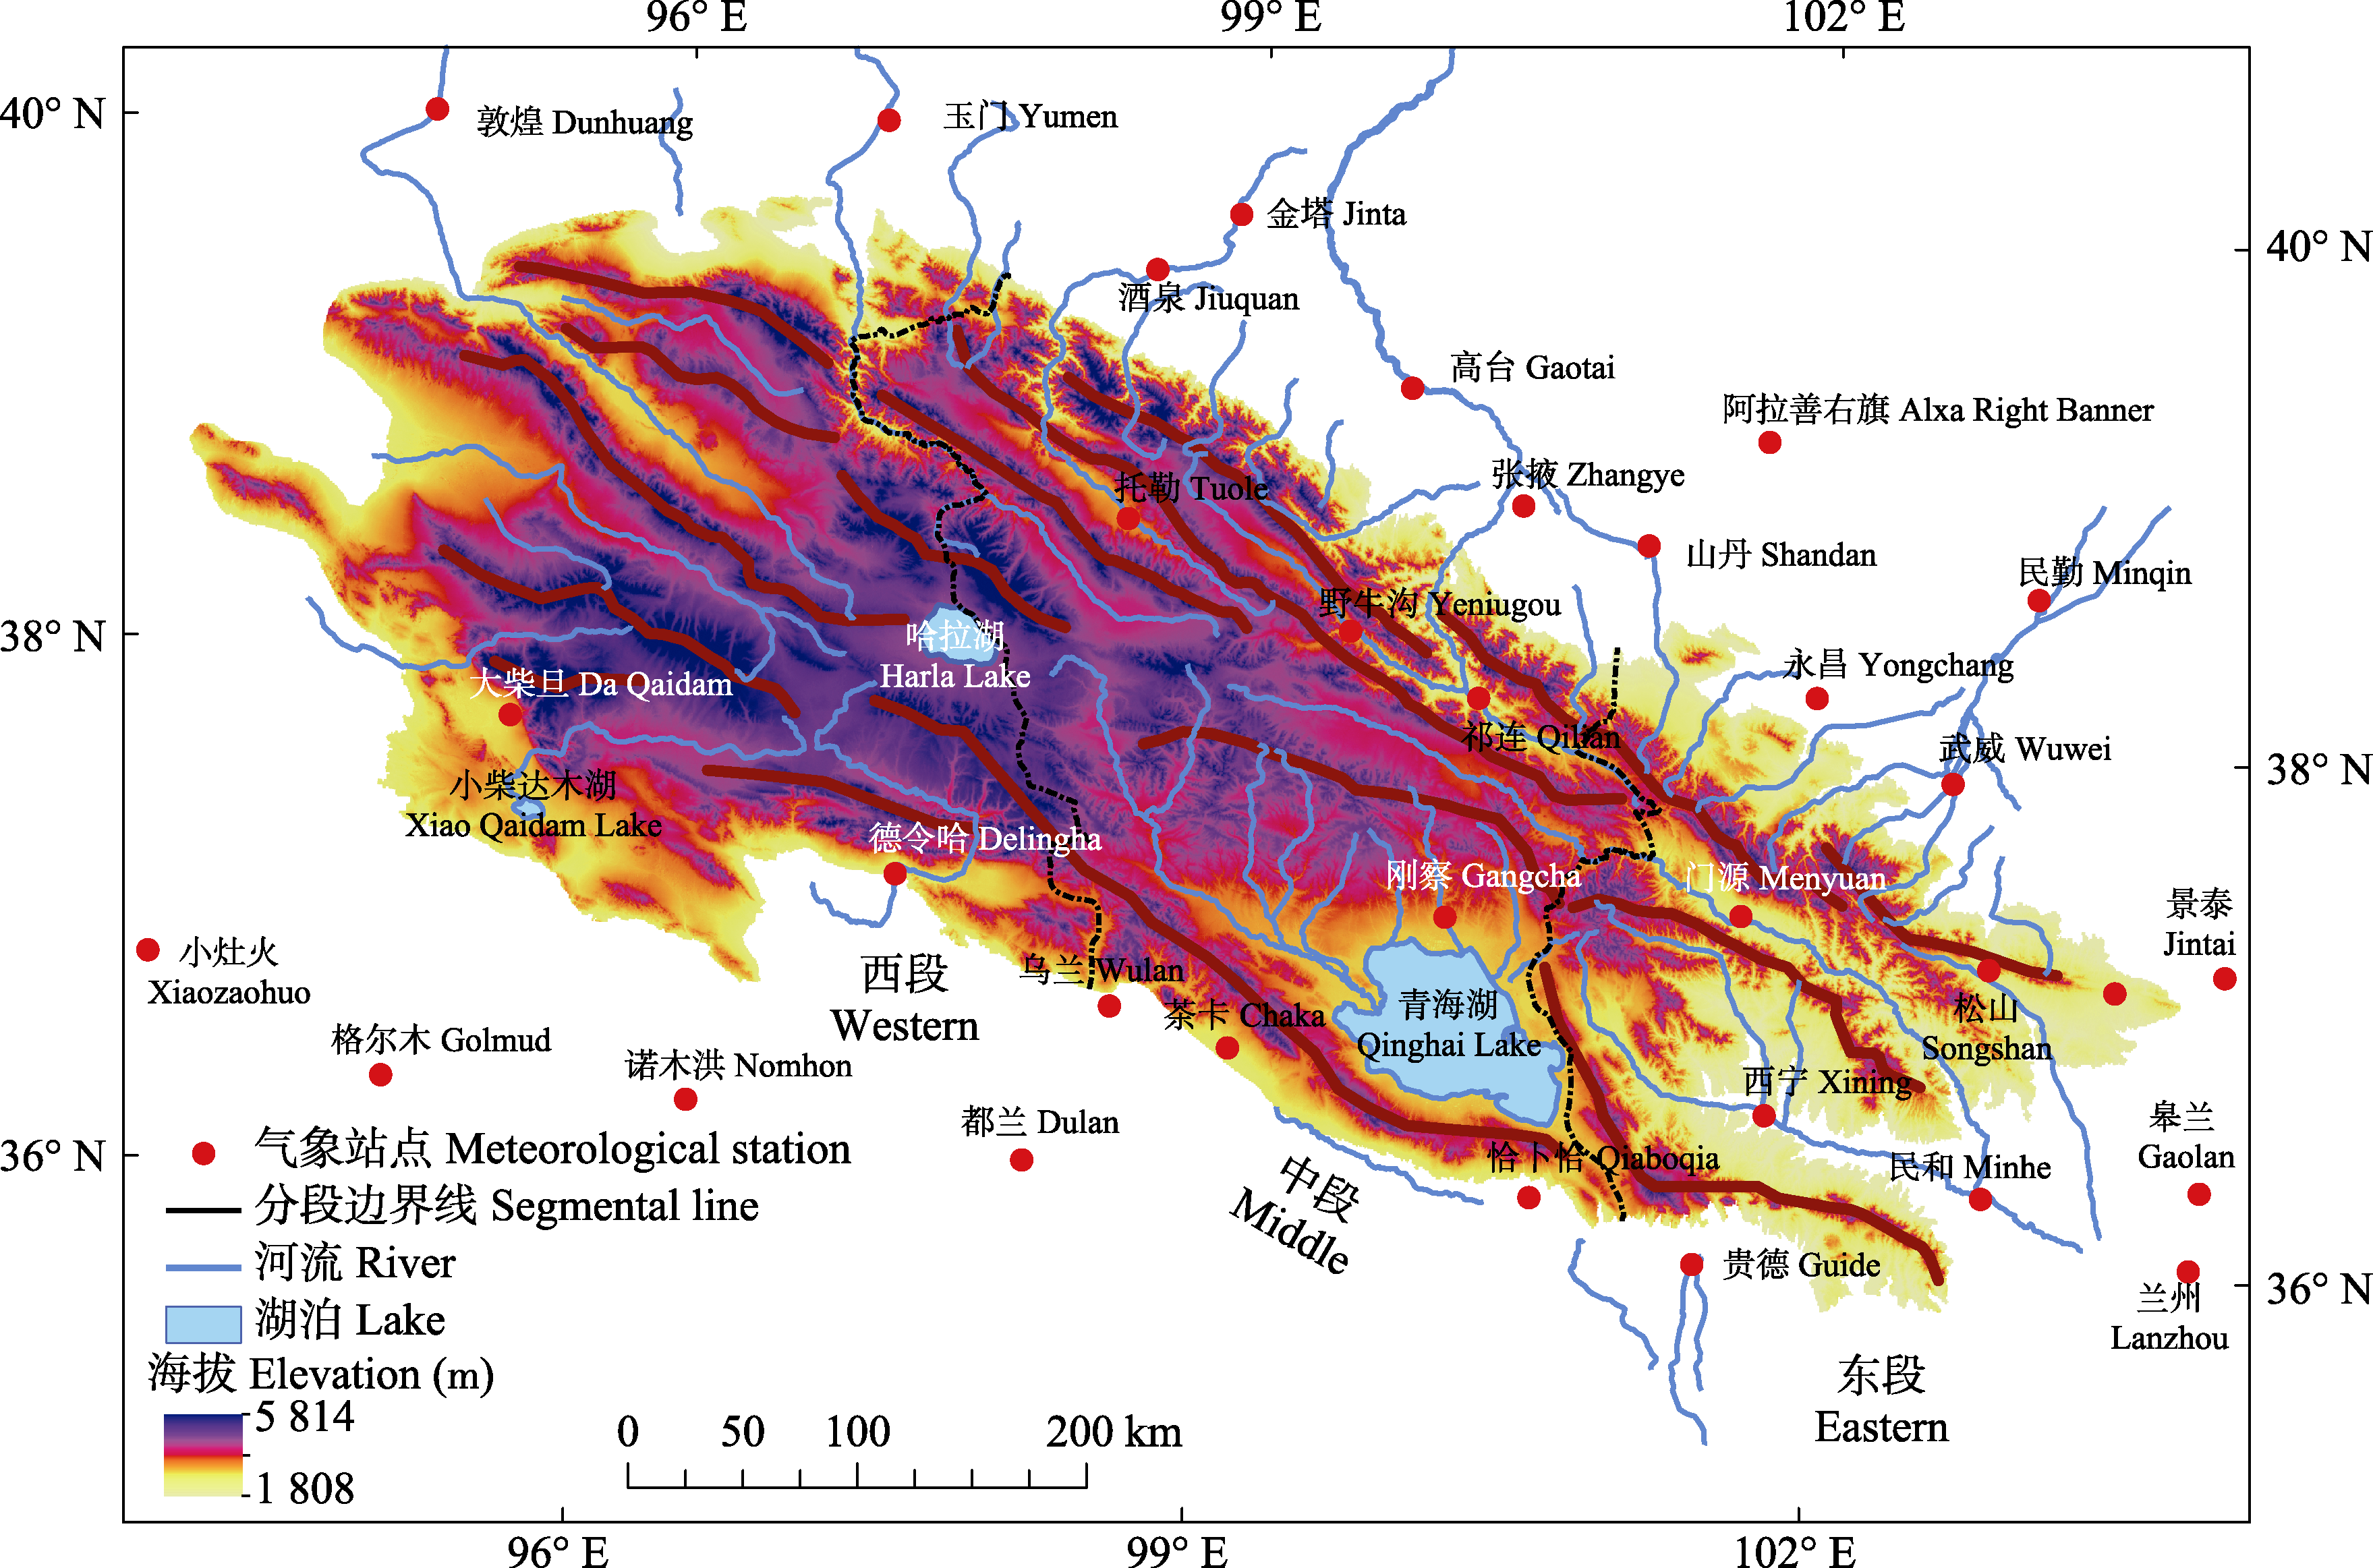
图1 祁连山高寒荒漠研究区位置图。
Fig. 1 Study area of the alpine desert belt in the Qilian Mountains.
| 年份 Year | 2000 | 2001 | 2002 | 2003 | 2004 | 2005 | 2006 |
|---|---|---|---|---|---|---|---|
| 相关系数Correlation coefficient | 0.865** | 0.886** | 0.814** | 0.736** | 0.891** | 0.893** | 0.838** |
表1 祁连山高寒荒漠2000-2006年GIMMS NDVI和MODIS NDVI数据一致性检验
Table 1 Correlation analysis of GIMMS NDVI and MODIS NDVI in 2000-2006 of the alpine desert belt in the Qilian Mountains
| 年份 Year | 2000 | 2001 | 2002 | 2003 | 2004 | 2005 | 2006 |
|---|---|---|---|---|---|---|---|
| 相关系数Correlation coefficient | 0.865** | 0.886** | 0.814** | 0.736** | 0.891** | 0.893** | 0.838** |
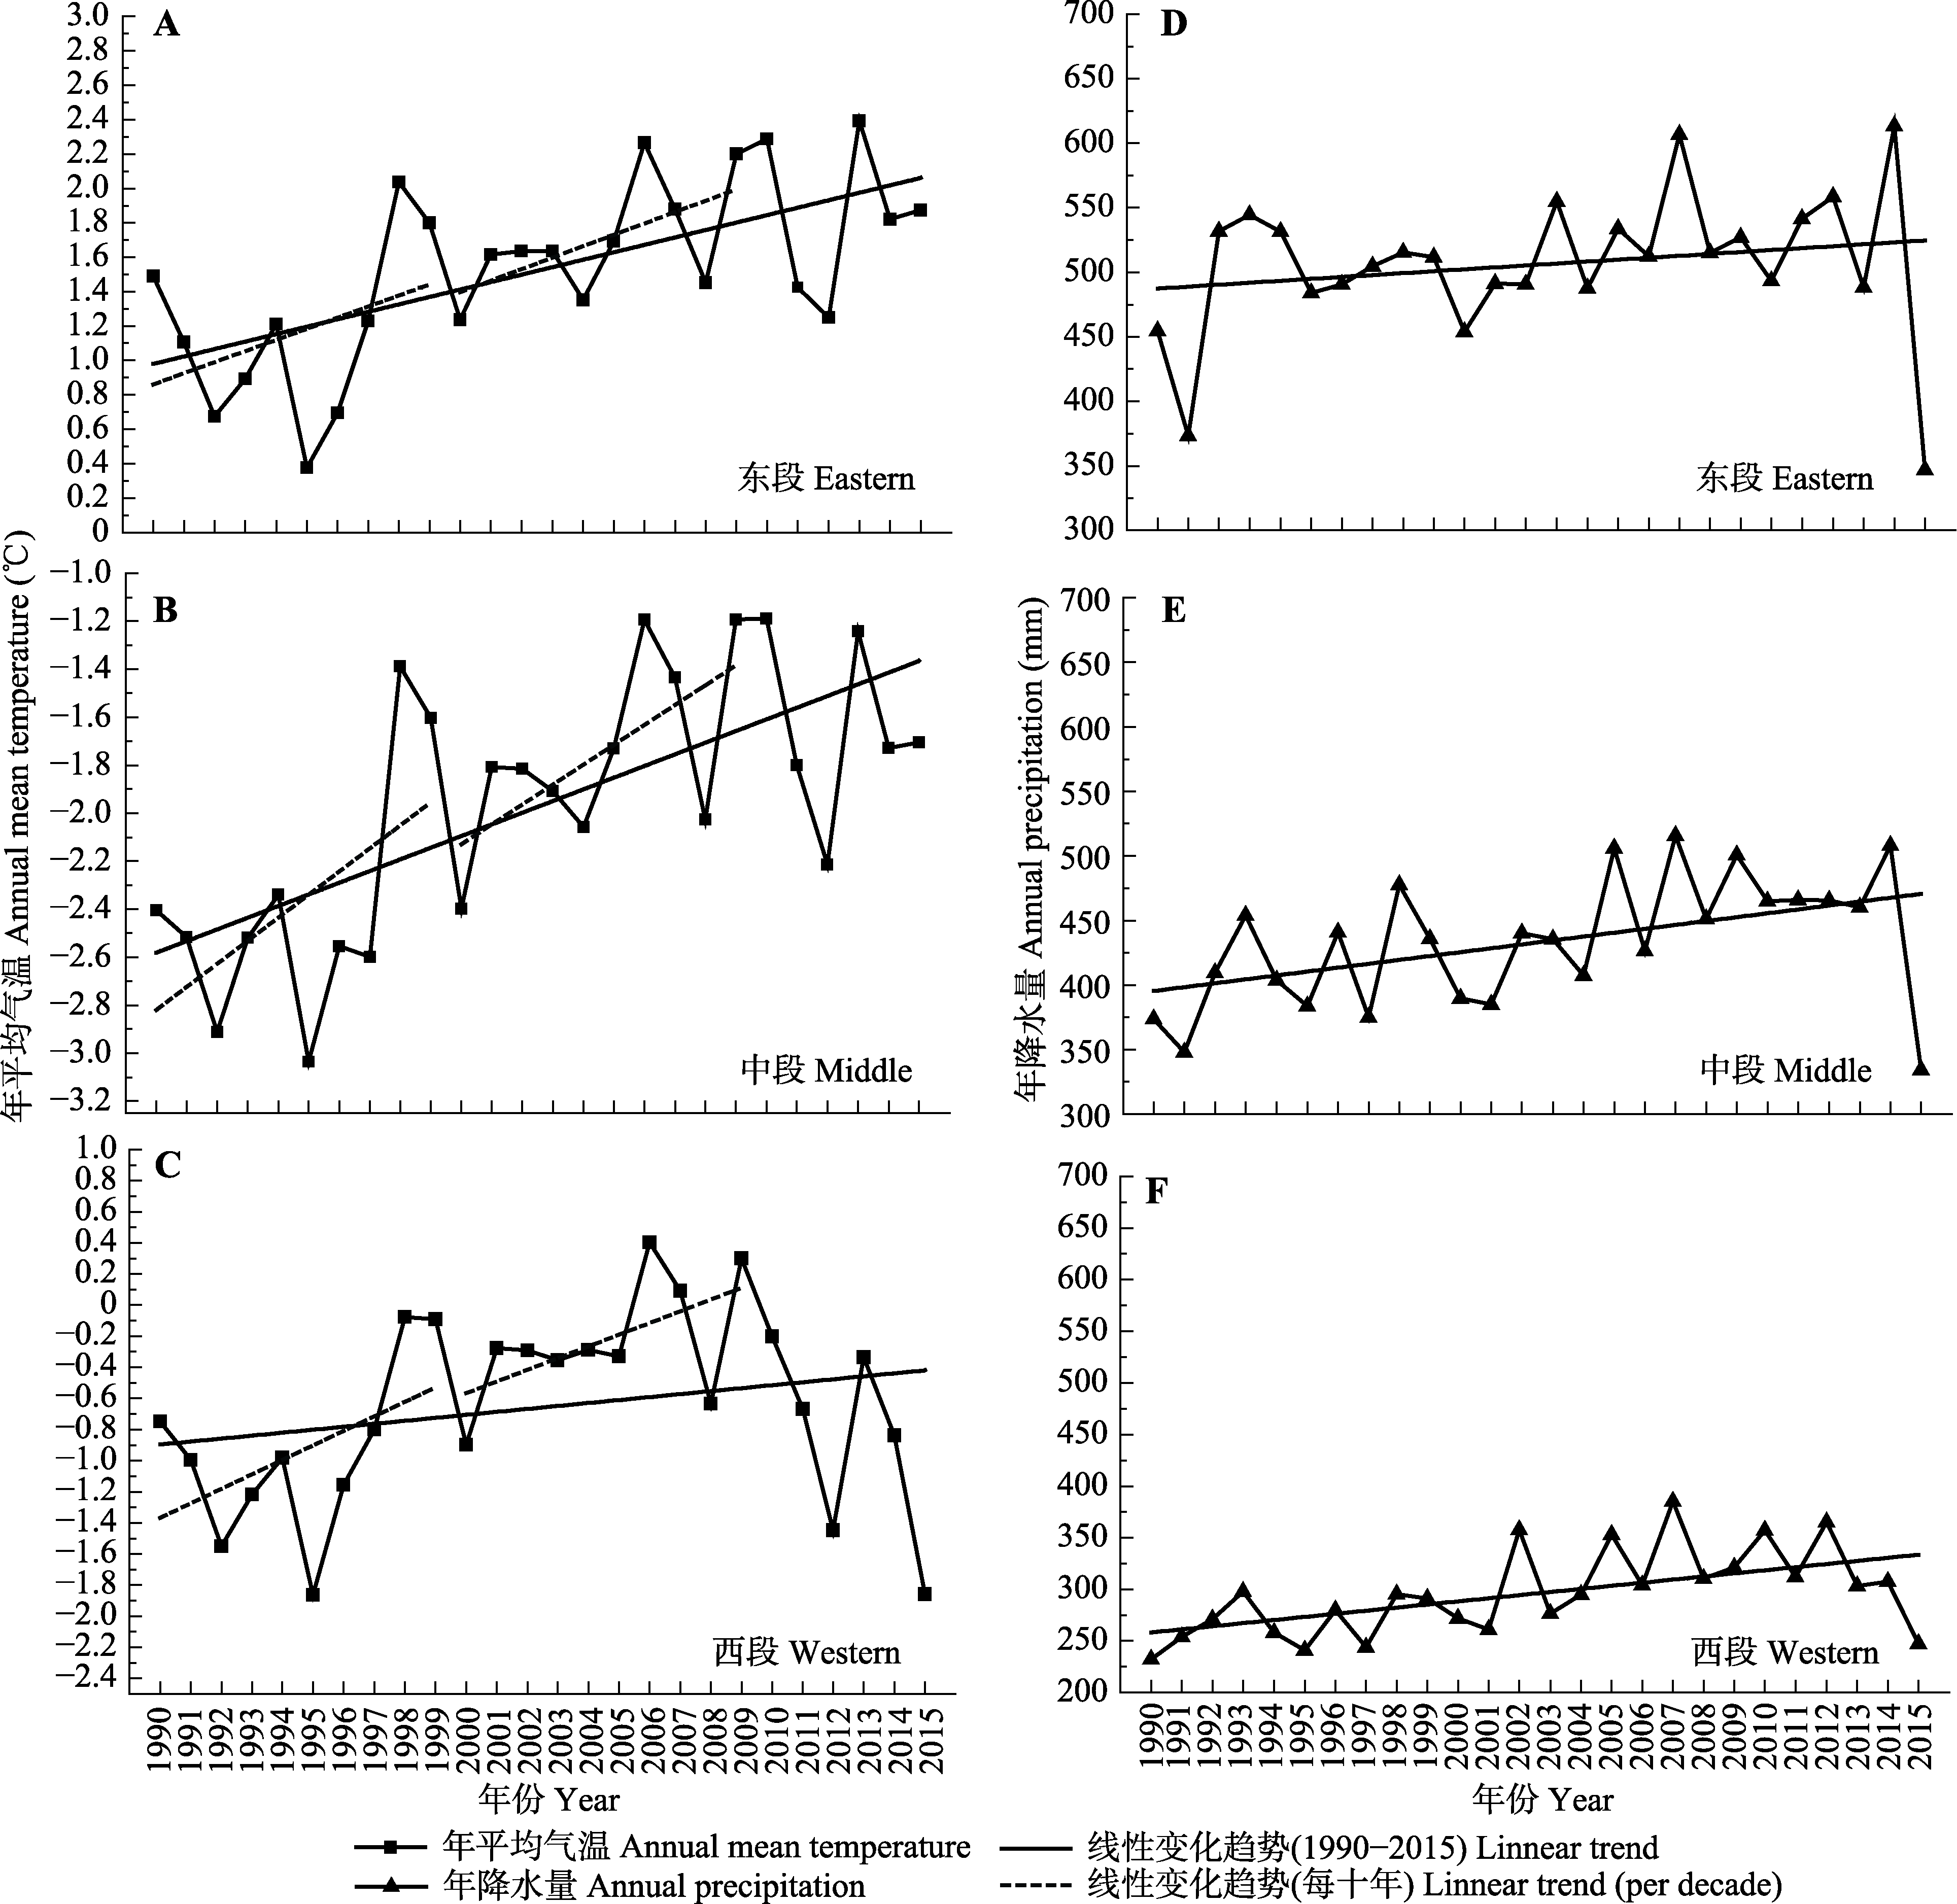
图2 1990-2015年祁连山年平均气温和年降水量变化。
Fig. 2 Variations in the annual mean temperature and annual precipitation measured in the Qilian Mountains for 1990-2015.
| 东段 Eastern | 中段 Middle | 西段 Western | ||||
|---|---|---|---|---|---|---|
| T | P | T | P | T | P | |
| 1月 Jan. | 0.022 | 0.016 | 0.053 | -0.020 | 0.006 | 0.006 |
| 2月 Feb. | 0.055 | -0.021 | 0.088 | 0.070 | 0.059 | 0.018 |
| 3月 Mar. | 0.051 | -0.084 | 0.023 | -0.185 | 0.041 | -0.185 |
| 4月 Apr. | 0.082* | -0.406 | 0.067 | -0.030 | 0.067 | 0.053 |
| 5月 May | 0.061* | 0.273 | 0.050* | 0.860* | 0.059* | 0.464* |
| 6月 June | 0.057** | 0.357 | 0.052** | 0.540 | 0.042* | 0.653 |
| 7月 July | 0.044* | -0.691 | 0.061* | 0.383 | 0.059 | 0.295 |
| 8月 Aug. | 0.040* | 1.020 | 0.070** | 0.731 | 0.075** | -0.102 |
| 9月 Sept. | 0.030 | 1.633* | 0.040 | 1.327** | 0.022 | 0.479 |
| 10月 Oct. | 0.072** | 0.492 | 0.074** | 0.133 | 0.071** | 0.112 |
| 11月 Nov. | -0.002 | 0.130 | 0.012 | 0.007 | 0.023 | -0.110 |
| 12月 Dec. | -0.045* | 0.048 | 0.013 | -0.008 | -0.007 | 0.037 |
表2 1990-2015年祁连山高寒荒漠研究区月平均气温(T)和月降水量(P)变化趋势
Table 2 Monthly mean air temperature (T) and precipitation (P) trends of the alpine desert belt in the Qilian Mountains during 1990-2015
| 东段 Eastern | 中段 Middle | 西段 Western | ||||
|---|---|---|---|---|---|---|
| T | P | T | P | T | P | |
| 1月 Jan. | 0.022 | 0.016 | 0.053 | -0.020 | 0.006 | 0.006 |
| 2月 Feb. | 0.055 | -0.021 | 0.088 | 0.070 | 0.059 | 0.018 |
| 3月 Mar. | 0.051 | -0.084 | 0.023 | -0.185 | 0.041 | -0.185 |
| 4月 Apr. | 0.082* | -0.406 | 0.067 | -0.030 | 0.067 | 0.053 |
| 5月 May | 0.061* | 0.273 | 0.050* | 0.860* | 0.059* | 0.464* |
| 6月 June | 0.057** | 0.357 | 0.052** | 0.540 | 0.042* | 0.653 |
| 7月 July | 0.044* | -0.691 | 0.061* | 0.383 | 0.059 | 0.295 |
| 8月 Aug. | 0.040* | 1.020 | 0.070** | 0.731 | 0.075** | -0.102 |
| 9月 Sept. | 0.030 | 1.633* | 0.040 | 1.327** | 0.022 | 0.479 |
| 10月 Oct. | 0.072** | 0.492 | 0.074** | 0.133 | 0.071** | 0.112 |
| 11月 Nov. | -0.002 | 0.130 | 0.012 | 0.007 | 0.023 | -0.110 |
| 12月 Dec. | -0.045* | 0.048 | 0.013 | -0.008 | -0.007 | 0.037 |
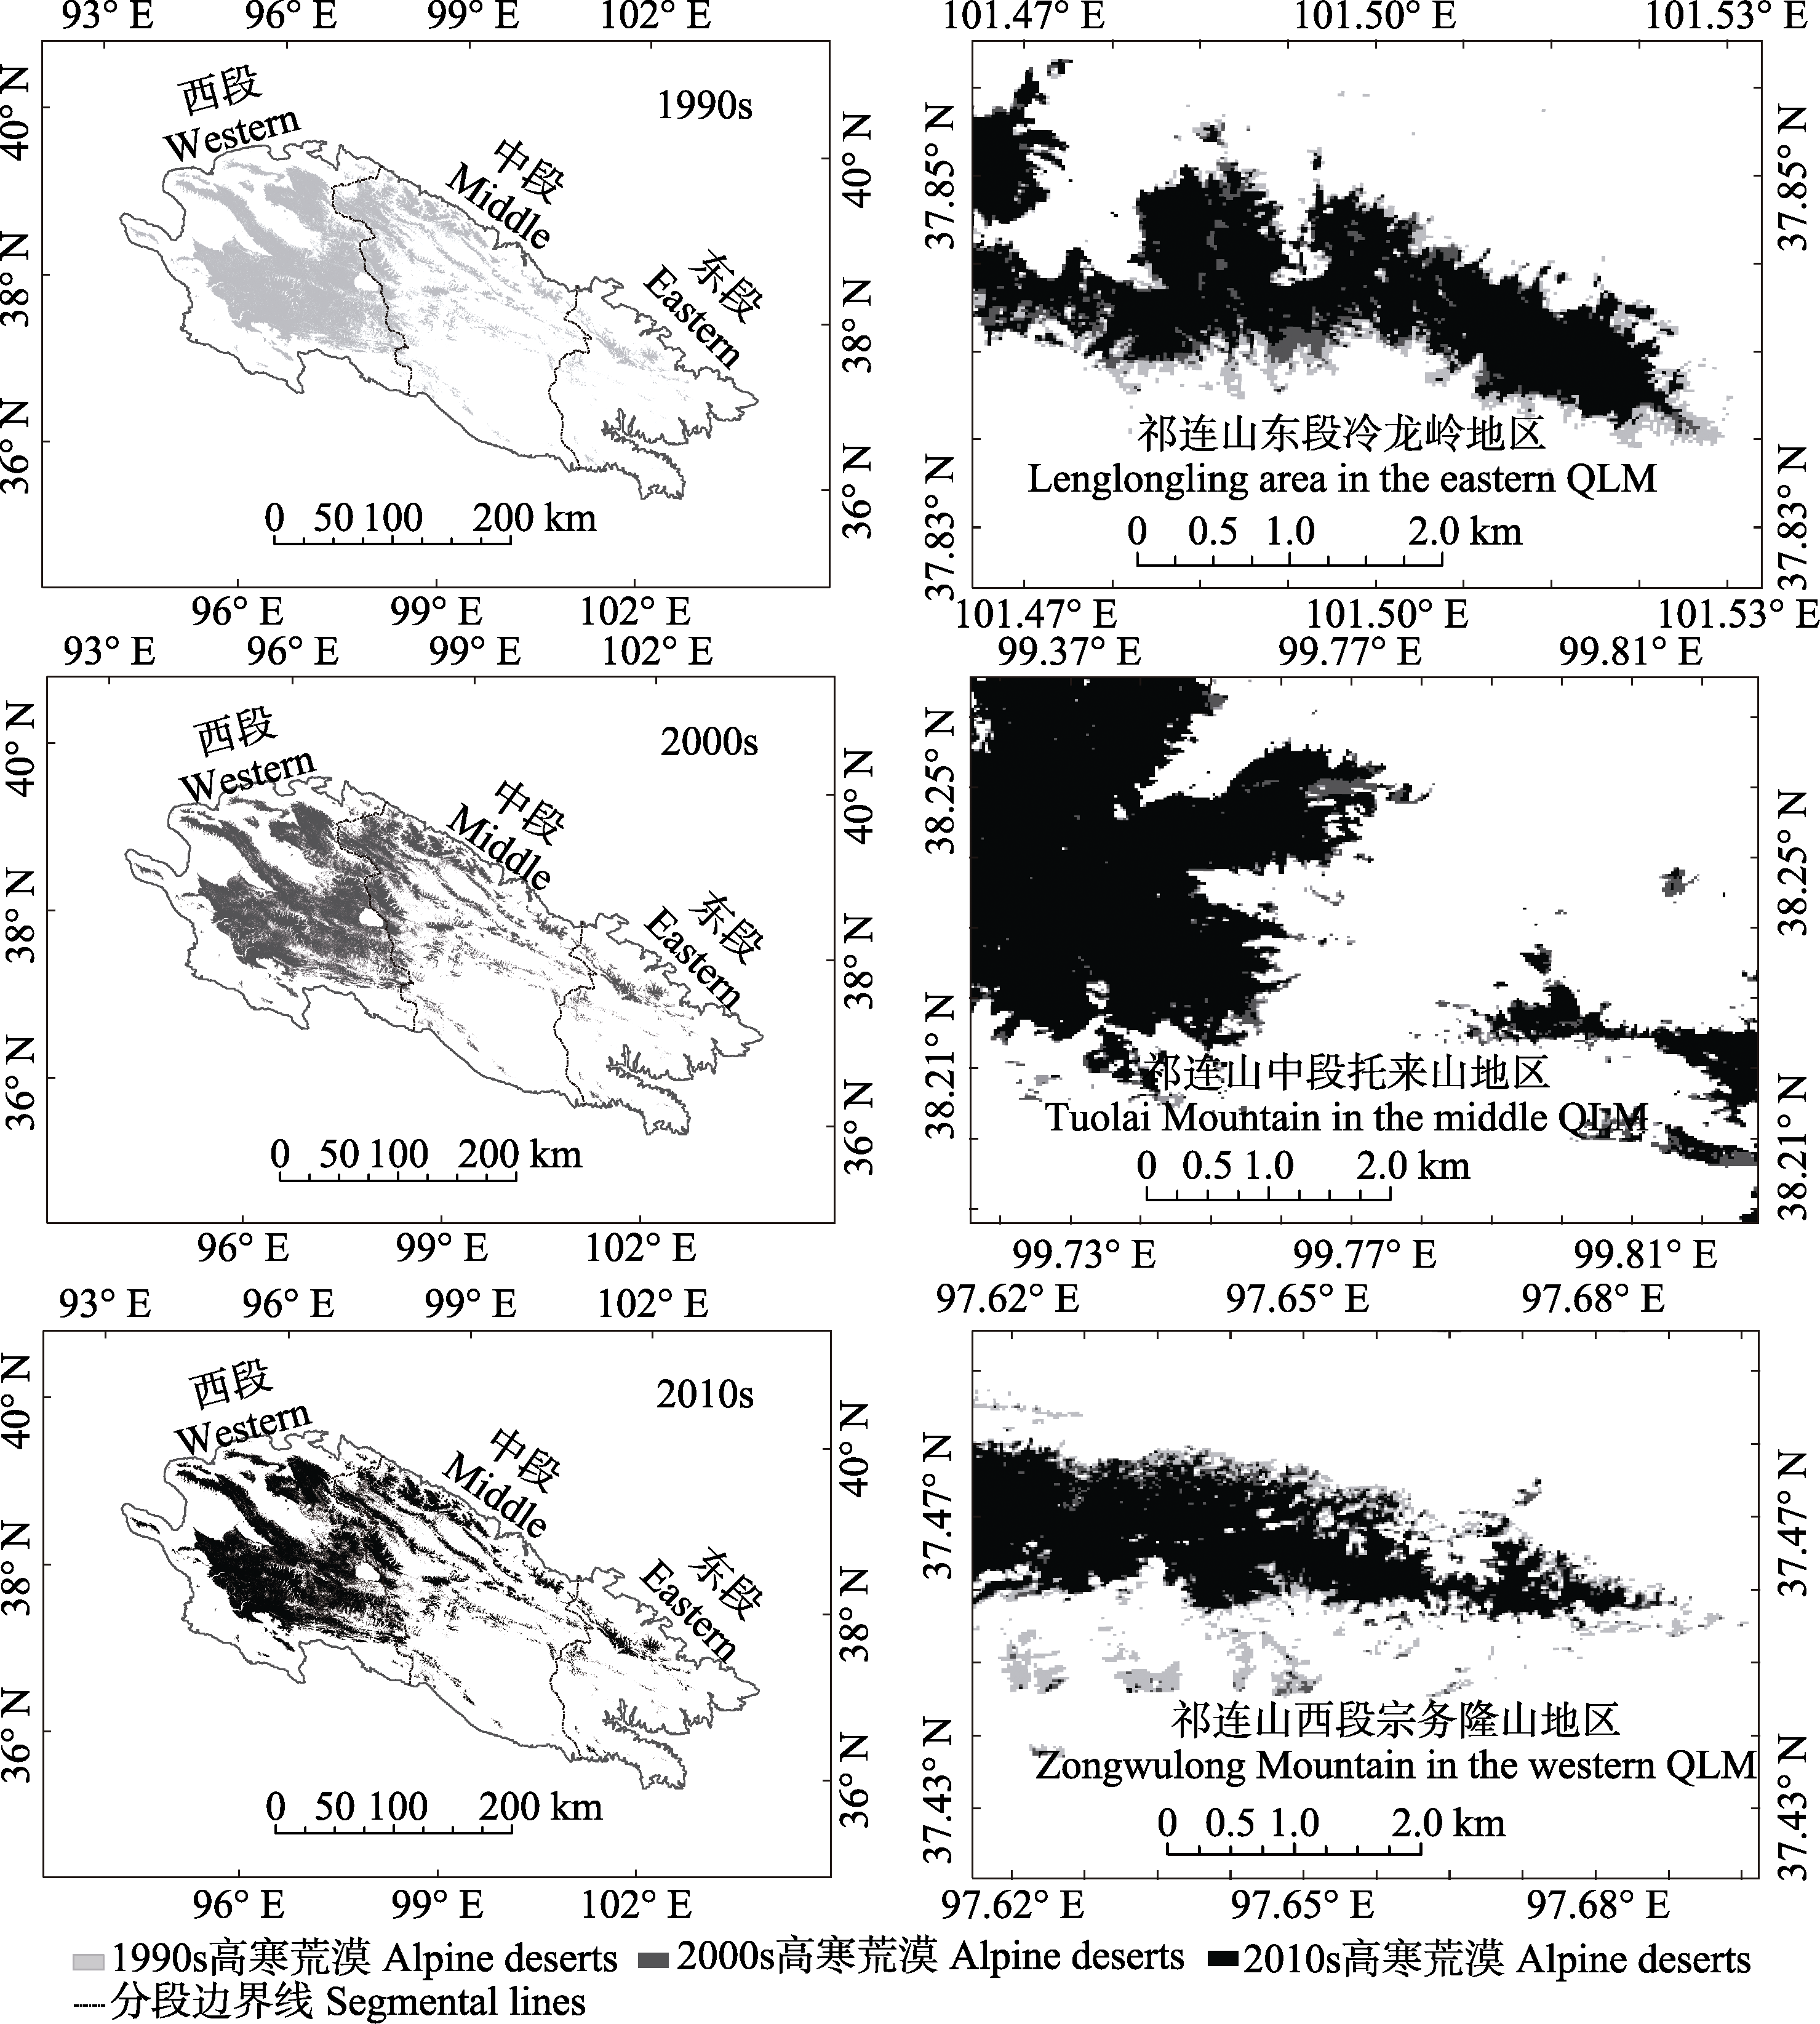
图3 1990S、2000S和2010S祁连山高寒荒漠分布变化。1990S、2000S、2010S分别表示1990-1999、2000-2009、2010-2015三个年代际祁连山区高寒荒漠的稳定分布范围。
Fig. 3 Distribution range of the alpine desert in the Qilian Mountains (QLM) in the 1990S, 2000S, and 2010S, respectively. 1990S, 2000S, 2010S indicate the stable distribution range of the alpine desert in 1990-1999, 2000-2009, 2010-2015, respectively.
| 年代 Years | ||||
|---|---|---|---|---|
| 1990S | 2000S | 2010S | ||
| 祁连山区 QLM | 高寒荒漠面积 Alpine desert area (km2) | 53 061.69 | 47 135.91 | 42 569.46 |
| 萎缩量 Shrunk area of the alpine desert (km2) | 5 925.79 | 4 566.45 | - | |
| 面积变化率 Area change ratio of the alpine desert | 0.11 | 0.10 | - | |
| 东段 Eastern | 高寒荒漠面积 Alpine desert area (km2) | 1 926.49 | 1 805.77 | 1 720.33 |
| 萎缩量 Shrunk area of the alpine desert (km2) | 120.72 | 85.44 | - | |
| 面积变化率 Area change ratio of the alpine desert | 0.06 | 0.05 | - | |
| 中段 Middle | 高寒荒漠面积 Alpine desert area (km2) | 15 221.68 | 14 019.75 | 11 710.50 |
| 萎缩量 Shrunk area of the alpine desert (km2) | 1 201.92 | 2 309.26 | - | |
| 面积变化率 Area change ratio of the alpine desert | 0.08 | 0.16 | - | |
| 西段 Western | 高寒荒漠面积 Alpine desert area (km2) | 35 936.33 | 31 310.39 | 29 138.63 |
| 萎缩量 Shrunk area of the alpine desert (km2) | 4 625.94 | 2 171.75 | - | |
| 面积变化率 Area change ratio of the alpine desert | 0.13 | 0.07 | - | |
表3 1990S、2000S和2010S祁连山区高寒荒漠分布面积变化
Table 3 Area change in alpine deserts distribution in the Qilian Mountains (QLM) in the 1990S、2000S and 2010S
| 年代 Years | ||||
|---|---|---|---|---|
| 1990S | 2000S | 2010S | ||
| 祁连山区 QLM | 高寒荒漠面积 Alpine desert area (km2) | 53 061.69 | 47 135.91 | 42 569.46 |
| 萎缩量 Shrunk area of the alpine desert (km2) | 5 925.79 | 4 566.45 | - | |
| 面积变化率 Area change ratio of the alpine desert | 0.11 | 0.10 | - | |
| 东段 Eastern | 高寒荒漠面积 Alpine desert area (km2) | 1 926.49 | 1 805.77 | 1 720.33 |
| 萎缩量 Shrunk area of the alpine desert (km2) | 120.72 | 85.44 | - | |
| 面积变化率 Area change ratio of the alpine desert | 0.06 | 0.05 | - | |
| 中段 Middle | 高寒荒漠面积 Alpine desert area (km2) | 15 221.68 | 14 019.75 | 11 710.50 |
| 萎缩量 Shrunk area of the alpine desert (km2) | 1 201.92 | 2 309.26 | - | |
| 面积变化率 Area change ratio of the alpine desert | 0.08 | 0.16 | - | |
| 西段 Western | 高寒荒漠面积 Alpine desert area (km2) | 35 936.33 | 31 310.39 | 29 138.63 |
| 萎缩量 Shrunk area of the alpine desert (km2) | 4 625.94 | 2 171.75 | - | |
| 面积变化率 Area change ratio of the alpine desert | 0.13 | 0.07 | - | |

图4 1990S、2000S、2010S祁连山高寒荒漠在不同海拔高度带上的变化。1990S、2000S、2010S同图3。
Fig. 4 Changes in the distribution of the alpine desert at different elevations in the Qilian Mountains in the 1990S, 2000S and 2010s. The meanings of 1990S, 2000S, 2010S are shown in Fig. 3.
| 年代 Years | 东段 Eastern | 中段 Middle | 西段 Western | |||
|---|---|---|---|---|---|---|
| 下界平均海拔 Average elevation (m) | 向上推进 Upward moving (m) | 下界平均海拔 Average elevation (m) | 向上推进 Upward moving (m) | 下界平均海拔 Average elevation (m) | 向上推进 Upward moving (m) | |
| 1990S | 3 914.45 | 4 042.80 | 4 159.05 | |||
| 33.83 | 8.25 | 59.51 | ||||
| 2000S | 3 948.28 | 4 051.05 | 4 218.56 | |||
| 6.40 | 26.97 | 3.31 | ||||
| 2010S | 3 954.68 | 4 078.02 | 4 221.87 | |||
| 总计 Sum | 40.23 | 35.22 | 62.82 | |||
表4 1990S、2000S和2010S祁连山高寒荒漠下界平均海拔变化
Table 4 Average elevation of the lower boundary of the alpine deserts in the Qilian Mountains in the 1990S、2000S and 2010S.
| 年代 Years | 东段 Eastern | 中段 Middle | 西段 Western | |||
|---|---|---|---|---|---|---|
| 下界平均海拔 Average elevation (m) | 向上推进 Upward moving (m) | 下界平均海拔 Average elevation (m) | 向上推进 Upward moving (m) | 下界平均海拔 Average elevation (m) | 向上推进 Upward moving (m) | |
| 1990S | 3 914.45 | 4 042.80 | 4 159.05 | |||
| 33.83 | 8.25 | 59.51 | ||||
| 2000S | 3 948.28 | 4 051.05 | 4 218.56 | |||
| 6.40 | 26.97 | 3.31 | ||||
| 2010S | 3 954.68 | 4 078.02 | 4 221.87 | |||
| 总计 Sum | 40.23 | 35.22 | 62.82 | |||
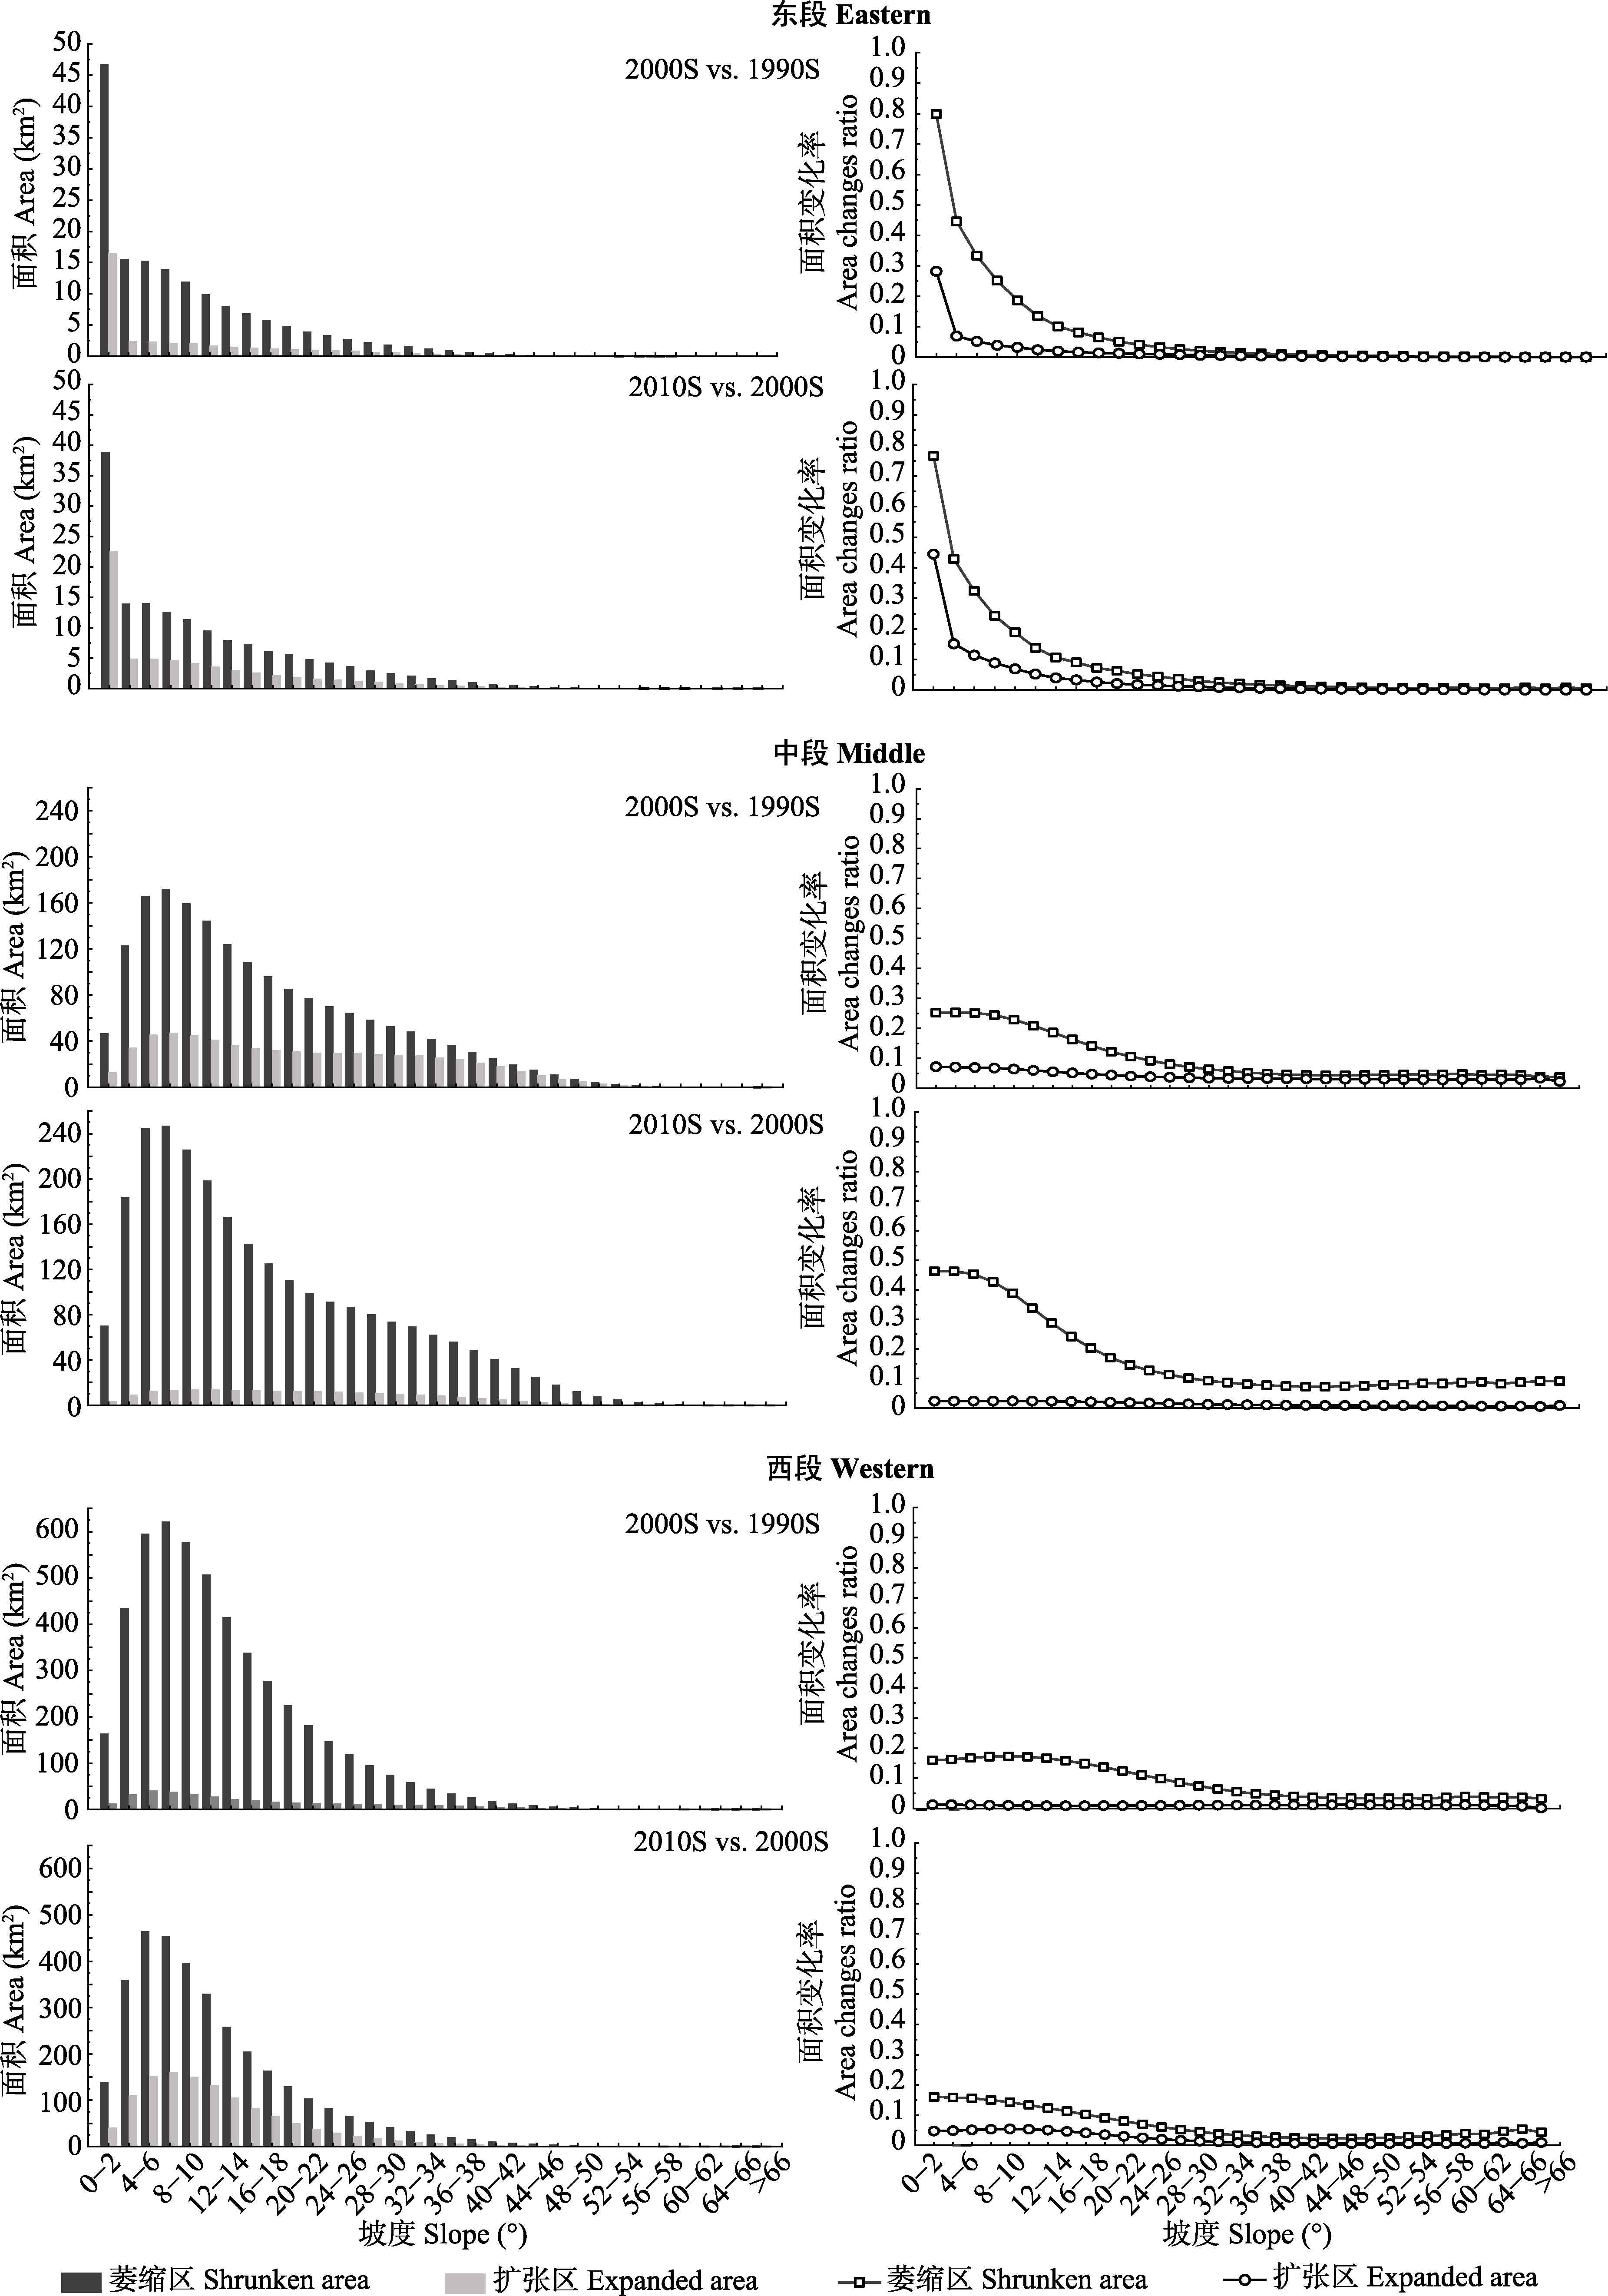
图5 1990S、2000S、2010S祁连山高寒荒漠在不同坡度带上的变化。1990S、2000S、2010S同图3。
Fig. 5 Changes in the distribution of the alpine desert at different slopes in the Qilian Mountains in the 1990S、2000S and 2010S. The meanings of 1990S, 2000S, 2010S are shown in Fig. 3.
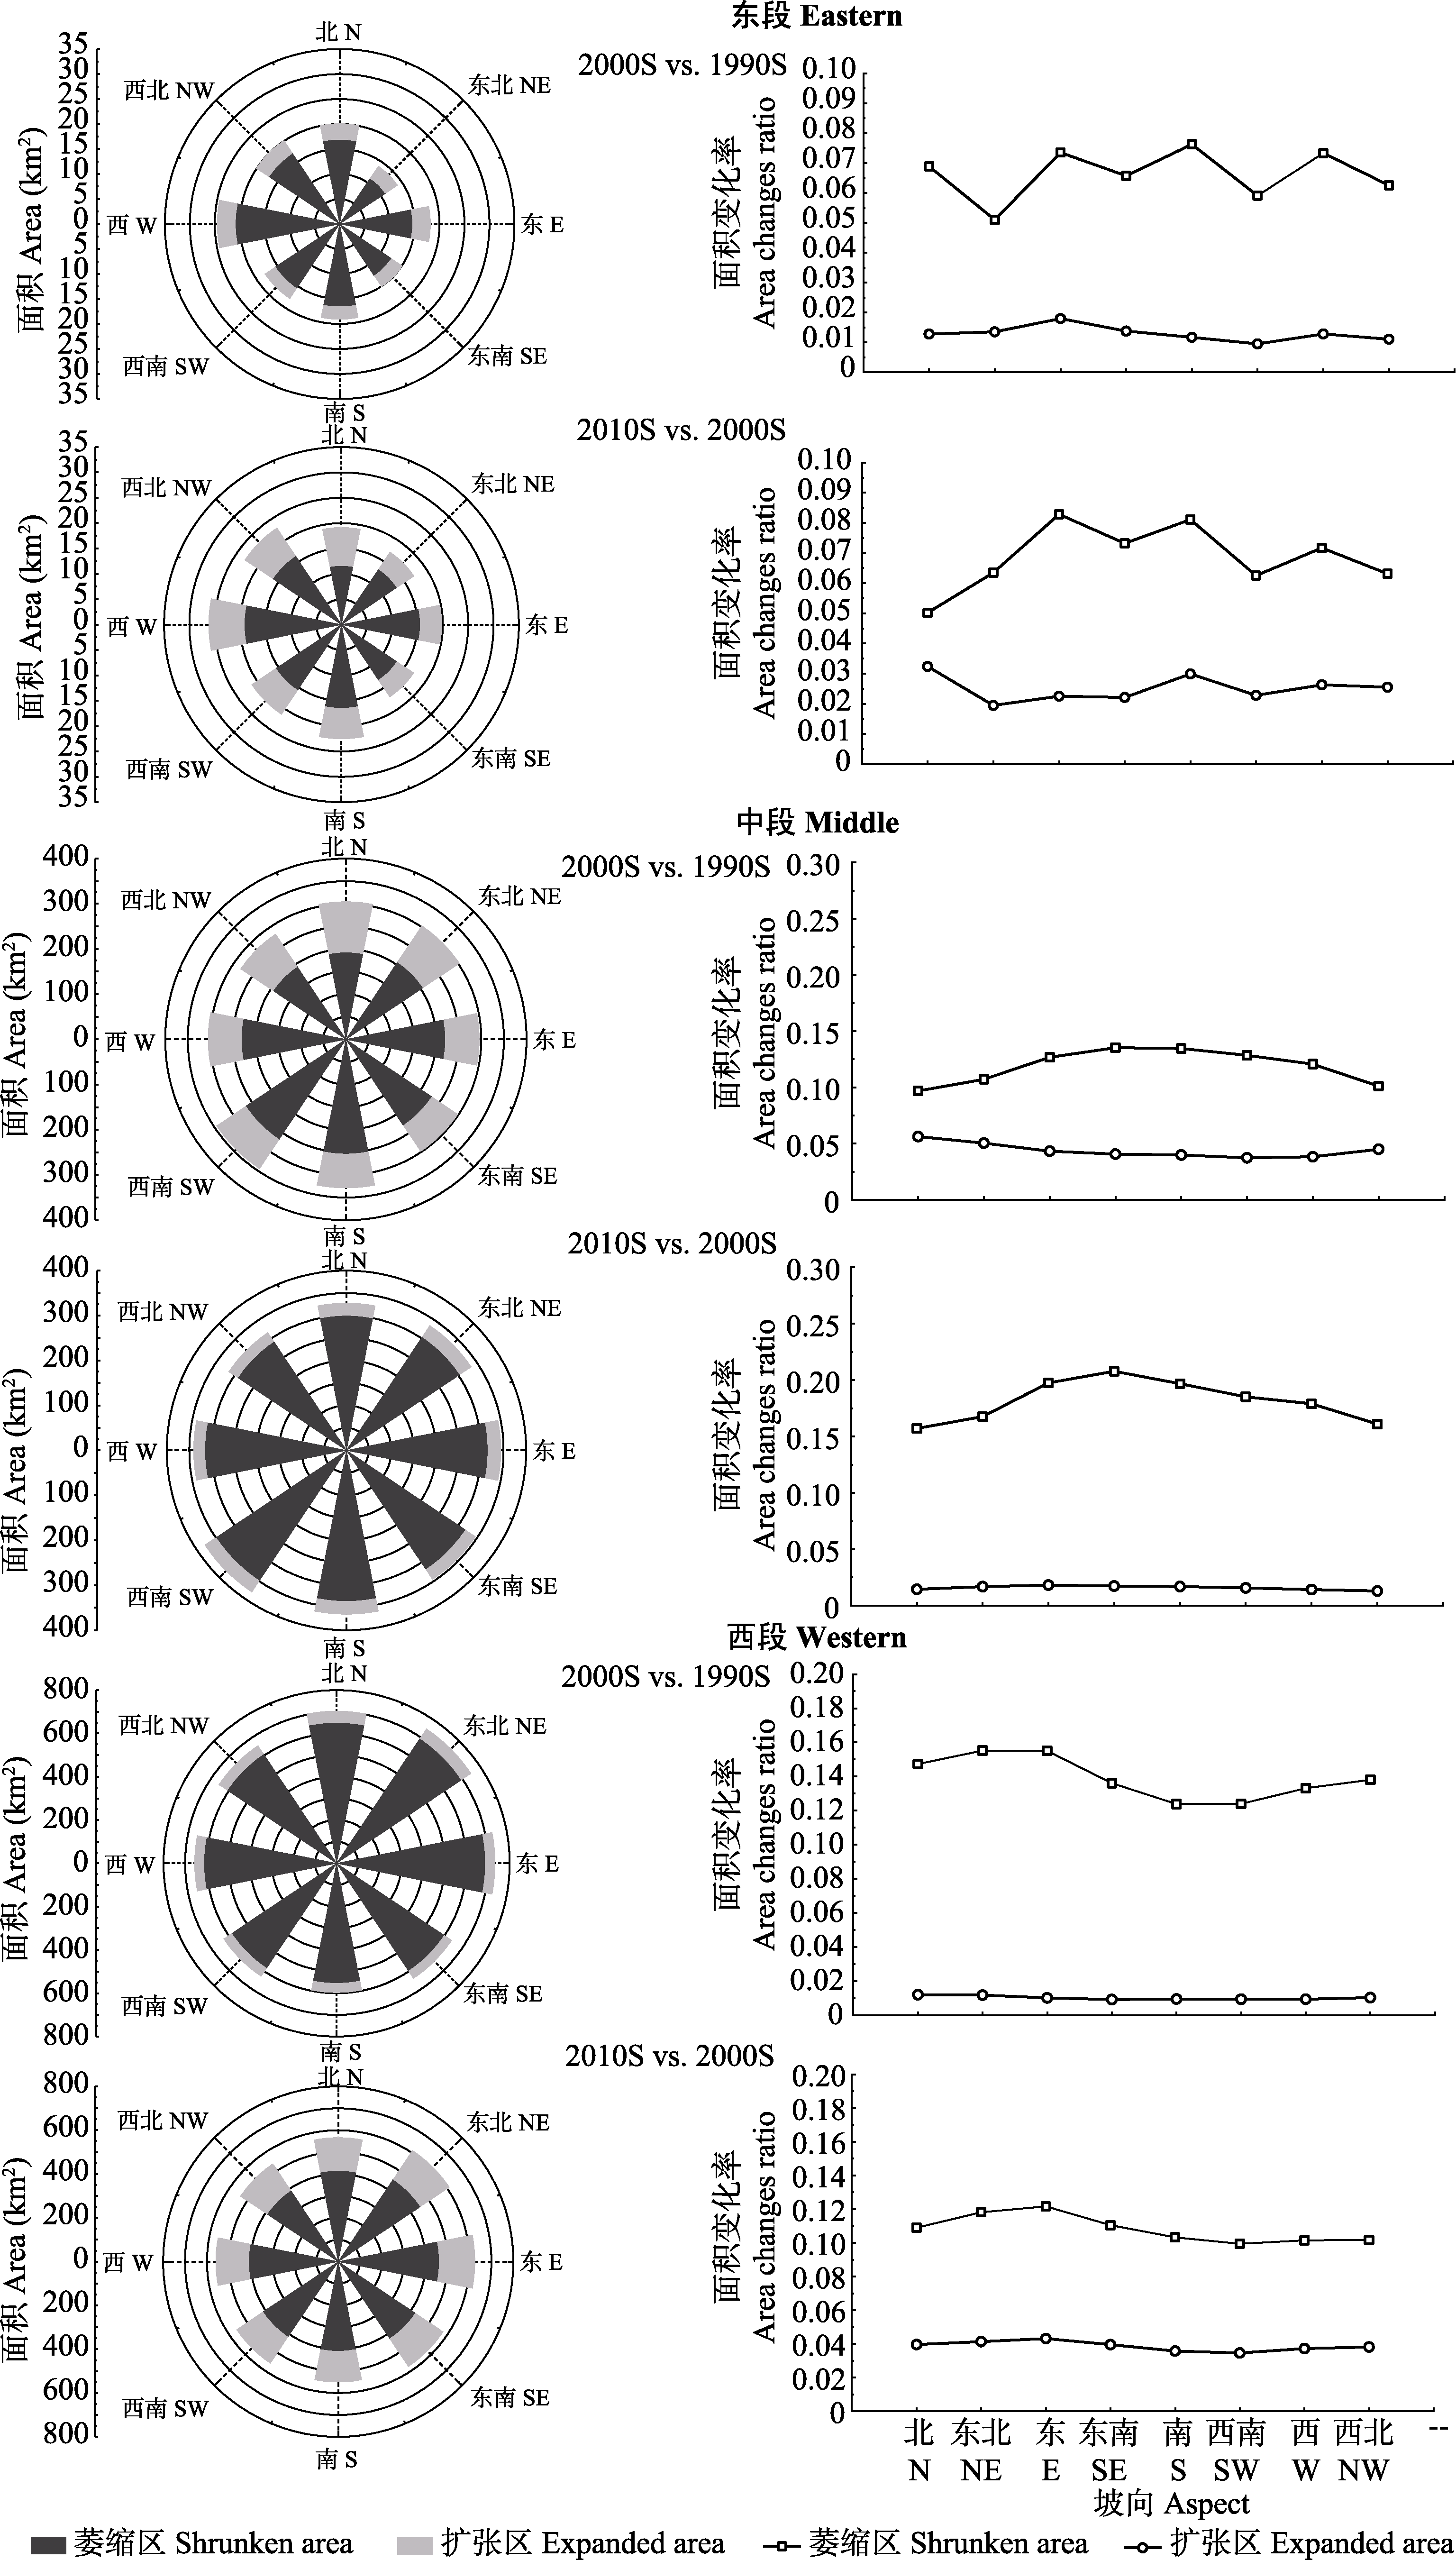
图6 1990S、2000S和2010S祁连山高寒荒漠在不同坡向上的变化。1990S、2000S、2010S同图3。
Fig. 6 Changes in the distribution of the alpine desert at different aspects in the Qilian Mountains in the 1990S, 2000S and 2010S. The meanings of 1990S, 2000S, 2010S are shown in Fig. 3.
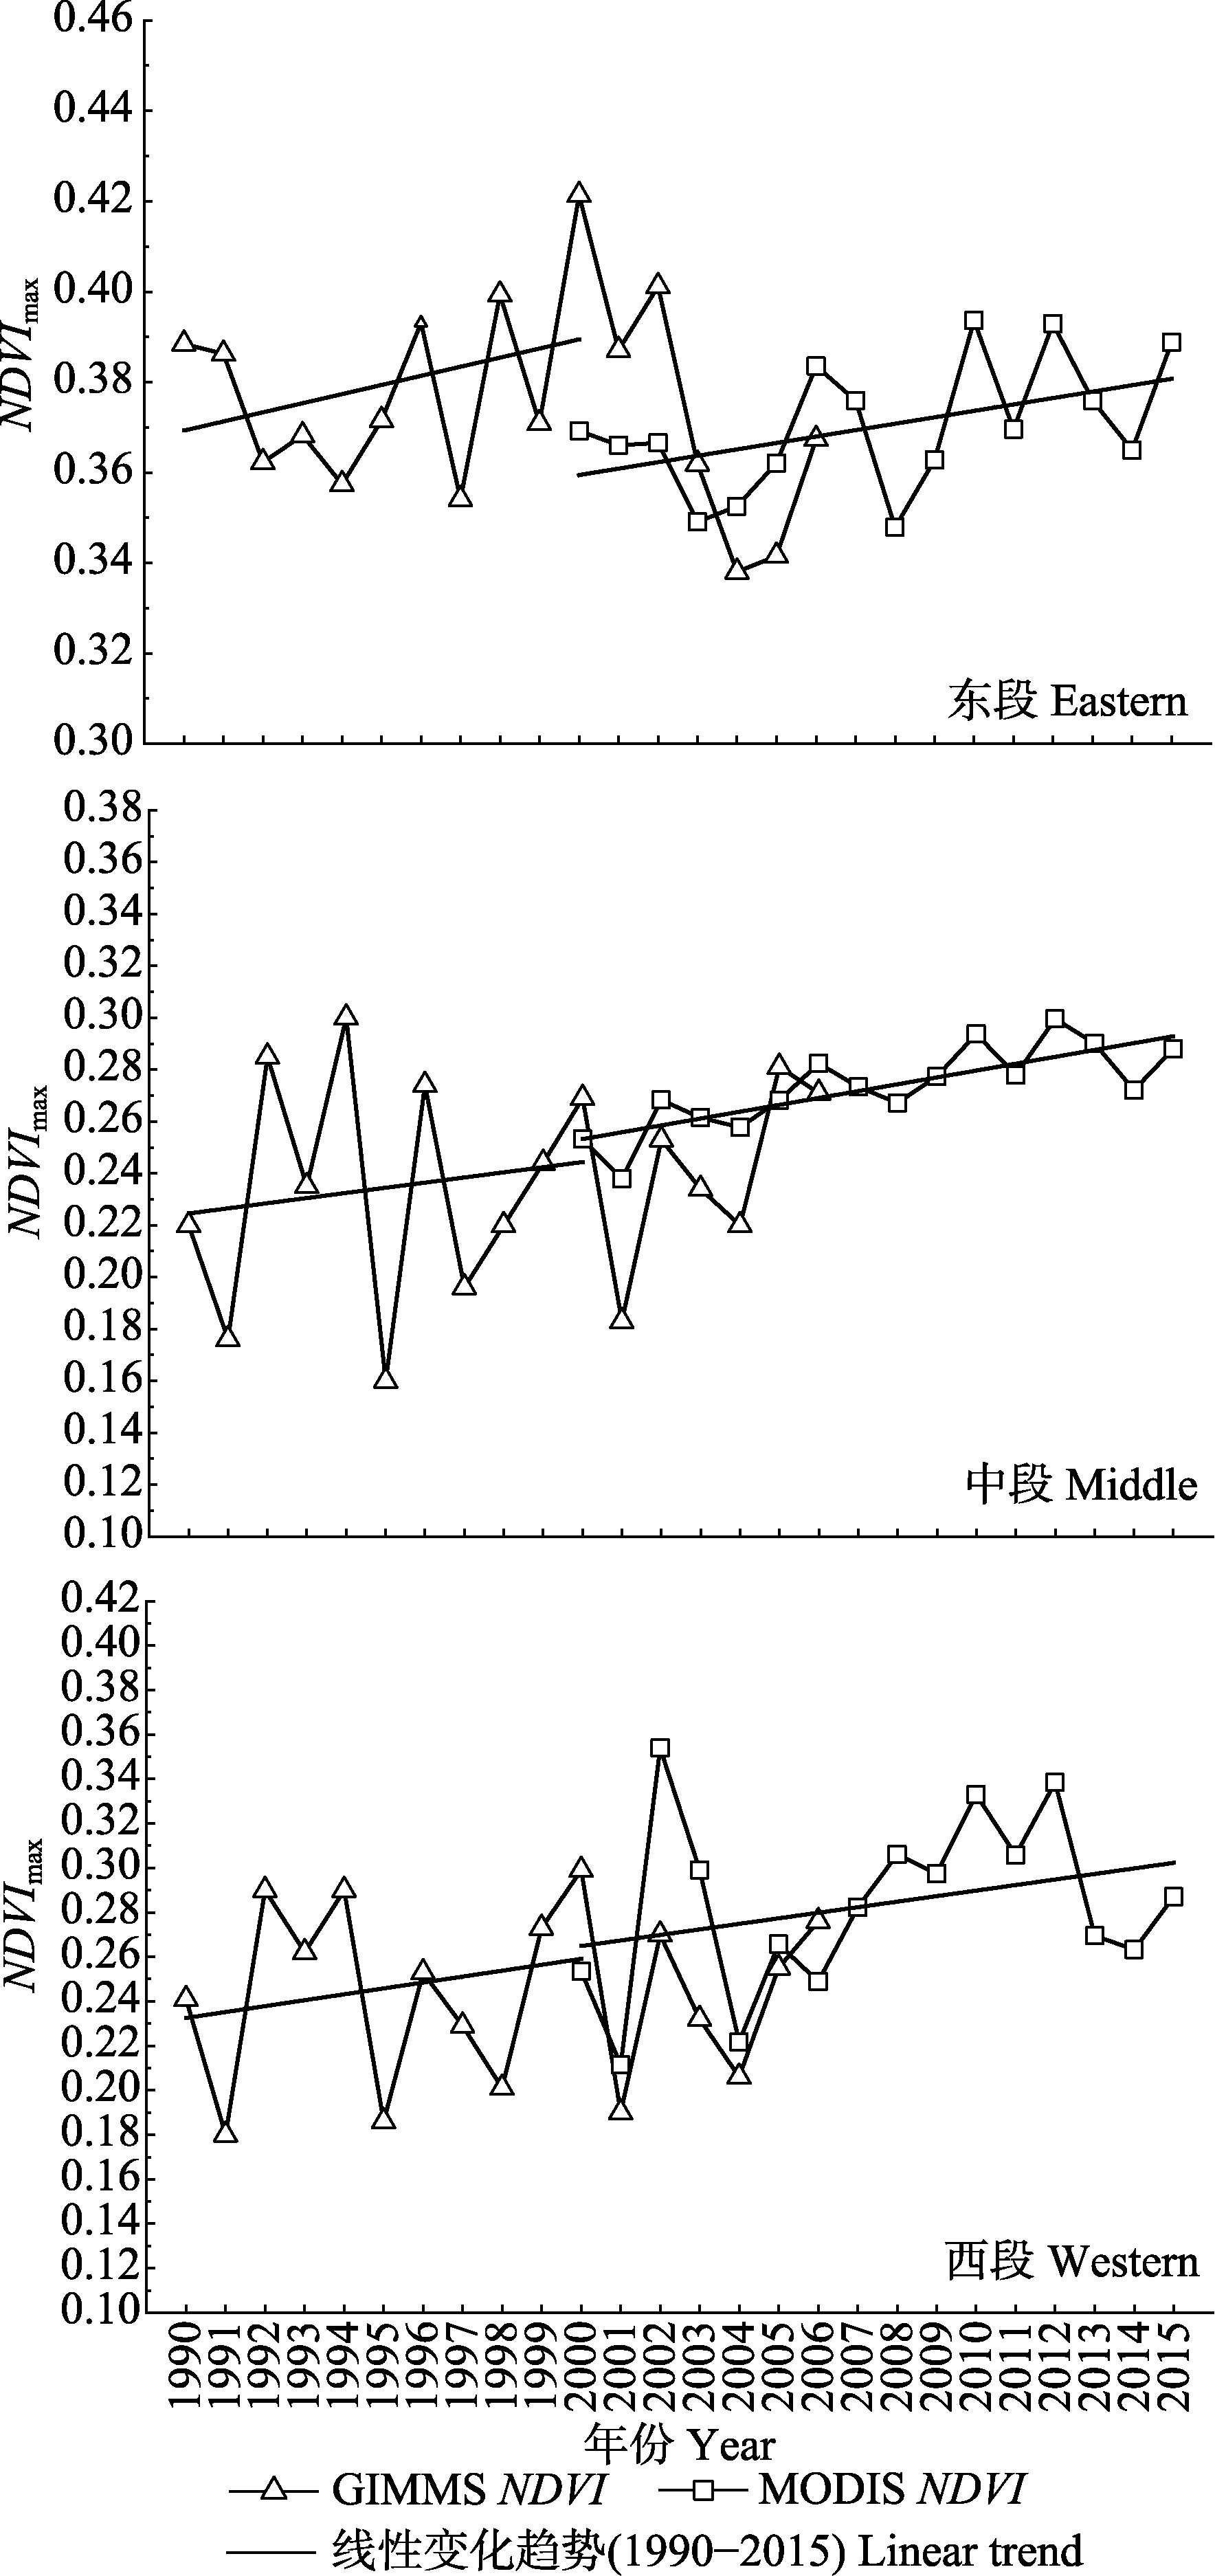
图7 1990-2015年祁连山东段、中段和西段高寒草甸带-高寒荒漠带间过渡带归一化植被指数最大值(NDVImax)变化。
Fig. 7 Variations of maximun normalized differential vegetation index (NDVImax) in the transition zone between alpine meadow and alpine desert belt in the Qilian Mountains for 1990-2015.
| 相关分析 Correlation coefficient | 偏相关 Partial correlation coefficient | 复相关 Complex correlation coefficient | |||
|---|---|---|---|---|---|
| T | P | T/P | P/T | ||
| 东段 Eastern | 0.848** | 0.806** | 0.518** | 0.292** | 0.862** |
| 中段 Middle | 0.649** | 0.638** | 0.265** | 0.215** | 0.669** |
| 西段 Western | 0.587** | 0.564** | 0.246** | 0.160** | 0.600** |
表5 1990-2015年祁连山高寒草甸带-高寒荒漠带间过渡带上归一化植被指数(NDVI)与平均气温(T)和降水量(P)相关关系
Table 5 Correlation between climatic variables and normalized differential vegetation index (NDVI) in the transition zone between alpine meadow and alpine desert belt in the Qilian Mountains from 1990 to 2015
| 相关分析 Correlation coefficient | 偏相关 Partial correlation coefficient | 复相关 Complex correlation coefficient | |||
|---|---|---|---|---|---|
| T | P | T/P | P/T | ||
| 东段 Eastern | 0.848** | 0.806** | 0.518** | 0.292** | 0.862** |
| 中段 Middle | 0.649** | 0.638** | 0.265** | 0.215** | 0.669** |
| 西段 Western | 0.587** | 0.564** | 0.246** | 0.160** | 0.600** |
| 气温垂直递减率 Vertical lapse rate of temperature (℃·100 m-1) | 1990-2015增温幅度 Warming temperature (℃) | 等效向上推进高度 Equivalent upward moving (m) | 实际向上推进高度 Actual upward moving (m) | 过渡带上平均坡度 Average slope (°) | |
|---|---|---|---|---|---|
| 东段 Eastern | 0.53 | 1.12 | 211.32 | 40.23 | 26.76 |
| 中段 Middle | 0.49 | 1.26 | 257.14 | 35.22 | 18.06 |
| 西段 Western | 0.51 | 0.50 | 98.04 | 60.82 | 13.60 |
表6 祁连山高寒荒漠下界分布变化与气候变化间的非线性关系
Table 6 Nonlinear relationship between distribution of the lower boundary of the alpine desert and climatic variables in the Qilian Mountains from 1990 to 2015
| 气温垂直递减率 Vertical lapse rate of temperature (℃·100 m-1) | 1990-2015增温幅度 Warming temperature (℃) | 等效向上推进高度 Equivalent upward moving (m) | 实际向上推进高度 Actual upward moving (m) | 过渡带上平均坡度 Average slope (°) | |
|---|---|---|---|---|---|
| 东段 Eastern | 0.53 | 1.12 | 211.32 | 40.23 | 26.76 |
| 中段 Middle | 0.49 | 1.26 | 257.14 | 35.22 | 18.06 |
| 西段 Western | 0.51 | 0.50 | 98.04 | 60.82 | 13.60 |
| [1] | Aerts R, Cornelissen JHC, Dorrepaal E ( 2006). Plant performance in a warmer world: General responses of plants from cold, northern biomes and the importance of winter and spring events. Plant Ecology, 182, 65-77. |
| [2] | Arneth A ( 2015). Climate science: Uncertain future for vegetation cover. Nature, 524, 44-45. |
| [3] | Bolch T, Yao T, Kang S, Buchroithner MF (2010). A glacier inventory for the western Nyainqentanglha Range and the Nam Co Basin, Tibet, and glacier changes 1976-2009. The Cryosphere, 4, 419-433. |
| [4] | Chen GC, Peng M ( 1994). Vegetation characteristics and its distribution of Qilian Mountain region. Acta Botanica Sinica, 36, 63-72. |
| [ 陈桂琛, 彭敏 ( 1994). 祁连山地区植被特征及其分布规律. 植物学报, 36, 63-72.] | |
| [5] | Chen J, Yang YA, Sun H ( 2011). Advances in the studies of responses of alpine plants to global warming. Chinese Journal of Applied and Environmental Biology, 17, 435-446. |
| [6] | Cui LL, Shi J, Yang YM, Fan WY ( 2009). Ten-day response of vegetation NDVI to the variations of temperature and precipitation in eastern China. Acta Geographica Sinica, 64, 850-860. |
| [ 崔林丽, 史军, 杨引明, 范文义 ( 2009). 中国东部植被NDVI对气温和降水的旬响应特征. 地理学报, 64, 850-860.] | |
| [7] | Dai SP, Zhang B, Wang HJ, Wang YM, Li D, Wang XM ( 2010). Spatiotemporal variation of vegetation NDVI in the Qilian Mountains during the period from 1999 to 2007. Arid Zone Research, 27, 585-591. |
| [ 戴声佩, 张勃, 王海军, 王亚敏, 李丹, 王兴梅 ( 2010). 1999-2007年祁连山区植被指数时空变化. 干旱区研究, 27, 585-591.] | |
| [8] | Deng SF ( 2013). Vegetation Responses to Climate Change on the Qilian Mountains 2000-2011. PhD dissertation, Lanzhou University, Lanzhou. |
| [ 邓少福 (2013). 祁连山气候变化对植被的影响研究(2000-2011). 博士学位论文, 兰州大学, 兰州.] | |
| [9] | Eklundh L, Jönsson P (2010). Timesat 3.0 Software Manual. Lund University, Lund, Sweden. |
| [10] | Fang JY, Piao SL, He JS, Ma WH ( 2004). Increasing terrestrial vegetation activity in China, 1982-1999. Science in China, 47, 229-240. |
| [11] | Fridley JD, Lynn JS, Grime JP, Askew AP ( 2016). Longer growing seasons shift grassland vegetation towards more- productive species. Nature Climate Change, 6, 865-868. |
| [12] | Granshaw FD, Fountain AG ( 2006). Glacier change (1958- 1998) in the North Cascades National Park Complex, Washington, USA. Journal of Glaciology, 52, 251-256. |
| [13] | Jahan N, Gan TY ( 2011). Modelling the vegetation-climate relationship in a boreal mixed wood forest of Alberta using normalized difference and enhanced vegetation indices. International Journal of Remote Sensing, 32, 313-335. |
| [14] | Jia QY, Wang XY, LÜ GH, Xie YB ( 2010). Research advances in effects of climate change on the vegetation zone. Journal of Anhui Agricultural Sciences, 21, 11305-11307. |
| [ 贾庆宇, 王笑影, 吕国红, 谢艳兵 ( 2010). 气候变化对植被带影响研究进展, 安徽农业科学, 21, 11305-11307.] | |
| [15] | Jia WX ( 2010). Study on the relationships between regional climatic difference, geographical location and terrain in the Qilian Mountains. Arid Zone Research, 27, 607-615. |
| [ 贾文雄 ( 2010). 祁连山气候的空间差异与地理位置和地形的关系. 干旱区研究, 27, 607-615.] | |
| [16] | Jiao KW, Gao HB, Wu SH, Hou WJ (2018). Research progress on the response processes of vegetation activity to climate change. Acta Ecologica Sinica, 38, 2229-2238. |
| [ 焦珂伟, 高江波, 吴绍洪, 侯文娟 ( 2018). 植被活动对气候变化响应过程的研究进展. 生态学报, 38, 2229-2238.] | |
| [17] | Jin X, Wang S, Wang S, Xia W ( 2016). Vegetation dynamics and their response to groundwater and climate variables in Qaidam Basin, China. International Journal of Remote Sensing, 37, 710-728. |
| [18] | Krishnaswamy J, John R, Joseph S ( 2014). Consistent response of vegetation dynamics to recent climate change in tropical mountain regions. Global Change Biology, 20, 203-215. |
| [19] | Liu J, Liu XL, Hou LM ( 2012). The changes and ecological vulnerability of landscape patterns in the eastern Qilian Mountains. Arid Land Geography, 35, 795-805. |
| [ 刘晶, 刘学录, 侯莉敏 ( 2012). 祁连山东段山地景观格局变化及其生态脆弱性分析. 干旱区地理, 35, 795-805.] | |
| [20] | Liu ZY, Zhang J, Chen L ( 2017). The latest change in the Qinghai-Tibetan Plateau vegetation index and its relationship with climate factors. Climatic and Environmental Research, 22, 289-300. |
| [ 刘振元, 张杰, 陈立 ( 2017). 青藏高原植被指数最新变化特征及其与气候因子的关系. 气候与环境研究, 22, 289-300.] | |
| [21] | Ma YM, Hu ZY, Tian LD, Zhang F, Duan AM, Yang K, Zhang YL, Yang YP ( 2014). Study progresses of the Tibet Plateau climate system change and mechanism of its impact on East Asia. Advances in Earth Science, 29, 207-215. |
| [ 马耀明, 胡泽勇, 田立德, 张凡, 段安民, 阳坤, 张镱锂, 杨永平 ( 2014). 青藏高原气候系统变化及其对东亚区域的影响与机制研究进展. 地球科学进展, 29, 207-215.] | |
| [22] | Mu SJ, Yang HF, Li JL, Chen YZ, Gang CC, Zhou W, Ju WM (2013). Spatio-temporal dynamics of vegetation coverage and its relationship with climate factors in Inner Mongolia, China. Journal of Geographical Sciences, 23, 231-246. |
| [23] | Myneni RB, Keeling CD, Tucker CJ, Asrar G, Nemani RR (1997). Increased plant growth in the northern high latitudes from 1981 to 1991. Nature, 386, 698-702. |
| [24] | Nemani RR, Keeling CD, Hashimoto H, Jolly WM, Piper SC, Tucker CJ, Myneni RB, Running SW (2003). Climate-driven increases in global terrestrial net primary production from 1982 to 1999. Science, 300, 1560-1563. |
| [25] | Ni J ( 2011). Impacts of climate change on Chinese ecosystems: Key vulnerable regions and potential thresholds. Regional Environmental Change, 11, 49-64. |
| [26] | Niu Y, Liu XD, Jing WM, Lei J, Che ZX ( 2013). Comparative study on climate gradient changes in the north slope of Qilian Mountains. Journal of Gansu Agricultural University, 48(2), 86-91. |
| [ 牛赟, 刘贤德, 敬文茂, 雷军, 车宗玺 ( 2013). 祁连山北坡气候梯度变化对比研究. 甘肃农业大学学报, 48(2), 86-91.] | |
| [27] | Qin JH, Zhang WX, Sun H, Wang Q ( 2013). Temperature sensitivity of enzyme activity in subalpine forest soil in Southwest China. Acta Pedologica Sinica, 50, 1241-1245. |
| [28] | Qing WW, Han CT, Liu JF ( 2018). A study on temperature lapse rate in Hulugou watershed, Qilian Mountains. Journal of Lanzhou University natural sciences, 54(1), 44-50. |
| [ 卿文武, 韩春坛, 刘俊峰 ( 2018). 祁连山葫芦沟流域气温直减率变化特征. 兰州大学学报(自然科学版), 54(1), 44-50.] | |
| [29] | Shen XJ, Liu BH, Li GD, Yu PJ, Zhou DW ( 2016). Impacts of grassland types and vegetation cover changes on surface air temperature in the regions of temperate grassland of China. Theoretical and Applied Climatology, 126, 141-150. |
| [30] | Stocker TF, Qin D, Plattner GK, Tignor M, Allen SK, Boschung J, Nauels A, Xia Y, Bex V, Midgley PM (2013). Climate Change 2013: The Physical Science Basis. Cambridge University Press, New York, USA. 3-29. |
| [31] | Sun J, Cheng GW ( 2014). Mountain altitudinal belt: A review. Ecology and Environmnet, 23, 1544-1550. |
| [ 孙建, 程根伟 ( 2014). 山地垂直带谱研究评述. 生态环境学报, 23, 1544-1550.] | |
| [32] | Tchebakova NM, Rehfeldt GE, Parfenova EI ( 2010). From vegetation zones to climatypes: Effects of climate warming on siberian ecosystems. Ecological Studies, 209, 427-446. |
| [33] | Teste FP, Kardol P, Turner BL, Wardle DA, Zemunik G, Renton M, Laliberté E (2017). Plant-soil feedback and the maintenance of diversity in mediterranean-climate shrublands. Science, 355, 173. |
| [34] | Tucker CJ ( 1986). Cover Maximum normalized difference vegetation index images for sub-Saharan Africa for 1983-1985. International Journal of Remote Sensing, 7, 1383-1384. |
| [35] | Tucker CJ, Sellers PJ ( 1986). Satellite remote sensing of primary production. International Journal of Remote Sensing, 7, 1395-1416. |
| [36] | Walther GR ( 2010). Community and ecosystem responses to recent climate change. Philosophical Transactions of the Royal Society B, 365, 2019-2024. |
| [37] | Wang GX, Bai W, Li N, Hu HC ( 2011). Climate changes and its impact on tundra ecosystem in Qinghai-Tibet Plateau, China. Climatic Change, 106, 463-482. |
| [38] | Wang HJ, Zhang B, Jin XH, Zhang H, Liu JF, Dai SP ( 2009). Spatio-temporal variations analysis of air temperature and precipitation in Qilian Mountains Region based on GIS. Journal of Desert Research, 29, 1196-1202. |
| [ 王海军, 张勃, 靳晓华, 张华, 柳景峰, 戴声佩 ( 2009). 基于GIS的祁连山区气温和降水的时空变化分析. 中国沙漠, 29, 1196-1202.] | |
| [39] |
Wang YK, Jia WX, Liu CH, Chen W, Zhao CZ, Wang QY, Wang J ( 2012). Ecological environment change in the north slope of the Qilianshan Mountains. Scientia Silvae Sinicae, 48(4), 21-26.
DOI |
|
[ 汪有奎, 贾文雄, 刘潮海, 陈文, 赵成章, 王启尤, 汪杰 ( 2012). 祁连山北坡的生态环境变化. 林业科学, 48(4), 21-26.]
DOI |
|
| [40] | Yan YH, Yi QF, Huang ZL, Xing FW ( 2004). The ecological response of fern diversity to vegetation succession in Gudoushan Nature Reserve, Guangdong. Chinese Biodiversity, 12, 339-347. |
| [ 严岳鸿, 易绮斐, 黄忠良, 邢福武 ( 2004). 广东古兜山自然保护区蕨类植物多样性对植被不同演替阶段的生态响应. 生物多样性, 12, 339-347.] | |
| [41] | Yang YT, Guan HD, Shen MG, Liang W, Jiang L ( 2015). Changes in autumn vegetation dormancy onset date and the climate controls across temperate ecosystems in China from 1982 to 2010. Global Change Biology, 21, 652-665. |
| [42] | Yao JQ, Yang Q, Chen YN, Hu WF, Liu ZH, Zhao L ( 2013). Climate change in arid areas of Northwest China in past 50 years and its effects on the local ecological environment. Chinese Journal of Ecology, 32, 1283-1291. |
| [ 姚俊强, 杨青, 陈亚宁, 胡文峰, 刘志辉, 赵玲 ( 2013). 西北干旱区气候变化及其对生态环境影响. 生态学杂志, 32, 1283-1291.] | |
| [43] | Yu HY, Xu JC ( 2009). Effects of climate change on vegetations on Qinghai-Tibet Plateau: A review. Chinese Journal of Ecology, 28, 747-754. |
| [ 于海英, 许建初 ( 2009). 气候变化对青藏高原植被影响研究综述. 生态学杂志, 28, 747-754.] | |
| [44] | Zeng B ( 2008). Vegetation Responses to Climate Change on the Tibetan Plateau 1982-2003. PhD dissertation, Lanzhou University,Lanzhou. |
| [ 曾彪 ( 2008). 青藏高原植被对气候变化的响应研究(1982-2003). 博士学位论文, 兰州大学, 兰州.] | |
| [45] | Zeng B, Yang TB (2009). Impacts of climate warming on vegetation in Qaidam area from 1990 to 2003. Environmental Monitoring and Assessment, 144, 403-417. |
| [46] | Zhang H, Wen YL, Ma L, Chang ZQ, Wang JY ( 2001). The climate features and regionalization of vertical climatic zones in the northern slope of Qilian Mountains. Journal of Mountain Research, 19, 497-502. |
| [ 张虎, 温娅丽, 马力, 常宗强, 王金叶 (2001). 祁连山北坡中部气候特征及垂直气候带的划分. 山地学报, 19, 497-502.] | |
| [47] | Zhang HY, Qian YB, Wu ZN, Wang ZC (2012). Vegetation-environment relationships between northern slope of Karlik Mountain and Naomaohu Basin, East Tianshan Mountains. Chinese Geographical Science, 22, 288-301. |
| [48] | Zhang WX ( 2015). Effects of terrain factors on plant growth in mountain area. National Geographic, ( 3), 76-77. |
| [ 张微笑 ( 2015). 地形因子对山区植物生长的影响. 华夏地理, ( 3), 76-77.] | |
| [49] | Zhou W, Gang CC, Li JL, Zhang CB, Mu SJ, Sun ZG ( 2014). Spatial-temporal dynamics of grassland coverage and its response to climate change in China during 1982-2010. Acta Geographica Sinica, 69, 15-30. |
| [ 周伟, 刚成诚, 李建龙, 章超斌, 穆少杰, 孙政国 ( 2014). 1982-2010年中国草地覆盖度的时空动态及其对气候变化的响应. 地理学报, 69, 15-30.] | |
| [50] | Zhu WQ, Pan YZ, Yang XQ, Song GB ( 2007). Impact of climate change on net primary productivity of land vegetation in China. Chinese Science Bulletin, 52, 2535-2541. |
| [ 朱文泉, 潘耀忠, 阳小琼, 宋国宝 ( 2007). 气候变化对中国陆地植被净初级生产力的影响分析. 科学通报, 52, 2535-2541.] | |
| [51] | Zou C ( 2011). Research on Vegetation Change and Climate Response Based on the SPOT-NDVI During the Period of 1998 to 2009 in Qinghai Province. Master degree dissertation, Qinghai Normal University,Xining. |
| [ 邹婵 ( 2011). 基于SPOT-NDVI的青海省1998-2009年植被变化及气候响应研究. 硕士学位论文, 青海师范大学, 西宁.] |
| [1] | 张琳, 袁伟影, 宋创业, 吴冬秀. 1998-2010年中国典型生态系统长期监测样地环境要素、物种丰富度和生物量动态数据集[J]. 植物生态学报, 2025, 49(8): 1182-1190. |
| [2] | 范亚冉, 夏少攀, 于冰冰, 朱紫琪, 杨威, 范豫川, 刘晓雨, 张旭辉, 郑聚锋. 大气CO2浓度升高和增温对土壤有机碳库积累、分子组成和结构稳定性的影响[J]. 植物生态学报, 2025, 49(7): 1053-1069. |
| [3] | 段俊丞, 王志勇, 高维聪, 张成凯, 高长宏, 刘晓彤, 李振今. 黄河三角洲湿地入侵物种互花米草时空演化与景观格局分析[J]. 植物生态学报, 2025, 49(6): 922-938. |
| [4] | 王堃莹, 邱贵福, 刘子赫, 孟君, 刘宇轩, 贾国栋. 气候变化对不同退化程度小叶杨林分生长和内在水分利用效率的调节[J]. 植物生态学报, 2025, 49(2): 343-355. |
| [5] | 黄美红, 牛梦秋, 杨鹏飞, 林洁, 廖周瑜, 陈建国, 向建英. 不同温度和埋藏深度对高山垫状植物山生福禄草种子出苗及幼苗生长的影响[J]. 植物生态学报, 2025, 49(12): 2092-2104. |
| [6] | 张乐, 焦亮, 薛儒鸿, 张鹏, 王旭鸽, 秦亚蓉, 后赛鹏, 马媛媛. 祁连山祁连圆柏年内径向生长对水热因素的响应[J]. 植物生态学报, 2025, 49(11): 1878-1889. |
| [7] | 贺艺, 周静, 陈宸, 房庭舟, 苏剑, 高浩杰, 曹嘉浩, 杨飞宇, 范淇博, 朱乐瑶, 陈薏名, 杨飞, 王毅腾, 冯雷, 刘飞, 梁爽, 蒋明凯, 陈军, 赵云鹏, 陈伟乐, 赵颖, 黄建国. 浙江海岛濒危树种的保护与恢复[J]. 植物生态学报, 2025, 49(10): 1583-1599. |
| [8] | 董云焘, 贾恒锋, 杨晶, 李佩轩, 方欧娅. 祁连山中部祁连圆柏林干扰历史重建[J]. 植物生态学报, 2024, 48(8): 967-976. |
| [9] | 张鹏, 焦亮, 薛儒鸿, 魏梦圆, 杜达石, 吴璇, 王旭鸽, 李倩. 干旱强度影响祁连山西段不同海拔青海云杉的生长恢复[J]. 植物生态学报, 2024, 48(8): 977-987. |
| [10] | 史倩, 同小娟, 许玲玲, 孟平, 于裴洋, 李俊, 杨铭鑫. 油松早晚材径向生长对气候因子的响应[J]. 植物生态学报, 2024, 48(8): 988-1000. |
| [11] | 陈以恒, 玉素甫江•如素力, 阿卜杜热合曼•吾斯曼. 2001-2020年天山新疆段草地植被覆盖度时空变化及驱动因素分析[J]. 植物生态学报, 2024, 48(5): 561-576. |
| [12] | 吴茹茹, 刘美珍, 谷仙, 常馨月, 郭立月, 蒋高明, 祁如意. 气候变化对巨柏适宜生境分布的潜在影响和预测[J]. 植物生态学报, 2024, 48(4): 445-458. |
| [13] | 梁逸娴, 王传宽, 臧妙涵, 上官虹玉, 刘逸潇, 全先奎. 落叶松径向生长和生物量分配对气候变暖的响应[J]. 植物生态学报, 2024, 48(4): 459-468. |
| [14] | 臧妙涵, 王传宽, 梁逸娴, 刘逸潇, 上官虹玉, 全先奎. 基于纬度移栽的落叶松叶、枝、根生态化学计量特征对气候变暖的响应[J]. 植物生态学报, 2024, 48(4): 469-482. |
| [15] | 张计深, 史新杰, 刘宇诺, 吴阳, 彭守璋. 气候变化下中国潜在自然植被生态系统碳储量动态[J]. 植物生态学报, 2024, 48(4): 428-444. |
| 阅读次数 | ||||||
|
全文 |
|
|||||
|
摘要 |
|
|||||
Copyright © 2026 版权所有 《植物生态学报》编辑部
地址: 北京香山南辛村20号, 邮编: 100093
Tel.: 010-62836134, 62836138; Fax: 010-82599431; E-mail: apes@ibcas.ac.cn, cjpe@ibcas.ac.cn
备案号: 京ICP备16067583号-19

