
植物生态学报 ›› 2013, Vol. 37 ›› Issue (6): 492-502.DOI: 10.3724/SP.J.1258.2013.00051 cstr: 32100.14.SP.J.1258.2013.00051
刘宁1,孙鹏森1,*( ),刘世荣1,孙阁2
收稿日期:2013-01-09
接受日期:2013-03-27
出版日期:2013-01-09
发布日期:2013-06-05
基金资助:
LIU Ning1,SUN Peng-Sen1,*(),LIU Shi-Rong1,SUN Ge2
Received:2013-01-09
Accepted:2013-03-27
Online:2013-01-09
Published:2013-06-05
摘要:
在复杂的气候变化条件下, 利用水碳耦合模型进行生态水文学研究成为主要的研究手段和途径。该文以杂谷脑河上游流域为例, 在确定生态水文模型WaSSI-C模拟尺度的基础上, 探讨水碳耦合模型在中国西南湿润地区的适用性。杂古脑河上游流域位于岷江上游, 隶属于长江流域。在分析和讨论了模型结构和机理的基础上, 分别对模型蒸散和融雪计算进行了补充改进, 以提高模型的适用性。将1988-1996年作为模型的率定期, 1997-2006年作为模型的验证期, 分别在率定期和验证期利用实测的径流数据和中分辨率成像光谱仪数据的总初级生产力、蒸散(ET)数据, 对模拟结果进行对比验证。并利用决定系数(R2)和Nash-Sutcliffe效率系数(NS)两个指标对模拟效果进行评价。流域总径流率定期和验证期对比验证的R2分别为0.86和0.78; NS分别为0.82和0.67。总生态系统生产力和ET验证期的R2分别为0.89和0.78。可见模型模拟结果的两个评价指标都处于较为理想的区间内, 说明WaSSI-C模型在研究区内具有较好的适用性。并对模型的蒸散计算方法进行了讨论, 在此基础上提出了模型中存在的问题和改进的方向。
刘宁,孙鹏森,刘世荣,孙阁. 流域水碳过程耦合模拟——WaSSI-C模型的率定与检验. 植物生态学报, 2013, 37(6): 492-502. DOI: 10.3724/SP.J.1258.2013.00051
LIU Ning,SUN Peng-Sen,LIU Shi-Rong,SUN Ge. Coupling simulation of water-carbon processes for catchment―calibration and validation of the WaSSI-C model. Chinese Journal of Plant Ecology, 2013, 37(6): 492-502. DOI: 10.3724/SP.J.1258.2013.00051
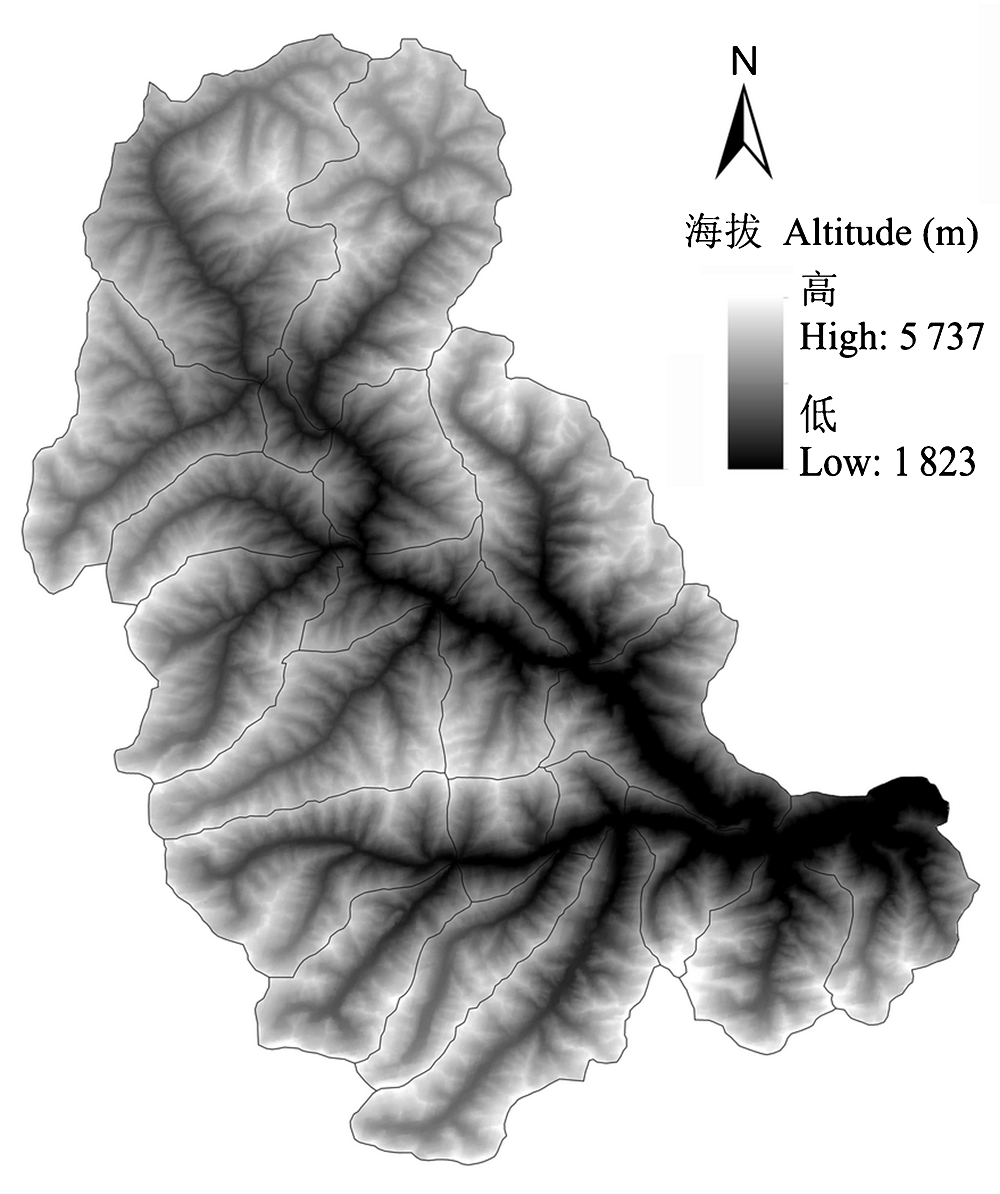
图1 杂古脑上游流域子流域划分方案。
Fig. 1 Division scheme of sub-watershed in the upper Zagu- nao River watershed.
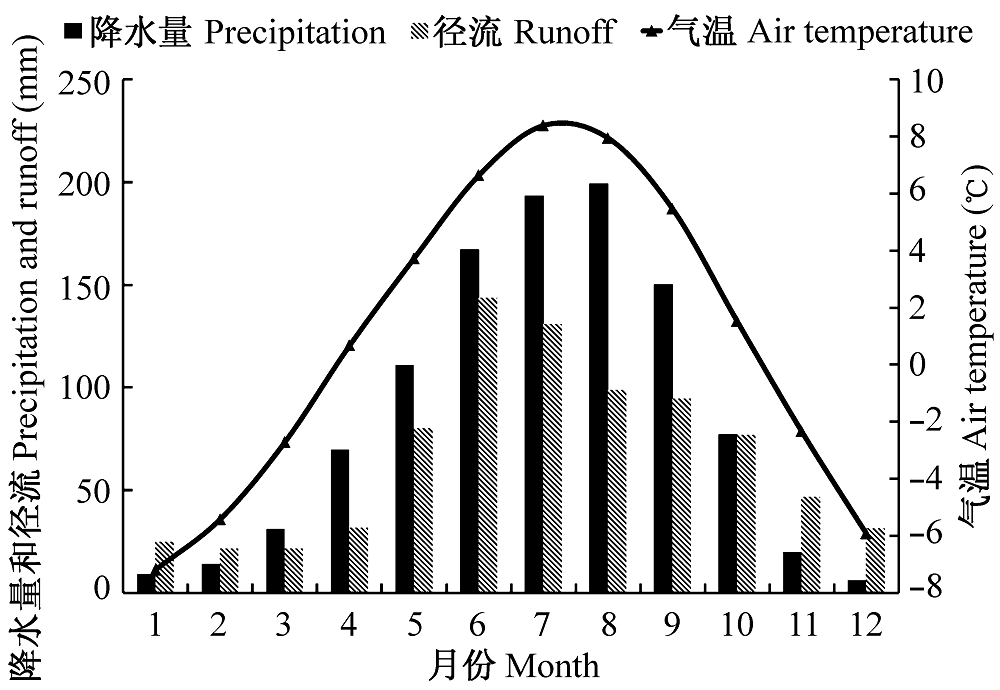
图2 1988至2006年杂古脑流域的月平均降水量、径流和气温。
Fig. 2 Average monthly precipitation, runoff and air temperature in Zagunao River watershed from 1988 to 2006.
| 数据集 Dataset | 来源 Source | 用途 Usage | 分辨率 Resolution | 年 Year | |
|---|---|---|---|---|---|
| 气象数据(气温和降水量) Climate data (air temperature and precipitation) | 国家气象局 State Meteorological Administration, China | 输入数据 Input data | 1 km × 1 km | 1988-2006 | |
| 植被覆盖数据 Vegetation cover data | 中分辨率成像光谱仪 Moderate Resolution Imaging Spectroradiometer (MODIS) ( | 输入数据 Input data | 1 km × 1 km | 2000 | |
| 叶面积指数 Leaf area index (LAI) | 中分辨率成像光谱仪 Moderate Resolution Imaging Spectroradiometer (MODIS) ( | 输入数据 Input data | 1 km × 1 km | 2000-2006 | |
| 土壤属性数据 Soil property data | 中国科学院南京土壤研究所 Institute of Soil Science, Chinese Academy of Sciences, Nanjing, China | 输入数据 Input data | 1 km × 1 km | ||
| 总初级生产力 Gross primary production (GPP) | 中分辨率成像光谱仪 Moderate Resolution Imaging Spectroradiometer (MODIS) ( | 模型验证 Model validation | 1 km × 1 km | 2000-2006 | |
| 蒸散 Evapotranspiration (ET) | MODIS蒸散 MODIS_ET | 中分辨率成像光谱仪 Moderate Resolution Imaging Spectroradiometer (MODIS) ( | 模型验证 Model validation | 1 km × 1 km | 2000-2006 |
| Zhang蒸散Zhang_ET | ET全球数据集 Global ET database ( | 模型验证 Model validation | 8 km × 8 km | 1988-2006 | |
| 径流数据 Runoff data (RUNOFF) | 四川省水文资源勘测局 Hydrology and Water Resource Investigation Bureau of Sichuan Province, China | 模型验证 Model validation | 1988-2006 | ||
表1 本研究中用到的数据集
Table 1 Datasets used in the study
| 数据集 Dataset | 来源 Source | 用途 Usage | 分辨率 Resolution | 年 Year | |
|---|---|---|---|---|---|
| 气象数据(气温和降水量) Climate data (air temperature and precipitation) | 国家气象局 State Meteorological Administration, China | 输入数据 Input data | 1 km × 1 km | 1988-2006 | |
| 植被覆盖数据 Vegetation cover data | 中分辨率成像光谱仪 Moderate Resolution Imaging Spectroradiometer (MODIS) ( | 输入数据 Input data | 1 km × 1 km | 2000 | |
| 叶面积指数 Leaf area index (LAI) | 中分辨率成像光谱仪 Moderate Resolution Imaging Spectroradiometer (MODIS) ( | 输入数据 Input data | 1 km × 1 km | 2000-2006 | |
| 土壤属性数据 Soil property data | 中国科学院南京土壤研究所 Institute of Soil Science, Chinese Academy of Sciences, Nanjing, China | 输入数据 Input data | 1 km × 1 km | ||
| 总初级生产力 Gross primary production (GPP) | 中分辨率成像光谱仪 Moderate Resolution Imaging Spectroradiometer (MODIS) ( | 模型验证 Model validation | 1 km × 1 km | 2000-2006 | |
| 蒸散 Evapotranspiration (ET) | MODIS蒸散 MODIS_ET | 中分辨率成像光谱仪 Moderate Resolution Imaging Spectroradiometer (MODIS) ( | 模型验证 Model validation | 1 km × 1 km | 2000-2006 |
| Zhang蒸散Zhang_ET | ET全球数据集 Global ET database ( | 模型验证 Model validation | 8 km × 8 km | 1988-2006 | |
| 径流数据 Runoff data (RUNOFF) | 四川省水文资源勘测局 Hydrology and Water Resource Investigation Bureau of Sichuan Province, China | 模型验证 Model validation | 1988-2006 | ||
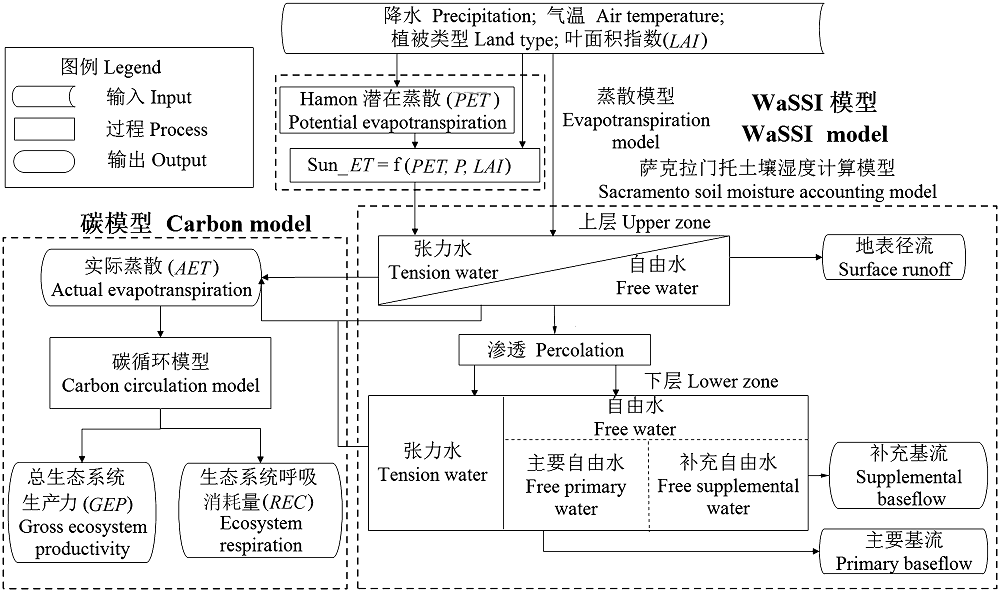
图3 WaSSI-C模型的框架。
Fig. 3 Framework of WaSSI-C Model. LAI, leaf area index.
| 植被类型 Vegetation type | GEP = k × ET | REC = m + n × GEP | |||
|---|---|---|---|---|---|
| k ± SD | R2 | m ± SD | n ± SD | R2 | |
| 农田 Cropland | 3.13 ± 1.69 | 0.78 | 40.6 ± 3.84 | 0.43 ± 0.02 | 0.77 |
| 郁闭灌丛 Closed shrubland | 1.37 ± 0.62 | 0.77 | 11.4 ± 15.62 | 0.69 ± 0.15 | 0.74 |
| 落叶阔叶林 Deciduous broad-leaved forest | 3.20 ± 1.26 | 0.93 | 30.8 ± 2.93 | 0.45 ± 0.03 | 0.83 |
| 常绿阔叶林 Evergreen broad-leaved forest | 2.59 ± 0.54 | 0.92 | 19.6 ± 8.74 | 0.61 ± 0.06 | 0.63 |
| 常绿针叶林 Evergreen coniferous forest | 2.46 ± 0.96 | 0.89 | 9.9 ± 2.24 | 0.68 ± 0.03 | 0.80 |
| 草地 Grassland | 2.12 ± 1.66 | 0.84 | 18.9 ± 2.31 | 0.64 ± 0.02 | 0.82 |
| 混交林 Mixed forest | 2.74 ± 1.05 | 0.89 | 24.4 ± 4.24 | 0.62 ± 0.05 | 0.88 |
| 稀疏灌丛 Open shrubland | 1.33 ± 0.47 | 0.85 | 9.7 ± 3.03 | 0.56 ± 0.08 | 0.81 |
| 高山草甸 Alpine meadow | 1.26 ± 0.77 | 0.80 | 25.2 ± 3.23 | 0.53 ± 0.07 | 0.65 |
| 湿地 Wetland | 1.66 ± 1.33 | 0.78 | 7.8 ± 3.04 | 0.56 ± 0.03 | 0.80 |
表2 WaSSI-C模型主要植被类型的碳通量回归模型参数
Table 2 Parameters of main vegetation types for carbon flux regression model in WaSSI-C model
| 植被类型 Vegetation type | GEP = k × ET | REC = m + n × GEP | |||
|---|---|---|---|---|---|
| k ± SD | R2 | m ± SD | n ± SD | R2 | |
| 农田 Cropland | 3.13 ± 1.69 | 0.78 | 40.6 ± 3.84 | 0.43 ± 0.02 | 0.77 |
| 郁闭灌丛 Closed shrubland | 1.37 ± 0.62 | 0.77 | 11.4 ± 15.62 | 0.69 ± 0.15 | 0.74 |
| 落叶阔叶林 Deciduous broad-leaved forest | 3.20 ± 1.26 | 0.93 | 30.8 ± 2.93 | 0.45 ± 0.03 | 0.83 |
| 常绿阔叶林 Evergreen broad-leaved forest | 2.59 ± 0.54 | 0.92 | 19.6 ± 8.74 | 0.61 ± 0.06 | 0.63 |
| 常绿针叶林 Evergreen coniferous forest | 2.46 ± 0.96 | 0.89 | 9.9 ± 2.24 | 0.68 ± 0.03 | 0.80 |
| 草地 Grassland | 2.12 ± 1.66 | 0.84 | 18.9 ± 2.31 | 0.64 ± 0.02 | 0.82 |
| 混交林 Mixed forest | 2.74 ± 1.05 | 0.89 | 24.4 ± 4.24 | 0.62 ± 0.05 | 0.88 |
| 稀疏灌丛 Open shrubland | 1.33 ± 0.47 | 0.85 | 9.7 ± 3.03 | 0.56 ± 0.08 | 0.81 |
| 高山草甸 Alpine meadow | 1.26 ± 0.77 | 0.80 | 25.2 ± 3.23 | 0.53 ± 0.07 | 0.65 |
| 湿地 Wetland | 1.66 ± 1.33 | 0.78 | 7.8 ± 3.04 | 0.56 ± 0.03 | 0.80 |
| 评价指标 Evaluation index | 率定期 Calibration period (1988-1996) | 验证期 Validation period (1997-2006) |
|---|---|---|
| 决定系数 Determined coefficient R2 | 0.86 | 0.78 |
| Nash-Sutcliffe效率系数 Nash-Sutcliffe efficiency coefficient NS | 0.82 | 0.67 |
表3 率定期(1988-1996)和验证期(1997-2006)径流的评价指标值
Table 3 Evaluation index values of runoff during calibration period (1988-1996) and validation period (1997- 2006)
| 评价指标 Evaluation index | 率定期 Calibration period (1988-1996) | 验证期 Validation period (1997-2006) |
|---|---|---|
| 决定系数 Determined coefficient R2 | 0.86 | 0.78 |
| Nash-Sutcliffe效率系数 Nash-Sutcliffe efficiency coefficient NS | 0.82 | 0.67 |
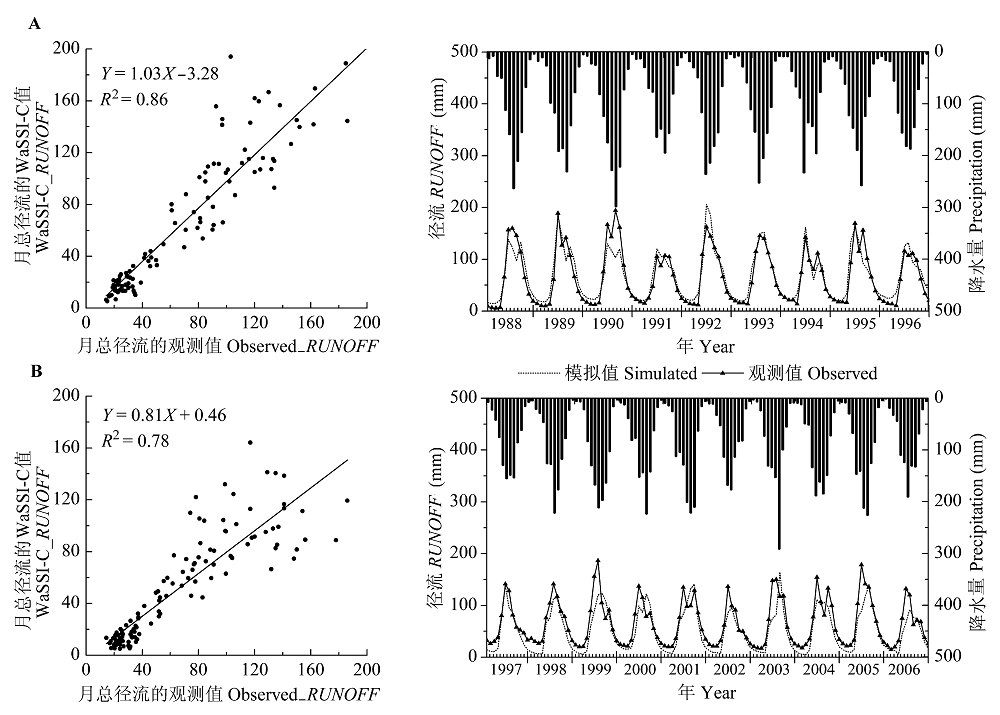
图4 率定期(A)和验证期(B)流域月总径流(RUNOFF, mm·month-1)的WaSSI-C模拟值(点线)与观测值(实线)的对比。
Fig. 4 Comparison between total monthly runoff (RUNOFF, mm·month-1) simulated by WaSSI-C (dotted line) and observed (active line) in calibration period (A) and validation period (B).
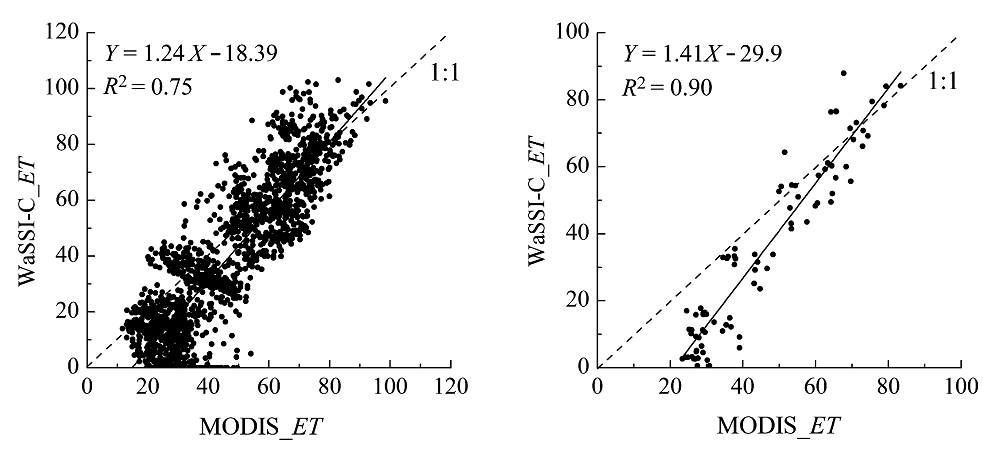
图5 各水文响应单元(左)和流域总(右)平均月蒸散(ET, mm·month-1)的WaSSI-C模拟值与MODIS模拟值的对比。
Fig. 5 Comparison between mean monthly evapotranspiration (ET, mm·month-1) simulated by WaSSI-C and MODIS of each hydrology response unit (left) and the whole watershed (right).
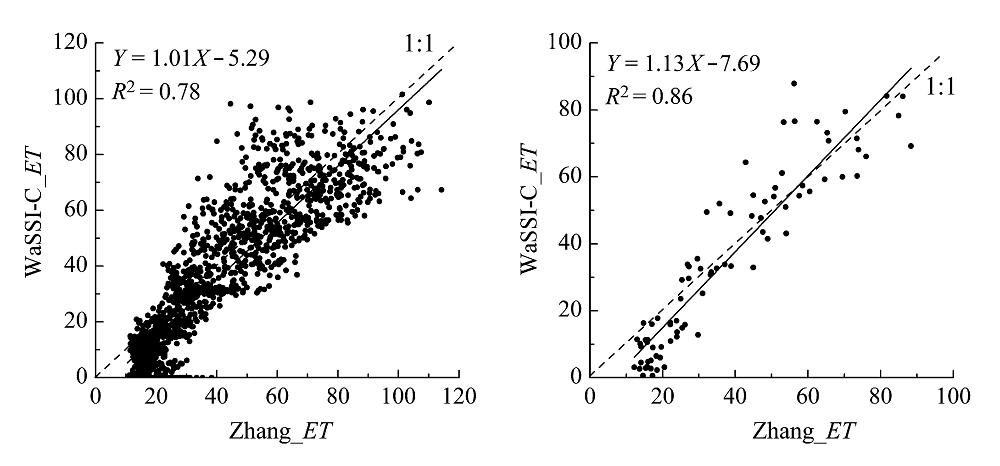
图6 各水文响应单元(左)和流域总(右)平均月蒸散(ET, mm·month-1)的WaSSI-C模拟值与Zhang模拟值的对比。
Fig. 6 Comparison between mean monthly evapotranspiration (ET, mm·month-1) simulated by WaSSI-C and Zhang for each hydrology response unit (left) and the whole watershed (right).
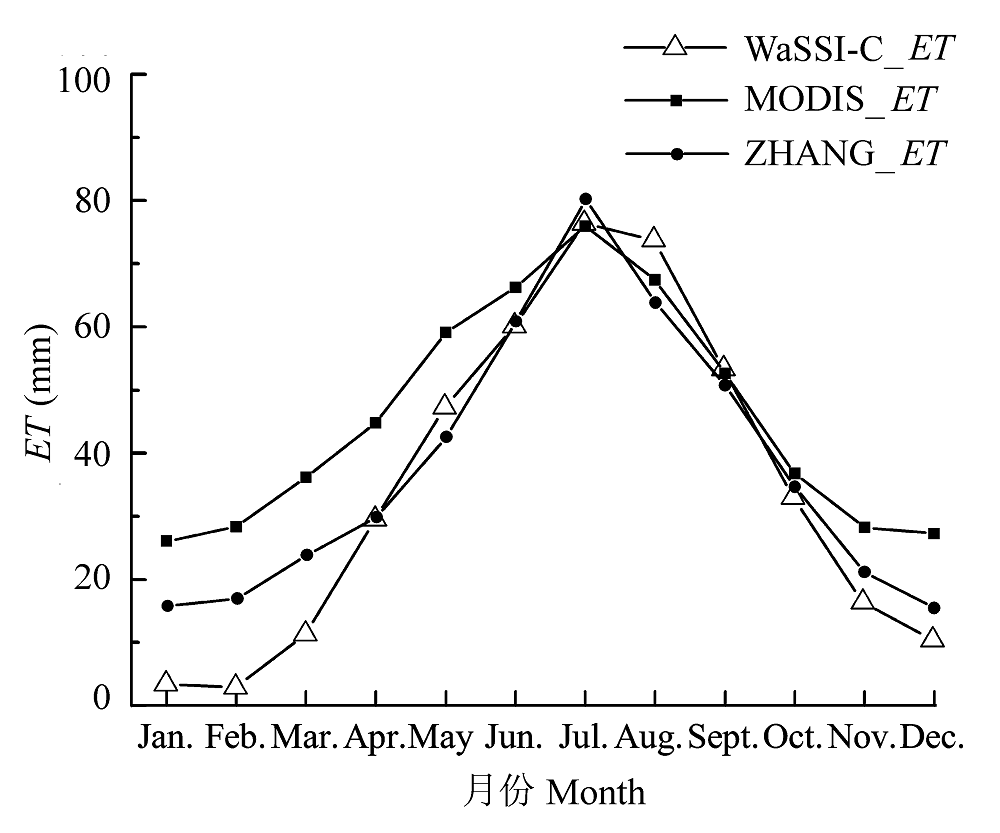
图7 2000-2006年WaSSI-C、MODIS和Zhang模拟的平均月蒸散(ET, mm·month-1)的对比。
Fig. 7 Comparison of mean monthly evapotranspiration (ET, mm·month-1) simulated by WaSSI-C, MODIS and Zhang during the period of 2000-2006.
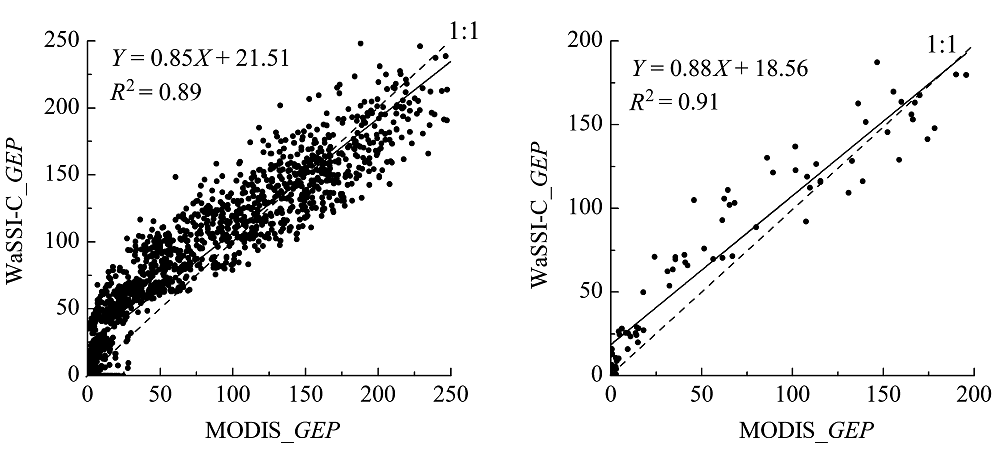
图8 各水文响应单元(左)和流域总(右)平均月总生态系统生产力(GEP, g C·m-2·month-1)的WaSSI-C模拟值与MODIS模拟值的对比。
Fig. 8 Comparison between mean monthly gross ecosystem productive (GEP) (g C·m-2·month-1) simulated by WaSSI-C and MODIS for each hydrology response unit (left) and the whole watershed (right).
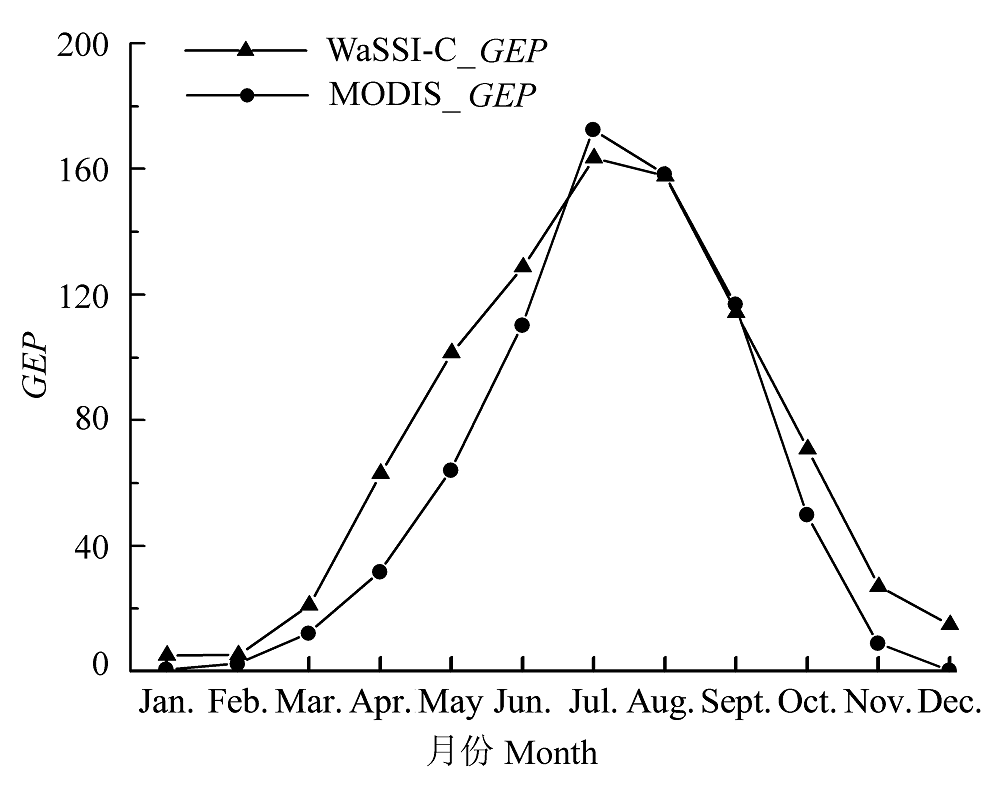
图9 2000-2006年WaSSI-C、MODIS和Zhang模拟的平均月总生态系统生产力(GEP, g C·m-2·month-1)的对比。
Fig. 9 Comparison of mean monthly gross ecosystem productive (GEP) (g C·m-2·month-1) simulated by WaSSI-C, MODIS and Zhang during the period of 2000-2006.
| [1] |
Baldocchi D, Falge E, Gu LH, Olson R, Hollinger D, Running S, Anthoni P, Bernhofer C, Davis K, Evans R, Fuentes J, Goldstein A, Katul G, Law B, Lee X, Malhi Y, Meyers T, Munger W, Oechel W, Paw KT, Pileguard K, Schmid HP, Valentini R, Verma S, Vesala T, Wilson K, Wofsy S (2001). FLUXNET: a new tool to study the temporal and spatial variability of ecosystem-scale carbon dioxide, water vapor, and energy flux densities. Bulletin of the American Meteorological Society, 82, 2415-2434.
DOI URL |
| [2] | Bao WM (1995). The Concept Model and Application of Basin Water-Sand Simulation in Loess Area. Hehai University Press, Nanjing. (in Chinese) |
| [ 包为民 (1995). 黄土地区流域水沙模拟概念模型与应用. 河海大学出版社, 南京.] | |
| [3] | Beer C, Reichstein M, Ciais P, Farquhar GD, Papale D (2007). Mean annual GPP of Europe derived from its water balance. Geophysical Research Letters, 34, L05401, doi: 10.1029/2006GL029006. |
| [4] | Cui TC, Lu JH (2000). Discussing into two runoff yielding models. Shanxi Hydromechanics, (3), 13-15. (in Chinese with English abstract) |
| [ 崔泰昌, 陆建华 (2002). 试论蓄满产流模型与超渗产流模型. 山西水利科技, (3), 13-15.] | |
| [5] | Guo WH, Li SE (2010). Preliminary research on vineyard’s water-carbon flux coupling in arid northwestern China. Journal of Irrigation and Drainage, 29, 61-63. (in Chinese with English abstract) |
| [ 郭维华, 李思恩 (2010). 西北旱区葡萄园水碳通量耦合的初步研究. 灌溉排水学报, 29, 61-63.] | |
| [6] | Hamon WR (1963). Computation of direct runoff amounts from storm rainfall. International Association of Hydrological Sciences Publication, 63, 52-62. |
| [7] | Jiang YX (1963). The primary study on habitat type of alpine forest in Miyaluo and Markang, West Sichuan. Scientia Silvae Sinicae, 8(4), 321-335. (in Chinese) |
| [ 蒋有绪 (1963). 川西米亚罗、马尔康高山林区生境类型的初步研究. 林业科学, 8(4), 321-335.] | |
| [8] |
Law BE, Falge E, Gu L, Baldocchi DD, Bakwin P, Berbigier P, Davis K, Dolman AJ, Falk M, Fuentes JD, Goldstein A, Granier A, Grelle A, Hollinger D, Janssens IA, Jarvis P, Jensen NO, Katul G, Mahli Y, Matteucci G, Meyer ST, Monson R, Munger W, Oechel W, Olson R, Pileguard K, Paw U KT, Thorgeirsson H, Valentini R, Verma S, Vesala T, Wilson K, Wofsy S (2002). Environmental controls over carbon dioxide and water vapor exchange of terrestrial vegetation. Agricultural and Forest Meteorology, 113, 97-120.
DOI URL |
| [9] |
Liu N, Sun PS, Liu SR (2012). Research advances in simulating land water-carbon coupling. Chinese Journal of Applied Ecology, 23, 3187-3196. (in Chinese with English abstract)
URL PMID |
|
[ 刘宁, 孙鹏森, 刘世荣 (2012). 陆地水碳耦合模拟研究进展. 应用生态学报, 23, 3187-3196.]
URL PMID |
|
| [10] |
Liu N, Sun PS, Liu SR, Sun G (2013). Determination of the response unit scale of WASSI-C eco-hydrological model―a case study on the upper Zagunao River watershed. Chinese Journal of Plant Ecology, 37, 132-141. (in Chinese with English abstract)
DOI URL |
|
[ 刘宁, 孙鹏森, 刘世荣, 孙阁 (2013). WASSI-C生态水文模型响应单元空间尺度的确定——以杂古脑流域为例. 植物生态学报, 37, 132-141.]
DOI URL |
|
| [11] |
Mu QZ, Zhao MS, Running SW (2011). Improvements to a MODIS global terrestrial evapotranspiration algorithm. Remote Sensing of Environment, 115, 1781-1800.
DOI URL |
| [12] |
Nash J, Sutcliffe JV (1970). River flow forecasting through conceptual models part I. A discussion of principles. Journal of hydrology, 10, 282-290.
DOI URL |
| [13] | Penman HL (1948). Natural evaporation from open water, bare soil and grass. Proceedings of the Royal Society A: Mathematical Physical and Engineering Sciences, 193, 120-145. |
| [14] | Shi XZ, Yu DS, Xu SX, Warner ED, Wang HJ, Sun WX, Zhao YC, Gong ZT (2010). Cross-reference for relating genetic soil classification of China with WRB at different scales. Geothermal, 155, 344-350. |
| [15] | Su PX, Zhao AF, Zhang LX, Du MW, Chen HS (2003). Characteristic in photosynthesis, transpiration and water use efficiency of Haloxylon ammodendron and Calligonum mongolicum of desert species. Acta Botanica Boreali- Occidentalia Sinica, 23, 11-17. (in Chinese with English abstract) |
| [ 苏培玺, 赵爱芬, 张立新, 杜明武, 陈怀顺 (2003). 荒漠植物梭梭和沙拐枣光合作用、蒸腾作用及水分利用效率特征. 西北植物学报, 23, 11-17.] | |
| [16] |
Sun G, Alstad K, Chen JQ, Chen SP, Ford CR, Lin GH, Liu CF, Lu N, McNulty SG, Miao HX, Noormets A, Vose JM, Wilske B, Zeppel M, Zhang Y, Zhang ZQ (2011a). A general predictive model for estimating monthly ecosystem evapotranspiration. Ecohydrology, 4, 245-255.
DOI URL |
| [17] |
Sun G, Caldwell P, Noormets A, McNulty SG, Cohen E, Myers JM, Domec JC, Treasure E, Mu QZ, Xiao JF, John R, Chen JQ (2011b). Upscaling key ecosystem functions across the conterminous United States by a water-centric ecosystem model. Journal of Geophysical Research, 116, G00J05, doi: 10.1029/2010JG001573.
DOI URL PMID |
| [18] |
Turner DP, Ritts WD, Cohen WB, Gower ST, Running SW, Zhao MS, Costa MH, Kirschbaum AA, Ham JM, Saleska SR, Ahl DE (2006). Evaluation of MODIS NPP and GPP products across multiple biomes. Remote Sensing of Environment, 102, 282-292.
DOI URL |
| [19] | Wang GX, Liu GM, Chang J (2005). Review on some issues of ecohydrology research at the watershed scale. Acta Ecologica Sinica, 25, 892-903. (in Chinese with English abstract) |
| [ 王根绪, 刘桂民, 常娟 (2005). 流域尺度生态水文研究评述. 生态学报, 25, 892-903.] | |
| [20] |
Wang JL, Wen XF, Sun XM, Wang YY (2009). Asymmetry characteristic on the diurnal changes of CO2 and H2O fluxes at full heading time of winter-wheat in North China. Acta Agriculturae Boreali-Sinica, 24, 159-163. (in Chinese with English abstract)
DOI URL |
|
[ 王建林, 温学发, 孙晓敏, 王玉英 (2009). 华北平原冬小麦生态系统齐穗期水碳通量日变化的非对称响应. 华北农学报, 24, 159-163.]
DOI URL |
|
| [21] | Yu GR, Wang QF, Yu ZL (2004). Study on the coupling cycle of water-carbon and process management in terrestrial ecosystem. Advances in Earth Science, 19, 831-839. (in Chinese with English abstract) |
| [ 于贵瑞, 王秋凤, 于振良 (2004). 陆地生态系统水-碳耦合循环与过程管理研究. 地球科学进展, 19, 831-839.] | |
| [22] | Yu Z, Sun PS, Liu SR (2011). Phenological change of main vegetation types along a North-South Transect of Eastern China. Chinese Journal of Plant Ecology, 35, 316-329. (in Chinese with English abstract) |
| [ 余振, 孙鹏森, 刘世荣 (2011). 中国东部南北样带主要植被类型物候期的变化. 植物生态学报, 35, 316-329.] | |
| [23] | Zhang K, Kimball JS, Nemani RR, Running SW (2010). A continuous satellite-derived global record of land surface evapotranspiration from 1983 to 2006. Water Resource Research, 46, W9522, doi: 10.1029/2009WR008800. |
| [24] |
Zhang Y, Yu Q, Jiang J, Tang Y (2008). Calibration of Terra/MODIS gross primary production over an irrigated cropland on the North China Plain and an alpine meadow on the Tibetan Plateau. Global Change Biology, 14, 757-767.
DOI URL |
| [25] | Zhang YQ, Shen YJ, Liu CM, Yu Q, Sun HY, Jia JS, Tang CY, Kondoh A (2002). Measurement and analysis of water, heat and CO2 flux from a farmland in the North China Plain. Acta Geographica Sinica, 57, 333-342. (in Chinese with English abstract) |
| [ 张永强, 沈彦俊, 刘昌明, 于强, 孙宏勇, 贾金生, 唐常源, Kondoh A (2002). 华北平原典型农田水, 热与CO2通量的测定. 地理学报, 57, 333-342.] | |
| [26] |
Zhao FH, Yu GR, Li SG, Ren CY, Sun XM, Mi N, Li J, Ouyang Z (2007). Canopy water use efficiency of winter wheat in the North China Plain. Agricultural Water Management, 93, 99-108.
DOI URL |
| [27] |
Zhao MS, Heinsch FA, Nemani RR, Running SW (2005). Improvements of the MODIS terrestrial gross and net primary production global dataset. Remote Sensing of Environment, 95, 164-176.
DOI URL |
| [28] |
Zhu ZL, Sun XM, Zhang RH, Su HB, Tang XZ (2004). Rapid measurements of CO2 flux density and water use efficiency of crop community. Chinese Journal of Applied Ecology, 15, 1684-1686. (in Chinese with English abstract)
URL PMID |
|
[ 朱治林, 孙晓敏, 张仁华, 苏红波, 唐新斋 (2004). 作物群体CO2通量和水分利用效率的快速测定. 应用生态学报, 15, 1684-1686.]
URL PMID |
| [1] | 刘宁, 孙鹏森, 刘世荣, 孙阁. WASSI-C生态水文模型响应单元空间尺度的确定——以杂古脑流域为例[J]. 植物生态学报, 2013, 37(2): 132-141. |
| 阅读次数 | ||||||
|
全文 |
|
|||||
|
摘要 |
|
|||||
Copyright © 2026 版权所有 《植物生态学报》编辑部
地址: 北京香山南辛村20号, 邮编: 100093
Tel.: 010-62836134, 62836138; Fax: 010-82599431; E-mail: apes@ibcas.ac.cn, cjpe@ibcas.ac.cn
备案号: 京ICP备16067583号-19
![]()