
植物生态学报 ›› 2011, Vol. 35 ›› Issue (5): 512-522.DOI: 10.3724/SP.J.1258.2011.00512 cstr: 32100.14.SP.J.1258.2011.00512
所属专题: 生态系统碳水能量通量
焦振, 王传宽*( ), 王兴昌
收稿日期:2010-11-01
接受日期:2011-03-03
出版日期:2011-11-01
发布日期:2011-06-07
作者简介:* E-mail: wangck-cf@nefu.edu.cn
JIAO Zhen, WANG Chuan-Kuan*(), WANG Xing-Chang
Received:2010-11-01
Accepted:2011-03-03
Online:2011-11-01
Published:2011-06-07
摘要:
为了研究温带落叶阔叶林CO2浓度(摩尔分数, [CO2])的时空变化特征, 利用帽儿山通量塔8层[CO2]廓线系统分析了[CO2]的时间动态及垂直梯度, 并结合森林小气候的同步测定数据探讨了影响[CO2]时空变化的因子。结果表明: 帽儿山温带落叶阔叶林的[CO2]及其垂直梯度具有明显的日变化和季节变化。在日尺度上, [CO2]呈“单峰”曲线, 在夜间或日出前后出现最大值, 日出后迅速降低, 在午后达到最低值, 日落时分又开始迅速升高。在季节尺度上, 生长季的[CO2]日变幅明显大于非生长季, 且冬季(1、2和12月)白天呈“V”型, 其他季节白天呈“U”型, 这与白天对流边界层的持续时间随季节的变化趋势一致。在垂直方向上, [CO2]及其日变幅随高度增加而降低, 并且在生长季夜间湍流交换较弱时其垂直梯度最显著; 植被冠层的光合作用改变了生长旺季白天的[CO2]垂直格局, 使冠层高度的[CO2]最低; 休眠季节该垂直梯度大大减弱。近地层日均[CO2]与土壤温度的趋势相似, 呈单峰曲线; 而林冠上[CO2]在5月初和10月各出现一次峰值, 最低值出现在8月初, 与植被光合作用紧密相关。日尺度上[CO2]及其垂直梯度主要受控于大气边界层和生态系统碳代谢过程; 年尺度上近地层[CO2]主要受控于土壤呼吸, 而林冠上的[CO2]则受生态系统光合作用和呼吸作用的共同控制。
焦振, 王传宽, 王兴昌. 温带落叶阔叶林冠层CO2浓度的时空变异. 植物生态学报, 2011, 35(5): 512-522. DOI: 10.3724/SP.J.1258.2011.00512
JIAO Zhen, WANG Chuan-Kuan, WANG Xing-Chang. Spatio-temporal variations of CO2 concentration within the canopy in a temperate deciduous forest, Northeast China. Chinese Journal of Plant Ecology, 2011, 35(5): 512-522. DOI: 10.3724/SP.J.1258.2011.00512
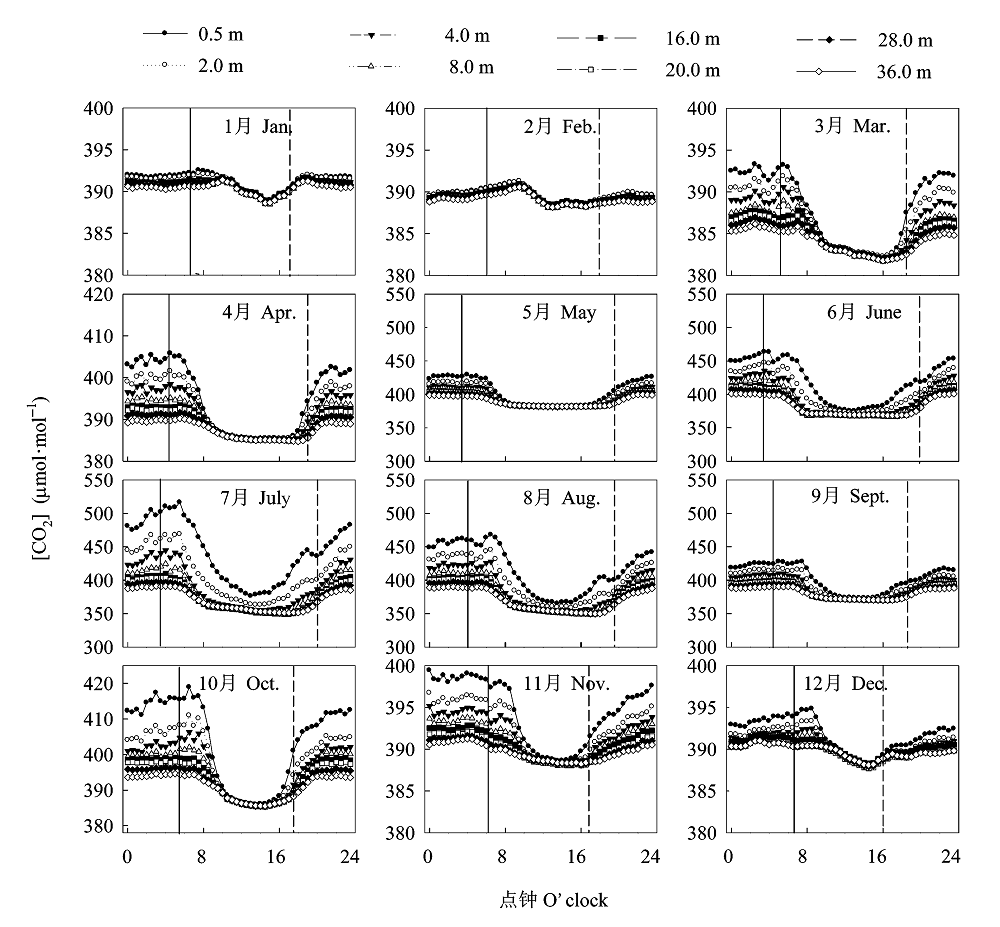
图1 不同高度月平均CO2浓度([CO2])的日变化。图中实竖线和虚竖线分别表示日出和日落时间。
Fig. 1 Diurnal variations of monthly mean CO2 concentration ([CO2]) at various heights. The solid and dashed vertical lines indicate the time of sunrise and sunset, respectively.
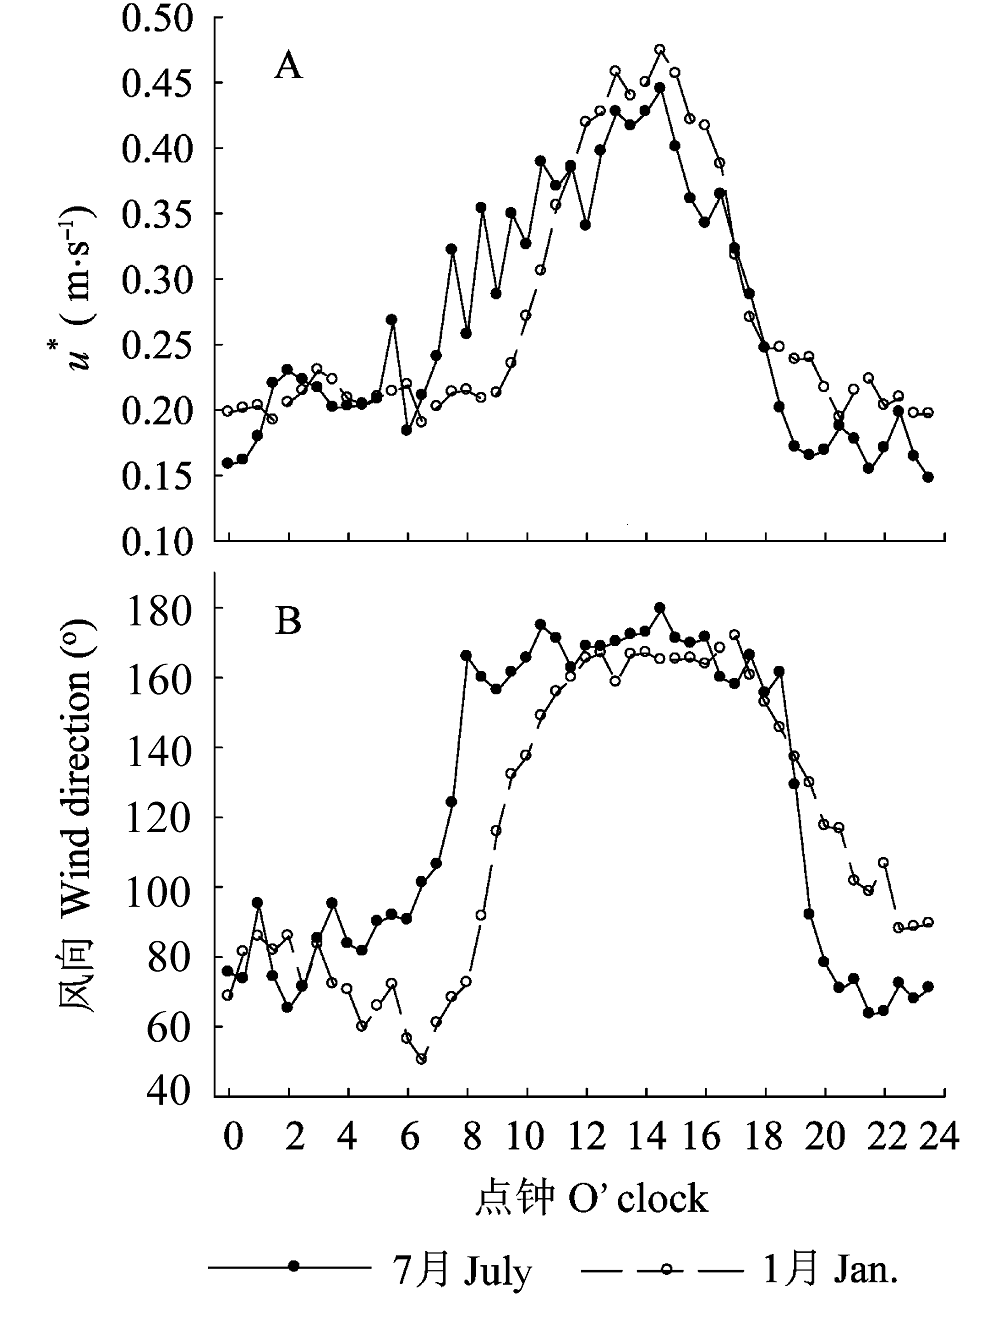
图2 生长季节(7月)和休眠季节(1月)月平均摩擦风速(u*) (A)和风向(B)的日动态。
Fig. 2 Diurnal variations of monthly mean friction velocity (u*) (A) and wind direction (B) in the growing (July) and dormant (January) season.
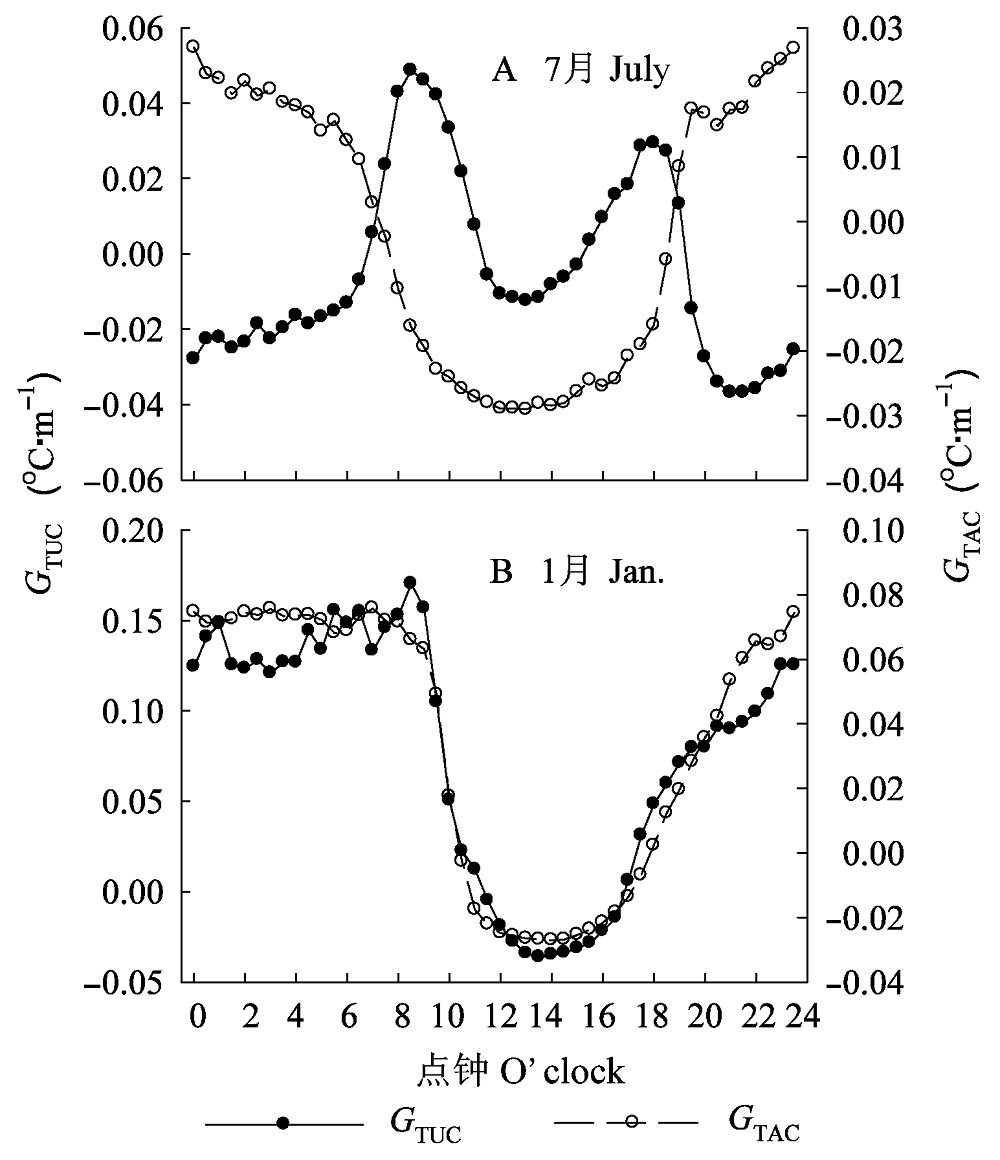
图3 生长季节(7月) (A)和休眠季节(1月) (B)月平均林冠下(GTUC)和林冠上(GTAC)虚位温垂直梯度的日动态。
Fig. 3 Diurnal variations of monthly mean virtual potential temperature gradient under (GTUC) and above (GTAC) canopy in the growing (July) (A) and dormant (January) (B) season.
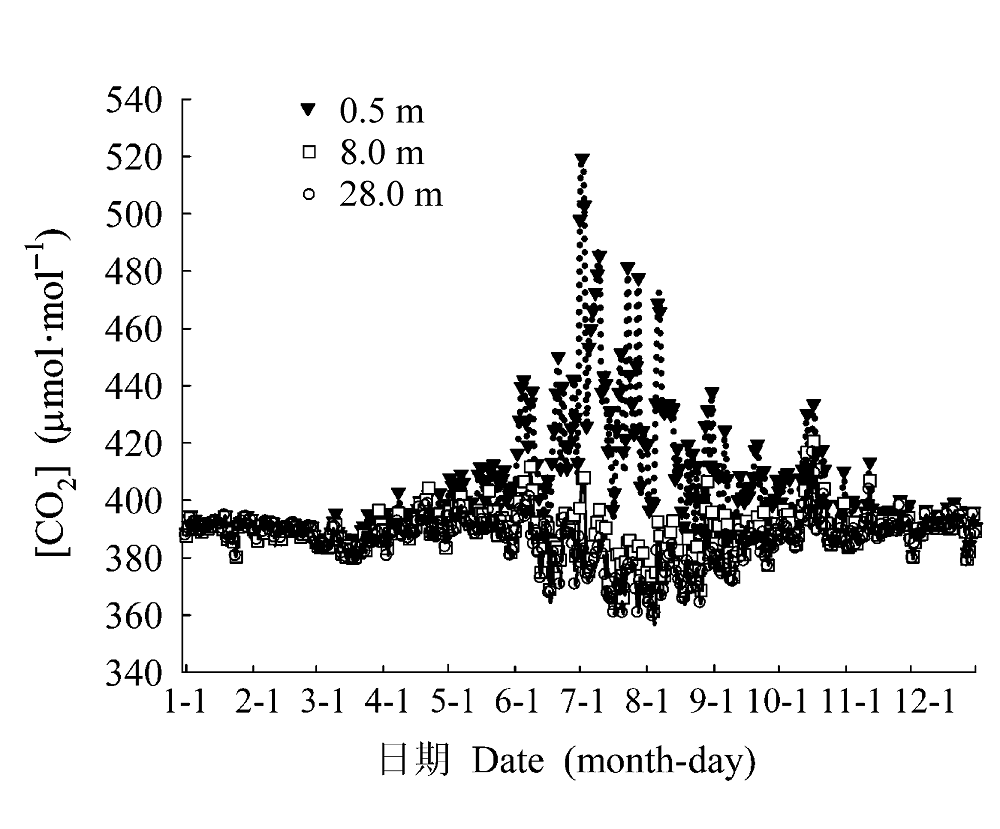
图4 近地层(0.5 m)、冠层内(8.0 m)和林冠上(28.0 m)的日平均CO2浓度([CO2])的季节动态。
Fig. 4 Seasonal variations of daily mean CO2 concentration [CO2] beneath (0.5 m height), within (8.0 m height) and above (28.0 m height) forest canopy.
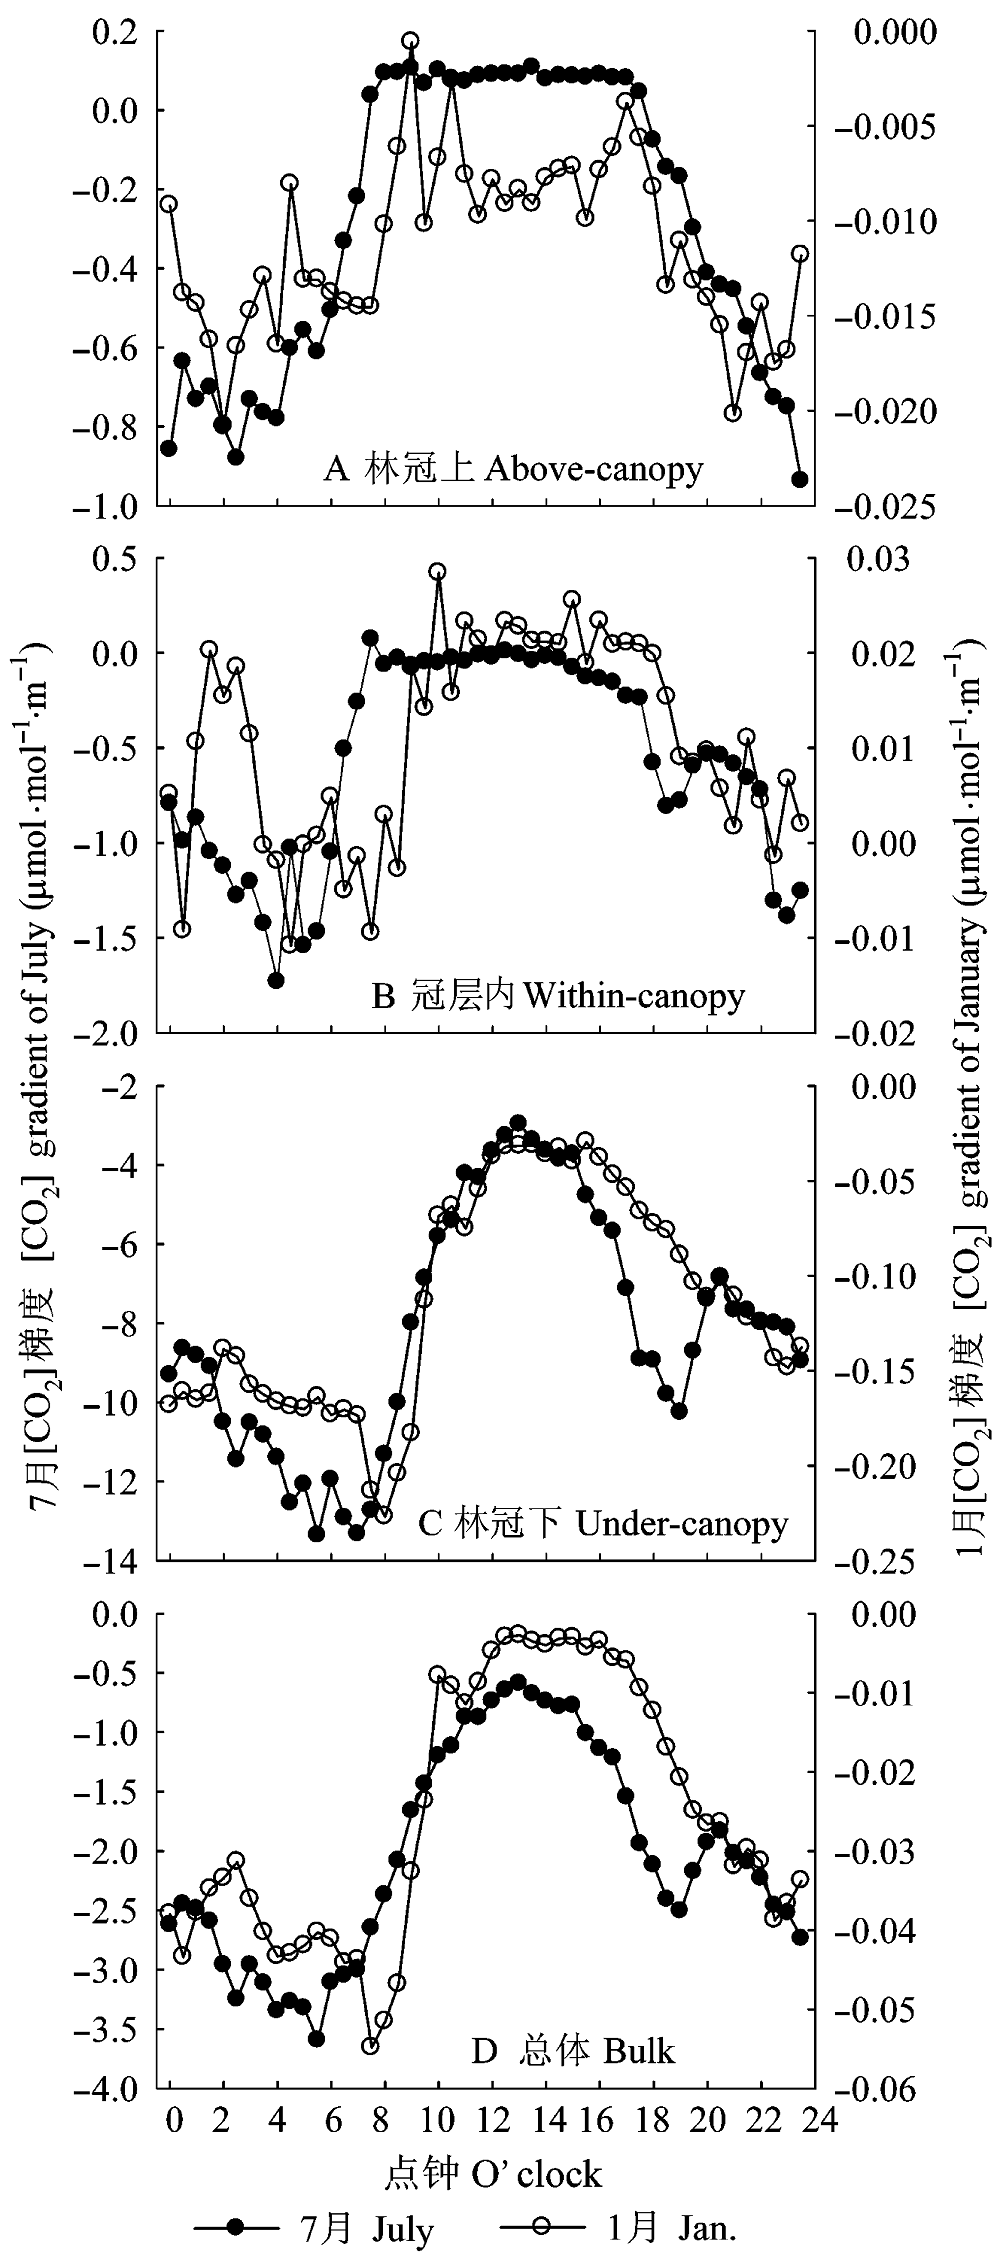
图5 生长季节(7月)和休眠季节(1月)月平均CO2浓度([CO2])的垂直梯度。
Fig. 5 Vertical gradients of monthly mean CO2 concentration ([CO2]) in growing (July) and dormant (January) season.
| 时间尺度 Time scale | [CO2] | u* | PAR | T28.0 m | T2.0 m | T0 cm | T10 cm | SWC10 cm | GTAC |
|---|---|---|---|---|---|---|---|---|---|
| 7月日尺度 Daily scale for July | [CO2]0.5 m | -0.80** | -0.88** | -0.95** | -0.96** | -0.93** | 0.23 | -0.15 | 0.89** |
| [CO2]28.0 m | -0.72** | -0.80** | -0.98** | -0.95** | -0.90** | 0.23 | -0.22 | 0.90** | |
| 1月日尺度 Daily scale for January | [CO2]0.5 m | -0.99** | -0.42** | 0.32** | 0.30** | -0.76** | 0.39** | 0.40** | 0.85** |
| [CO2]28.0 m | -0.76** | -0.63** | -0.49** | -0.49** | -0.56** | 0.31* | 0.29* | 0.54** | |
| 年尺度 Annual scale | [CO2]0.5 m | -0.19** | 0.31** | 0.59** | 0.59** | 0.65** | 0.64** | 0.38** | -0.22** |
| (350) | (366) | (366) | (366) | (366) | (366) | (333) | (366) | ||
| [CO2]28.0 m | -0.10 | -0.32** | -0.41** | -0.41** | -0.45** | -0.47** | -0.05 | 0.35** | |
| (344) | (357) | (357) | (357) | (357) | (357) | (327) | (366) |
表1 近地层(高度0.5 m, [CO2]0.5 m)和林冠上(高度28.0 m, [CO2]28.0 m) CO2浓度(μmol·mol-1)与环境因子的相关性分析
Table 1 Correlation analysis of CO2 concentration (μmol·mol-1) near forest floor (0.5 m height, [CO2]0.5 m) and above canopy (28.0 m height, [CO2]28.0 m) with environmental factors
| 时间尺度 Time scale | [CO2] | u* | PAR | T28.0 m | T2.0 m | T0 cm | T10 cm | SWC10 cm | GTAC |
|---|---|---|---|---|---|---|---|---|---|
| 7月日尺度 Daily scale for July | [CO2]0.5 m | -0.80** | -0.88** | -0.95** | -0.96** | -0.93** | 0.23 | -0.15 | 0.89** |
| [CO2]28.0 m | -0.72** | -0.80** | -0.98** | -0.95** | -0.90** | 0.23 | -0.22 | 0.90** | |
| 1月日尺度 Daily scale for January | [CO2]0.5 m | -0.99** | -0.42** | 0.32** | 0.30** | -0.76** | 0.39** | 0.40** | 0.85** |
| [CO2]28.0 m | -0.76** | -0.63** | -0.49** | -0.49** | -0.56** | 0.31* | 0.29* | 0.54** | |
| 年尺度 Annual scale | [CO2]0.5 m | -0.19** | 0.31** | 0.59** | 0.59** | 0.65** | 0.64** | 0.38** | -0.22** |
| (350) | (366) | (366) | (366) | (366) | (366) | (333) | (366) | ||
| [CO2]28.0 m | -0.10 | -0.32** | -0.41** | -0.41** | -0.45** | -0.47** | -0.05 | 0.35** | |
| (344) | (357) | (357) | (357) | (357) | (357) | (327) | (366) |
| 时间尺度 Time scale | [CO2]梯度 G[CO2] | u* | PAR | T2.0 m | T0 cm | T10 cm | GTUC | GTAC |
|---|---|---|---|---|---|---|---|---|
| 7月日尺度 Daily scale for July | 冠上梯度GAC | 0.80** | 0.86** | 0.87** | 0.76** | -0.46** | 0.73** | -0.95** |
| 冠层梯度GWC | 0.73** | 0.83** | 0.79** | 0.70** | -0.43** | 0.58** | -0.85** | |
| 冠下梯度GUC | 0.70** | 0.75** | 0.80** | 0.82** | -0.07 | 0.03 | -0.68** | |
| 总体梯度GB | 0.80** | 0.87** | 0.90** | 0.88** | -0.23 | 0.24** | -0.84** | |
| 1月日尺度 Daily scale for January | 冠上梯度GAC | 0.52** | 0.50** | 0.53** | 0.34* | -0.53** | -0.50** | -0.61** |
| 冠层梯度GWC | 0.70** | 0.61** | 0.76** | 0.62** | -0.27 | -0.77** | -0.77** | |
| 冠下梯度GUC | 0.86** | 0.68** | 0.96** | 0.86** | -0.19 | -0.96** | -0.94** | |
| 总体梯度GB | 0.86** | 0.71** | 0.96** | 0.83** | -0.27 | -0.96** | -0.95** | |
| 年尺度 Annual scale | 冠上梯度GAC | 0.20** | -0.56** | -0.69** | -0.73** | -0.72** | 0.18** | 0.02 |
| (342) | (355) | (355) | (355) | (355) | (355) | (355) | ||
| 冠层梯度GWC | 0.13** | -0.26** | -0.51** | -0.59** | -0.60** | 0.15** | 0.22** | |
| (342) | (355) | (355) | (355) | (355) | (355) | (355) | ||
| 冠下梯度GUC | 0.13** | -0.40** | -0.67** | -0.75** | -0.75** | 0.15** | 0.28** | |
| (342) | (355) | (355) | (355) | (355) | (355) | (355) | ||
| 总体梯度GB | 0.14** | -0.41** | -0.68** | -0.76** | -0.76** | 0.16** | 0.26** | |
| (342) | (355) | (355) | (355) | (355) | (355) | (355) |
表2 林冠层上(20.0-36.0 m)、林冠层内部(8.0-20.0 m)、林冠层下(0.5-8.0 m)和总体(0.5-36.0 m) CO2浓度[CO2]梯度(μmol·mol-1 m-1)与环境因子的相关性分析
Table 2 Correlation analysis of CO2 concentration [CO2] gradients above canopy (GAC, 20.0-36.0 m), within canopy (Gwc, 8.0-20.0 m), under canopy (GUC, 0.5-8.0 m) and the bulk gradient (GB, 0.5-36.0 m) with environmental factors
| 时间尺度 Time scale | [CO2]梯度 G[CO2] | u* | PAR | T2.0 m | T0 cm | T10 cm | GTUC | GTAC |
|---|---|---|---|---|---|---|---|---|
| 7月日尺度 Daily scale for July | 冠上梯度GAC | 0.80** | 0.86** | 0.87** | 0.76** | -0.46** | 0.73** | -0.95** |
| 冠层梯度GWC | 0.73** | 0.83** | 0.79** | 0.70** | -0.43** | 0.58** | -0.85** | |
| 冠下梯度GUC | 0.70** | 0.75** | 0.80** | 0.82** | -0.07 | 0.03 | -0.68** | |
| 总体梯度GB | 0.80** | 0.87** | 0.90** | 0.88** | -0.23 | 0.24** | -0.84** | |
| 1月日尺度 Daily scale for January | 冠上梯度GAC | 0.52** | 0.50** | 0.53** | 0.34* | -0.53** | -0.50** | -0.61** |
| 冠层梯度GWC | 0.70** | 0.61** | 0.76** | 0.62** | -0.27 | -0.77** | -0.77** | |
| 冠下梯度GUC | 0.86** | 0.68** | 0.96** | 0.86** | -0.19 | -0.96** | -0.94** | |
| 总体梯度GB | 0.86** | 0.71** | 0.96** | 0.83** | -0.27 | -0.96** | -0.95** | |
| 年尺度 Annual scale | 冠上梯度GAC | 0.20** | -0.56** | -0.69** | -0.73** | -0.72** | 0.18** | 0.02 |
| (342) | (355) | (355) | (355) | (355) | (355) | (355) | ||
| 冠层梯度GWC | 0.13** | -0.26** | -0.51** | -0.59** | -0.60** | 0.15** | 0.22** | |
| (342) | (355) | (355) | (355) | (355) | (355) | (355) | ||
| 冠下梯度GUC | 0.13** | -0.40** | -0.67** | -0.75** | -0.75** | 0.15** | 0.28** | |
| (342) | (355) | (355) | (355) | (355) | (355) | (355) | ||
| 总体梯度GB | 0.14** | -0.41** | -0.68** | -0.76** | -0.76** | 0.16** | 0.26** | |
| (342) | (355) | (355) | (355) | (355) | (355) | (355) |
| [1] |
Baldocchi D (2008). “Breathing” of the terrestrial biosphere: lessons learned from a global network of carbon dioxide flux measurement systems. Australian Journal of Botany, 56, 1-26.
DOI URL |
| [2] |
Bazzaz FA, Williams WE (1991). Atmospheric CO2 concentrations within a mixed forest: implications for seedling growth. Ecology, 72, 12-16.
DOI URL |
| [3] |
Bousquet P, Peylin P, Ciais P, Le Quéré C, Friedlingstein P, Tans PP (2000). Regional changes in carbon dioxide fluxes of land and oceans since 1980. Science, 290, 1342-1346.
URL PMID |
| [4] |
Brooks JR, Flanagan LB, Varney GT, Ehleringer JR (1997). Vertical gradients in photosynthetic gas exchange characteristics and refixation of respired CO2 within boreal forest canopies. Tree Physiology, 17, 1-12.
DOI URL PMID |
| [5] | Buchmann N, Kao WY, Ehleringer JR (1996). Carbon dioxide concentrations within forest canopies—variation with time, stand structure, and vegetation type. Global Change Boilogy, 2, 421-432. |
| [6] |
Canadell JG, Mooney HA, Baldocchi DD, Berry JA, Ehleringer JR, Field CB, Gower ST, Hollinger DY, Hunt JE, Jackson RB, Running SW, Shaver GR, Steffen W, Trumbore SE, Valentini R, Bond BY (2000). Carbon metabolism of the terrestrial biosphere: a multitechnique approach for improved understanding. Ecosystems, 3, 115-130.
DOI URL |
| [7] | Chen BF (陈步峰), Lin MX (林明献), Li YD (李意德), Qiu JR (邱坚锐), Luo TS (骆土寿), Zhou TF (周铁烽) (2001). Space-time character of CO2 content in tropical mountain rain forest of Jianfengling, Hainan. Acta Ecologica Sinica (生态学报), 21, 2089-2095. (in Chinese with English abstract) |
| [8] |
Ciais P, Rayner P, Chevallier F, Bousquet P, Logan M, Peylin P, Ramonet M (2010). Atmospheric inversions for estimating CO2 fluxes: methods and perspectives. Climatic Change, 103, 69-92.
DOI URL |
| [9] |
Culf AD, Fisch G, Malhi Y, Nobre CA (1997). The influence of the atmospheric boundary layer on carbon dioxide concentrations over a tropical forest. Agricultural and Forest Meteorology, 85, 149-158.
DOI URL |
| [10] |
de Araújo AC, Dolman AJ, Waterloo MJ, Gash JHC, Kruijt B, Zanchi FB, de Lange JME, Stoevelaar R, Manzi AO, Nobre AD, Lootens RN, Backer J (2010). The spatial variability of CO2 storage and the interpretation of eddy covariance fluxes in central Amazonia. Agricultural and Forest Meteorology, 150, 226-237.
DOI URL |
| [11] |
de Araújo AC, Kruijt B, Nobre AD, Dolman AL, Waterloo MJ, Moors EJ, de Souza JS (2008). Nocturnal accumulation of CO2 underneath a tropical forest canopy along a topographical gradient. Ecological Applications, 18, 1406-1419.
DOI URL PMID |
| [12] | de Selm HR (1952). Carbon dioxide gradient in a beech forest in central Ohio. The Ohio Journal of Science, 52, 187-198. |
| [13] |
Feigenwinter C, Mölder M, Lindroth A, Aubinet M (2010). Spatiotemporal evolution of CO2 concentration, temperature, and wind field during stable nights at the Norunda forest site. Agricultural and Forest Meteorology, 150, 692-701.
DOI URL |
| [14] |
Finnigan J (2006). The storage term in eddy flux calculations. Agricultural and Forest Meteorology, 136, 108-113.
DOI URL |
| [15] | Garrett HE, Cox GS, Roberts JE (1978). Spatial and temporal variations in carbon dioxide concentrations in an oak- hickory forest ravine. Forest Science, 24, 180-190. |
| [16] | Gilmanov TG, Verma SB, Sims PL, Meyers TP, Bradford JA, Burba GG, Suyker AE (2003). Gross primary production and light response parameters of four Southern Plains ecosystems estimated using long-term CO2-flux tower measurements. Global Biogeochemical Cycles, 17, 1071, doi: 10.1029/2002GB002023. |
| [17] | Jiang GM (蒋高明), Han XG (韩兴国), Zhou GS (周广胜) (1997). Changes of atmospheric CO2, photosynthesis of the grass layer and soil CO2 evolution in a typical temperate deciduous forest stand in the mountainous areas of Beijing. Acta Botanica Sinica (植物学报), 39, 653-660. (in Chinese with English abstract) |
| [18] | Jiang GM (蒋高明), Huang YX (黄银晓), Han XG (韩兴国) (1998). Changes in atmospheric CO2 of urban and mountain forest areas during the summer and autumn seasons. Acta Scientiae Circumstantiae (环境科学学报), 18, 108-111. (in Chinese with English abstract) |
| [19] |
Kondo M, Muraoka H, Uchida M, Yazaki Y, Koizumi H (2005). Refixation of respired CO2 by understory vegetation in a cool-temperate deciduous forest in Japan. Agricultural and Forest Meteorology, 134, 110-121.
DOI URL |
| [20] | Lasslop G, Reichstein M, Papale D, Richardson AD, Arneth A, Barr A, Stoy P, Wohlfahrt G (2010). Separation of net ecosystem exchange into assimilation and respiration using a light response curve approach: critical issues and global evaluation. Global Change Biology, 16, 178-208. |
| [21] |
Leuning R, Zegelin SJ, Jones K, Keith H, Hughes D (2008). Measurement of horizontal and vertical advection of CO2 within a forest canopy. Agricultural and Forest Meteorology, 148, 1777-1797.
DOI URL |
| [22] | Liu S (刘实), Wang CK (王传宽), Xu F (许飞) (2010). Soil effluxes of carbon dioxide, methane and nitrous oxide during non-growing season for four temperate forests in northeastern China. Acta Ecologica Sinica (生态学报), 30, 4075-4084. (in Chinese with English abstract) |
| [23] | Murayama S, Saigusa N, Chan D, Yamamoto S, Kondo H, Eguchi Y (2003). Temporal variations of atmospheric CO2 concentration in a temperate deciduous forest in central Japan. Tellus, 55B, 232-243. |
| [24] | Ohkubo S, Kosugi Y, Takanashi S, Matsuo N, Tani M, Nik AR (2008). Vertical profiles and storage fluxes of CO2, heat and water in a tropical rainforest at Pasoh, Peninsular Malaysia. Tellus, 60B, 569-582. |
| [25] |
Osborne CP, Drake BG, LaRoche J, Long SP (1997). Does long-term elevation of CO2 concentration increase photosynthesis in forest floor vegetation? (Indiana strawberry in a Maryland forest). Plant Physiology, 114, 337-344.
DOI URL PMID |
| [26] |
Skelly JM, Fredericksen TS, Savage JE, Snyder KR (1996). Vertical gradients of ozone and carbon dioxide within a deciduous forest in Central Pennsylvania. Environmental Pollution, 94, 235-240.
URL PMID |
| [27] |
Stephens BB, Gurney KR, Tans PP, Sweeney C, Peters W, Bruhwiler L, Ciais P, Ramonet M, Bousquet P, Nakazawa T, Aoki S, Machida T, Inoue G, Vinnichenko N, Lloyd J, Jordan A, Heimann M, Shibistova O, Langenfelds RL, Steele LP, Francey RJ, Denning AS (2007). Weak northern and strong tropical land carbon uptake from vertical profiles of atmospheric CO2. Science, 316, 1732-1735.
URL PMID |
| [28] |
Sun JL, Burns SP, Delany AC, Oncley SP, Turnipseed AA, Stephens BB, Lenschow DH, LeMone MA, Monson PK, Anderson DE (2007). CO2 transport over complex terrain. Agricultural and Forest Meteorology, 145, 1-21.
DOI URL |
| [29] |
Takagi M (2009). Atmospheric carbon dioxide concentration within a narrow valley in a forested catchment area. Journal of Forest Research, 14, 286-295.
DOI URL |
| [30] | Tan ZH (谭正洪), Zhang YP (张一平), Yu GR (于贵瑞), Song QH (宋清海), Gao JM (高举明), Yang Z (杨振), Sun XM (孙晓敏), Zhao SJ (赵双菊) (2008). Spatial and temporal dynamics of CO2 concentration and its causes in Xishuangbanna tropical seasonal rain forest, China. Journal of Plant Ecology (Chinese Version) (植物生态学报), 32, 555-567. (in Chinese with English abstract) |
| [31] | Wu JB (吴家兵), Guan DX (关德新), Zhao XS (赵晓松), Han SJ (韩士杰), Yu GR (于贵瑞), Sun XM (孙晓敏) (2005). CO2 concentration character in broad-leaved Korean pine forest of Changbai Mountains. Chinese Journal of Applied Ecology (应用生态学报), 16, 49-53. (in Chinese with English abstract) |
| [32] |
Xiao XM, Boles S, Liu JY, Zhuang DF, Liu ML (2002). Characterization of forest types in Northeastern China, using multi-temporal SPOT-4 VEGETATION sensor data. Remote Sensing of Environment, 82, 335-348.
DOI URL |
| [33] |
Xu LK, Matista AA, Hsiao TC (1999). A technique for measuring CO2 and water vapor profiles within and above plant canopies over short periods. Agricultural and Forest Meteorology, 94, 1-12.
DOI URL |
| [34] | Yang JY (杨金艳), Wang CK (王传宽) (2006). Effects of soil temperature and moisture on soil surface CO2 flux of forests in northeastern China. Journal of Plant Ecology (Chinese Version) (植物生态学报), 30, 286-294. (in Chinese with English abstract) |
| [35] | Yang K (杨阔), Wang CK (王传宽), Jiao Z (焦振) (2010). Vernal soil respiration of five temperate forests in Northeastern China. Acta Ecologica Sinica (生态学报), 30, 3155-3162. (in Chinese with English abstract) |
| [36] | Yang SH (杨思河), Lin JH (林继惠), Wen SY (文诗韵), Yin ZF (尹忠馥) (1992). CO2 environment of natural forests in Changbai Mountain—a preliminary study. Chinese Journal of Ecology (生态学杂志), 11(5), 56-58. (in Chinese) |
| [37] |
Yi CX, Anderson DE, Turnipseed AA, Burns SP, Sparks JP, Stannard DI, Monson RK (2008). The contribution of advective fluxes to net ecosystem exchange in a high-elevation, subalpine forest. Ecological Applications, 18, 1379-1390.
DOI URL PMID |
| [38] | Zhang M (张弥), Wen XF (温学发), Yu GR (于贵瑞), Zhang LM (张雷明), Fu YL (伏玉玲), Sun XM (孙晓敏), Han SJ (韩士杰) (2010). Effects of CO2 storage flux on carbon budget of forest ecosystem. Chinese Journal of Applied Ecology (应用生态学报), 21, 1201-1209. (in Chinese with English abstract) |
| [39] | Zhou MY (周明煜), Qian FL (钱粉兰), Li SM (李诗明), Chen Z (陈陟), Su LR (苏立荣) (2000). Study on the wind profiles and turbulent structure in the baroclinic convective boundary layer. Chinese Journal of Geophysics (地球物理学报), 43, 296-303. (in Chinese with English abstract) |
| [40] | Zhu N (祝宁), Jiang H (江洪), Jin YY (金永岩) (1990). A phenology study on the common tree species of natural secondary forests in Northeast China. Acta Phytoecologica et Geobotanica Sinica (植物生态学与地植物学学报), 14, 336-349. (in Chinese with English abstract) |
| No related articles found! |
| 阅读次数 | ||||||
|
全文 |
|
|||||
|
摘要 |
|
|||||
Copyright © 2026 版权所有 《植物生态学报》编辑部
地址: 北京香山南辛村20号, 邮编: 100093
Tel.: 010-62836134, 62836138; Fax: 010-82599431; E-mail: apes@ibcas.ac.cn, cjpe@ibcas.ac.cn
备案号: 京ICP备16067583号-19
![]()