


全球变化与陆地生态系统(Global change and terrestrial ecosystem, GCTE)是全球变化研究的重要内容,而气候变化对陆地生态系统的影响及其反馈是GCTE研究的热点(IPCC, 2001)。归一化植被指数(Normalized difference vegetation index, NDVI) 能反映吸收的光合有效辐射、叶绿素密度、叶面积以及蒸发速率等植被参数(DeFries et al., 1995),因此NDVI 数据已经广泛应用于植被覆盖 (Myneni et al., 1997; Tucker et al., 2001)、生物量 (Myneni et al., 2001) 、NPP (Net primary production) (Hicke et al., 2002) 以及物候 (Jenkins et al., 2002) 等方面的研究。
气候变化是植被活动年际变化的重要影响因素(Keeling et al., 1996; Weltzin et al., 2003)。NDVI与气候因子之间的相关关系已经在区域尺度(Li & Kafatos, 2000)和全球尺度(Schultz & Halpert, 1995)上得到广泛证明。总体上,NDVI与气候因子的关系研究可以大致分为两类:一类是基于NDVI与气候因子空间变化的空间相关模型(Wang et al., 2001; Jobbagy et al., 2002);另一类则是基于NDVI与气候因子时间变化的时间相关模型 (李晓兵和史培军, 2000; Jobbagy et al., 2002; Piao et al., 2003, 2004; Wang et al., 2003)。两者的区别在于:空间相关模型描述了不同生态系统的空间变化,反映了气候变化对植被的长期效应;而时间相关模型描述了同一生态系统的时间变化,反映了气候变化对植被的短期效应(Jobbagy et al., 2002)。
已有的研究表明,草地植被对气候变化反应敏感(Zavaleta et al., 2003a, 2003b)。青藏高原属于气候变化的敏感区和生态脆弱带(孙鸿烈和郑度, 1998),是研究陆地生态系统对气候变化响应机制的理想场所。草地植被占青海-西藏高原植被总面积的63.9%,是高原最重要的植被类型(中国科学院中国植被图编辑委员会, 2001)。因此,青藏高原草地植被覆盖变化及其气候驱动机制已成为人们十分关注的问题。但是,截至目前尚未报道过类似的研究。为此,我们利用较长时间序列(1982~1999年)的NDVI数据及其所对应的温度和降水资料,试图揭示18年来青藏高原3种草地(温性草原、高寒草原、高寒草甸)植被覆盖的年际变化,阐明驱动研究区3种草地植被覆盖变化的主要气候因子。
1 数据和方法
1.1 研究区概况
青藏高原位于中国西南部,平均海拔4 000 m以上,属于中国大陆地势最高的一级台阶。具有构造地貌、河流地貌、冰川地貌、湖泊地貌等多种地貌类型。太阳辐射量达0.586 1~0.795 4 MJ·cm-2·a-1,是我国太阳总辐射值最高的地区。其地形复杂,海拔变化大,地面气温区域差异显著;温度季节差异明显。降水主要受西南季风控制,自东南向西北方向逐渐减少;降水季节分配极不均匀,雨季和旱季分异明显。需要说明的是,本文的研究区域仅包括青海和西藏两省。研究区草地植被的覆盖面积为117.7万km2,占其植被总面积的63.9%,约相当于中国国土面积的1/10(中国科学院中国植被图编辑委员会, 2001)。研究区草地植被主要包括高寒草甸、高寒草原、温性草原3种类型(图1)。其中,高寒草甸主要分布于高原东部,分布区海拔为3 200~5 200 m,年均温0 ℃以下,年降水量为400~700 mm;高寒草原主要分布于高原中西部以及昆仑山和祁连山等地区,分布区海拔高、寒冷而干旱;温性草原主要分布于高原东部的湟水流域,分布区气温较高,年降水量为350 mm左右(李文华和周兴民, 1998)。
图1
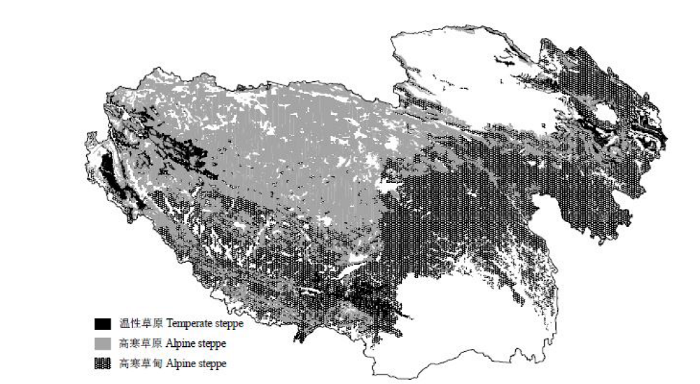
图1
青海-西藏高原草地分布图
Fig.1
Distribution of grasslands on the Qinghai-Xizang Plateau
1.2 数据来源
1.2.1 NDVI数据
本研究所用的NDVI数据为GIMMS(Global inventory monitoring and modeling studies)研究组提供的1982~1999年的每旬NDVI数据。时间分辨率为15 d,空间分辨率为8 km × 8 km(Tucker et al., 2001; Zhou et al., 2001)。该NDVI数据集消除了火山爆发、太阳高度角、传感器灵敏度随时间变化等影响,因此在全球及区域大尺度植被活动变化研究中应用广泛(Myneni et al., 2001; Tucker et al., 2001; Zhou et al., 2001, 2003; Piao et al., 2003)。
每月的NDVI数据通过国际通用的MVC(Maximum value composition)法(式1)获得,该法可以进一步消除云、大气、太阳高度角等的部分干扰(Holben, 1986)。
式中,NDVIi为第i月的NDVI值,NDVIij为第i月第j旬的NDVI值。
对通过MVC法获得的图像进行投影变换,获得空间分辨率为0.1°×0.1°、投影方式为经纬网投影的栅格图像。然后结合3种草地植被的空间分布数据,计算每种草地类型的月NDVI。在此基础上计算不同季节的NDVI。需要说明的是:1)在植被覆盖率低的地区,NDVI值受下垫面因素的影响较大,因此我们只考虑NDVI平均值大于0.1的像元。2)考虑到青藏高原特殊的气候环境以及植被的生长情况,本文对季节作如下规定:生长季为5~9月,春季为5月,夏季为6~8月,秋季为9月。3)文中出现的NDVI年平均增加量定义为NDVI与年份的回归直线的斜率,NDVI年平均增加率定义为年平均增加量与NDVI平均值的比值。
1.2.2 气候数据
所用的气候数据为国家气象局提供的1982~1999年680个气象站的月平均气温和月降水资料。首先对680个气象站点的气候数据进行Kriging插值,然后将通过插值获得的图像进行投影变换,转换为空间分辨率为0.1°×0.1°、投影方式为经纬网投影的栅格图像(Piaoet al., 2003)。利用3种草地植被的空间分布数据,分别计算每种草地类型的月平均气温和月降水。在此基础上计算不同季节的气候数据。
1.2.3 植被空间分布数据
所用的植被空间分布数据为1:100万中国植被图(中国科学院中国植被图编辑委员会,2001)。首先利用方正智绘5.01数字化1:100万中国植被图,然后对数字化的植被图进行投影变换和格式变换,将其转换成空间分辨率0.1°×0.1°、投影方式为经纬网投影的栅格图像。最后,将栅格格式植被图中的草地植被划分为高寒草甸、高寒草原和温性草原3个类型。
2 结果
2.1 生长季NDVI的年际变化
图2显示1982~1999年间研究区生长季NDVI、温度和降水的变化趋势。从图中可以看出,18年来研究区生长季NDVI呈显著增加趋势(p=0.015),即从1982年的0.23增加到1999年的0.26,平均每年增加0.001 0,年平均增加率为0.41%。18年来研究区生长季温度虽然有所波动,但增加趋势十分明显,平均每年增加0.071 ℃。生长季降水量的年际变化波动较大,没有明显的趋势。
图2
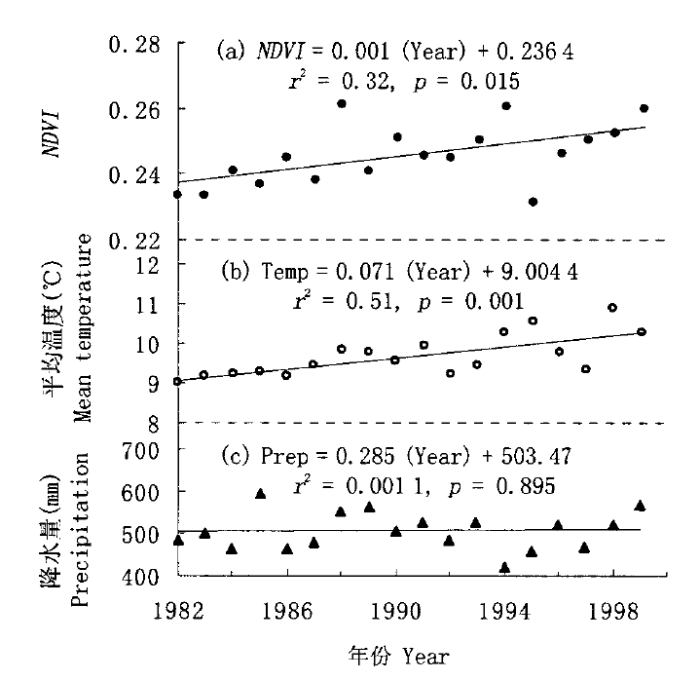
图2
1982~1999年青藏高原草地生长季平均NDVI、平均温度和降水量的年际变化
Fig.2
Interannual variations in growing season's mean NDVI, mean temperature, and precipitation of grasslands on the Tibetan Plateau over the period of 1982-1999
图3
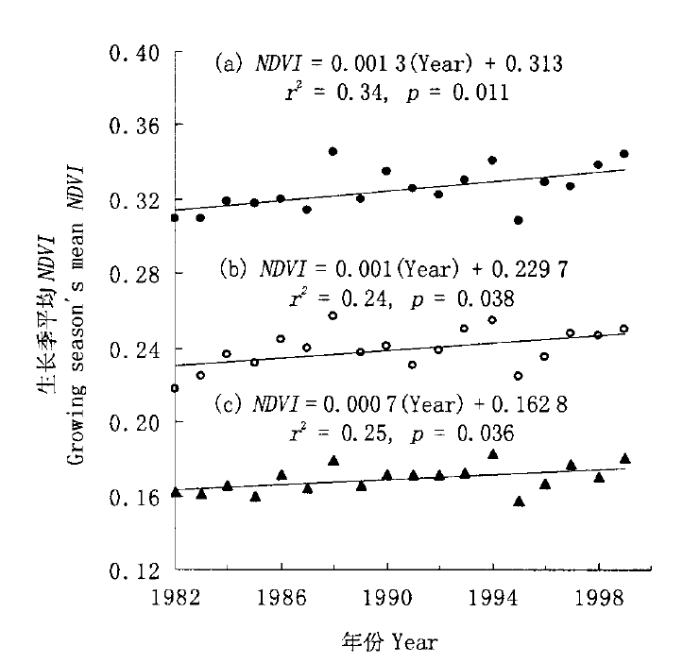
图3
1982~1999年高寒草甸(a)、温性草原(b)和高寒草原(c)生长季平均NDVI的年际变化
Fig.3
Interannual variations in growing season's mean NDVI over the period of 1982-1999 for alpine meadow (a), temperate steppe (b), and alpine steppe (c)
2.2 不同季节NDVI的年际变化
图4
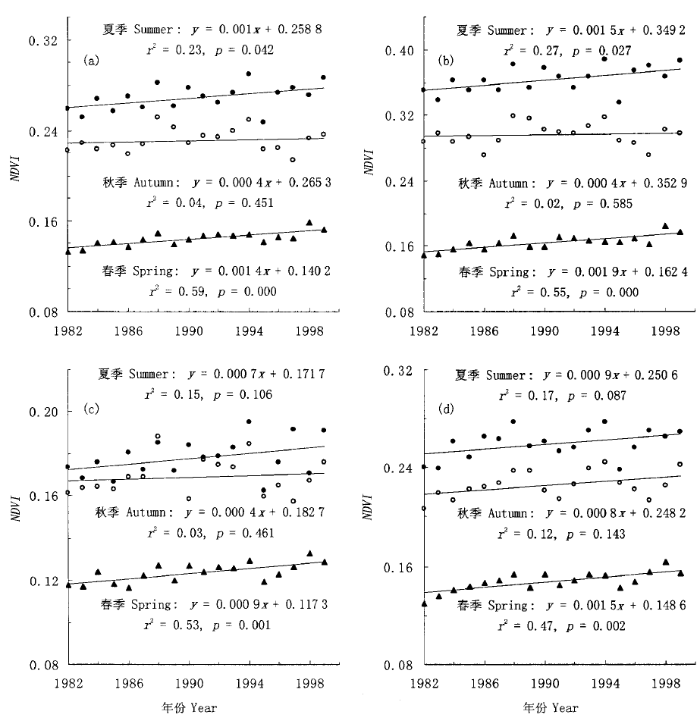
图4
1982~1999年整个研究区(a)、高寒草甸(b)、高寒草原(c)和温性草原(d)不同季节平均NDVI的变化
Fig.4
Interannual variations in seasonal mean NDVI over the period of 1982-1999 for study area (a), alpine meadow (b), alpine steppe (c), and temperate steppe (d)
表1 1982~1999年间不同季节NDVI的变化量和变化率
Table 1
| NDVI变化量 NDVI changing magnitude (a-1) | NDVI变化率 NDVI changing ratio (a-1) | ||||||||||
|---|---|---|---|---|---|---|---|---|---|---|---|
| 生长季 Growing season | 春季 Spring | 夏季 Summer | 秋季 Autumn | 生长季 (%) Growing season | 春季 (%) Spring | 夏季 (%) Summer | 秋季 (%) Autumn | ||||
| 研究区域Study area | 0.001 0 | 0.001 4 | 0.001 0 | 0.000 4 | 0.41 | 0.92 | 0.37 | 0.15 | |||
| 高寒草甸Alpine meadow | 0.001 3 | 0.001 9 | 0.001 5 | 0.000 4 | 0.39 | 1.10 | 0.41 | 0.11 | |||
| 高寒草原Alpine steppe | 0.000 7 | 0.000 9 | 0.000 7 | 0.000 4 | 0.41 | 0.72 | 0.39 | 0.22 | |||
| 温性草原Temperate steppe | 0.001 0 | 0.001 5 | 0.000 9 | 0.000 8 | 0.42 | 0.92 | 0.35 | 0.31 | |||
图4给出了整个研究区和不同草地类型的不同季节NDVI变化趋势。从图中可以看出,研究区春季和夏季NDVI均显著增加(p<0.01;p=0.042),而秋季NDVI则没有明显的变化趋势(p=0.451)。不同季节NDVI变化情况(变化量和变化率)有所差异。其中春季NDVI年平均增加量和增加率均为最大,分别为0.001 4和0.92%。夏季NDVI的变化对生长季NDVI增加的贡献相对较低,其增加量为0.001 0 a-1。
3种草地植被春、夏、秋季NDVI变化趋势大致相同(图4)。如图4所示,高寒草甸春季和夏季NDVI均显著增加(p<0.01;p=0.027),而秋季NDVI则没有明显的变化趋势(p=0.585)。温性草原和高寒草原春季NDVI显著增加(p=0.002; p=0.001); 夏季NDVI呈增加趋势,但都不显著(p=0.087; p=0.106);而秋季NDVI变化不明显(p=0.143; p=0.461)。表1给出了18年来青藏高原草地不同季节NDVI的变化量和变化率。从表中可以看出,春季为3种草地植被(高寒草甸、高寒草原、温性草原)NDVI增加最快的季节,增加率分别为1.10%、0.72%和0.92% a-1;春季还是3种草地植被(高寒草甸、高寒草原、温性草原)NDVI增加量最大的季节,增加量分别为0.001 9、0.000 9和0.001 5 a-1。
2.3 NDVI变化与气候的关系
为了揭示青藏高原草地植被不同季节NDVI年际变化与气候因子的关系,我们对春、夏、秋季NDVI和对应的温度、降水进行了相关分析。同时考虑到植被生长对气候变化存在滞后效应(Braswell et al., 1997),我们还对不同季节NDVI与其所对应前一季节的气候因子作了相关分析。
对于整个研究区而言,春季NDVI与春季温度显著正相关(r=0.64, p=0.004),而与春季降水没有显著的相关关系(r=-0.20, p=0.425)。夏季温度的增加有利于夏季NDVI的增加(r=0.40, p=0.097),而夏季降水和春季降水对夏季植被的生长影响不大(r=-0.30, p=0.229; r=0.36, p=0.148)。秋季NDVI与秋季温度显著正相关(r=0.56, p=0.016),而与夏季降水和秋季降水均没有表现出明显的相关关系(r=0.28, p=0.267; r=-0.26, p=0.307)。可见,研究区春季、夏季NDVI的增加是由温度上升所致。特殊的是,虽然秋季温度与秋季NDVI的关系密切,但秋季NDVI却没有表现出显著的变化趋势。
高寒草地(高寒草甸和高寒草原)春季NDVI与春季温度均显著正相关(r=0.69, p<0.001;r=0.51, p=0.032),而与春季降水不相关 (r=-0.10, p=0.699; r=-0.25, p=0.308)。夏季NDVI的变化与夏季温度密切相关(r=0.61, p=0.007; r=0.40, p=0.099),而与夏季降水没有明显的相关关系(r=-0.24, p=0.35; r=-0.29, p=0.23)。但是,夏季NDVI与春季降水关系密切(r=0.49, p=0.038; r=0.51, p=0.032)。高寒草地(高寒草甸、高寒草原)春、夏季NDVI变化均受温度的影响。这意味着温度是高寒草地植被生长的限制因子,温度上升能促进草地植被的生长。夏季NDVI与春季降水的正相关关系表明,高寒草地植被的生长对降水变化存在滞后效应。两种草地秋季NDVI与气候的相关关系不尽相同。高寒草甸秋季NDVI与秋季温度密切相关(r=0.68, p=0.002),而与秋季降水和夏季降水没有明显的相关关系(r=-0.05, p=0.846; r=0.33, p=0.185)。高寒草原秋季NDVI与秋季温度、秋季降水以及夏季降水均没有显著的统计关系(r=0.28, p=0.268; r=-0.37, p=0.130; r=0.17, p=0.502)。
温性草原春季NDVI与春季温度显著正相关(r=0.54, p=0.021),而与春季降水没有显著的相关关系(r=0.17, p=0.490)。夏季NDVI的变化和夏季温度、夏季降水以及春季降水都没有表现出显著的相关关系(r=0.30, p=0.226; r=0.21, p=0.406; r=0.36, p=0.141)。秋季NDVI受秋季温度影响(r=0.40, p=0.097),而与秋季降水没有明显的相关关系(r=0.19, p=0.45)。但是,秋季NDVI却与夏季降水显著正相关(r=0.52, p=0.028)。
3 讨论
青藏高原作为地球上独特的自然区域,其气候变化与中国其它地区相比存在明显差异,同时又具有一定联系(汤懋苍和李存强, 1992)。 18年来研究区生长季温度平均每年增加0.071 ℃,高于全国的0.046 ℃ (Piao et al., 2004)。冰芯记录的结果显示青藏高原古代气温和现代气温变化幅度均比低海拔地区大(姚檀栋等, 2000)。冻土退化的研究结果也证实了青藏高原气温转暖的事实(南卓铜等, 2003)。可以看出,近20年来青藏高原的气温变化与全国一致,表现为升温,但升温幅度较大。高寒草地属于对全球变化较为敏感的生态系统类型(Zhang et al., 1996)。我们的研究表明,18年来研究区生长季NDVI显著增加 (p=0.015),年平均增加率为0.41%,与全国平均值相当(0.44% a-1) (Piao et al., 2004)。定位观测的数据也支持这一观点。定位研究的结果显示,1980~1990年间高寒草甸(以矮嵩草(Kobresia humilis)草甸为例)的地上生物量显著增加(李文华和周兴民, 1998)。
导致北半球陆地植被生长季NDVI增加的因素理论上主要来自3方面:生长季的提前、生长季的生长加速以及生长季的延长(Myneni et al., 1997; Piao et al., 2003)。研究区春季和夏季NDVI均显著增加 (p<0.01;p=0.042),而秋季NDVI则没有明显的变化趋势(p=0.451)。可以看出,生长季提前和生长季生长加速是青藏高原草地植被生长季NDVI增加的主要原因。春季为NDVI增加量和增加率最大的季节,而夏季NDVI的增加对生长季NDVI增加的贡献相对较小。这与Zhou等(2001)得出的春季提前是导致北半球植被活动增强的主要原因的结论一致。但青藏高原秋季植被活动变化不显著,而Zhou 等(2001)在北半球尺度(40°~70° N)上以及Piao 等(2003)在国家尺度上的研究则显示北半球和中国的秋季植被活动在增强。
草地NDVI与气候关系密切(Jobbagy et al., 2002; Wang et al., 2003)。我们的研究显示,3种草地春季NDVI变化与春季温度显著正相关,这意味着春季NDVI的增加是由春季温度上升所致。春季温度增加导致植被生长季提前(Keeling et al., 1996; Myneni et al., 1997; Zhou et al., 2001),从而使得春季植被活动增强。高寒草地(高寒草甸、高寒草原)夏季NDVI的增加是夏季温度和春季降水共同作用的结果。温度通过生物地球化学反馈影响养分有效性,进而影响植被生长(Zhou et al., 2003);降水通过影响土壤水分有效性,进而影响植被生长(Jobbagy et al., 2002)。一方面,夏季温度增加导致土壤温度增加,进而加速了土壤有机质分解和营养元素释放,从而提高了土壤养分有效性;另一方面,春季降水的增加提高了土壤水分有效性。无疑,较高的土壤养分有效性和水分有效性将加速植被生长。特殊的是,温性草原夏季NDVI变化与气候因子并没有表现出显著的相关关系。
植被对气候变化的响应往往表现出一定的滞后效应(Braswell et al., 1997; Piao et al., 2003; Wang et al., 2003)。Braswell 等(1997)在全球尺度上的研究显示,NDVI与温度之间存在滞后。Piao等 (2003)在生物群区尺度上发现,中国植被对温度升高的响应存在滞后。另外,Wang 等(2003)在美国中部大平原NDVI与气候之间关系研究中发现,NDVI与降水之间存在滞后。我们的研究同样支持植被对气候变化的响应存在滞后效应的结论。高寒草地(高寒草甸、高寒草原)植被夏季NDVI与春季降水显著正相关,表明两者之间存在滞后效应。植被对气候的长期适应和水分循环、生物地球化学循环的限制均有可能减缓植被对气候变化的响应(Potter & Brooks, 1998)。并且,植被对气候变化响应的滞后时间与生物地球化学循环的调解时间一致(Braswell et al., 1997)。青藏高原的低温环境使得土壤有机氮和有机磷的矿化速率慢,因此缺乏能为植被吸收利用的速效氮和有机磷(周兴民,2001),尤其是在春季,植被生长受到N、P的限制。这可能导致了夏季植被生长对春季降水的滞后效应。对于高寒草地植被而言,微生物调解N、P循环后,降水才能促进植被生长。
气候变化会改变陆地生态系统的结构(Zavaleta et al., 2003a),同时会影响陆地生态系统的功能(Cao et al., 2001)。Ni (2000)利用BIOME3模拟了在未来气候、CO2浓度变化后青藏高原不同植被类型分布以及生产力的变化情况。结果显示,荒漠面积大幅度减少、植被带向西北方向推移,11种植被的净第一性生产力都显著增加。我们的结果表明18年来青藏高原草地植被活动在增强,并且植被活动的变化与气候变化(尤其是温度上升)密切相关。可见,过去20年的气候变化以及未来的气候变化都有利于草地植被生长。除气候因素之外,CO2施肥效应(Dijkstra et al., 2002) 、大气N沉降(Magill et al., 2004)等都会影响植被生长。但本文仅考虑了气候变化对草地植被覆盖的影响,没有涉及CO2施肥效应、大气N沉降等方面。如果将来能够综合考虑气候变化、CO2施肥效应、大气N沉降等因素,将有助于更好地理解全球变化对青藏高原草地生态系统的影响。
参考文献
The response of global terrestrial ecosystems to interannual temperature variability
Dynamic responses of African ecosystem carbon cycling to climate change
Mapping the land-surface for global atmosphere-biosphere models, toward continuous distributions of vegetations functional properties
Elevated atmospheric CO 2 stimulates aboveground biomass in a fire-regenerated scrub-oak ecosystem
Trends in North American net primary productivity derived from satellite observations,1982-1998
Characteristics of maximum-value composite images for temporal AVHRR data
Detecting and predicting spatial and interannual patterns of temperate forest springtime phenology in the eastern US
Patterns and controls of primary production in the Patagonian steppe: a remote sensing approach
Increased activity of northern vegetation inferred from atmospheric CO 2 measurements
Sensitivity analysis of variation in NDVI, temperature and precipitation in typical vegetation types across China
Interannual variability of vegetation in the United States and its relation to EI Nino/Southern Oscillation
Ecosystem response to 15 years of chronic nitrogen additions at the Harvard Forest LTER, Massachusetts, USA
A large carbon sink in the woody biomass of Northern forests
Increased plant growth in the northern high latitudes from 1981 to 1991
Permafrost changes in the northern limit of permafrost on the Qinghai-Tibet Plateau in the last 30 years
A simulation of biomes on the Tibetan Plateau and their responses to global climate change
Interannual variations of monthly and seasonal normalized difference vegetation index (NDVI) in China from 1982 to 1999
Variation in a satellite-based vegetation index in relation to climate in China
Global analysis of empirical relations between annual climate and seasonality of NDVI
Global analysis of the relationships among a vegetation index, precipitation and land-surface temperature
An analysis on the Qinghai-Xizang Plateau as "a disturbing source region" for climatic changes
In: China Society of the Qinghai-Xizang Plateau Research(中国青藏高原研究会) ed.
Higher northern latitude NDVI and growing season trends from 1982 to 1999
Spatial patterns of NDVI in response to precipitation and temperature in the central Great Plains
Temporal responses of NDVI to precipitation and temperature in the central Great Plains, USA
Assessing the response of terrestrial ecosystems to potential changes in precipitation
The range of climatic change on the Tibetan Plateau
Additive effects of simulated climate changes, elevated CO 2, and nitrogen deposition on grassland diversity
Grassland responses to three years of elevated temperature, CO 2, precipitation, and N deposition
Model expectation of impacts of global climate change on biomes of the Tibetan Plateau
In: Omasa K, Kai K, Taoda H, Uchijima Z, Yoshino M eds.
Variations in northern vegetation activity inferred from satellite data of vegetation index during 1981 to 1999
Relation between interannual variations in satellite measures of northern forest greenness and climate between 1982 and 1999

The Mars Environmental Compatibility Assessment (MECA) instrument was designed, built, and flight qualified for the now canceled MSP (Mars Surveyor Program) '01 Lander. The MECA package consisted of a microscope, electrometer, material patch plates, and a wet chemistry laboratory (WCL). The primary goal of MECA was to analyze the Martian soil (regolith) for possible hazards to future astronauts and to provide a better understanding of Martian regolith geochemistry. The purpose of the WCL was to analyze for a range of soluble ionic chemical species and electrochemical parameters. The heart of the WCL was a sensor array of electrochemically based ion-selective electrodes (ISE). After 20 months storage at -23 degrees C and subsequent extended freeze/thawing cycles, WCL sensors were evaluated to determine both their physical durability and analytical responses. A fractional factorial calibration of the sensors was used to obtain slope, intercept, and all necessary selectivity coefficients simultaneously for selected ISEs. This calibration was used to model five cation and three anion sensors. These data were subsequently used to determine concentrations of several ions in two soil leachate simulants (based on terrestrial seawater and hypothesized Mars brine) and four actual soil samples. The WCL results were compared to simulant and soil samples using ion chromatography and inductively coupled plasma optical emission spectroscopy. The results showed that flight qualification and prolonged low-temperature storage conditions had minimal effects on the sensors. In addition, the analytical optimization method provided quantitative and qualitative data that could be used to accurately identify the chemical composition of the simulants and soils. The WCL has the ability to provide data that can be used to
