


弱光条件下的光合作用效率是描述光合机构功能和运转状态的基本指标, 是光合机理研究的重要内容, 也是揭示光合作用调节规律的有力工具(陈根云等, 2006)。光响应曲线的确定, 对了解光反应过程的效率非常重要(Robert et al., 1984)。 测定植物叶片在弱光下的光合作用可计算它的表观量子效率, 有助于确定光合机构是否正常运转; 测定光合作用光饱和点的范围可了解植物在饱和光下的光合作用能力(曾小美等, 2002)。在光合作用过程中, 光和空气中的CO2浓度是光合作用的主导因子, 对每种绿色植物均可测量其光合作用对光的响应曲线。通过光响应曲线, 即可确定植物的最大净光合速率、光饱和点和光补偿点等光合参数。
虽然现在存在许多静态植物光响应模型(Webb et al., 1974; Jassby & Platt, 1976; Thornley, 1976; Marshall & Biscoe, 1980; Prado & Moraes, 1997)和动态光响应模型(Farquhar et al., 1980; Falkowski & Wirick, 1981; Fasham & Platt, 1983; Megard et al., 1984; Eilers & Peeters, 1988; Hand et al., 1993; Zonneveld, 1998; Rubio et al., 2003), 但还是以直角双曲线模型和非直角双曲线模型的应用最为广泛。然而, 在实际应用过程中发现, 用这些模型拟合光响应数据时, 所给出的最大净光合速率远大于实测值(Evans et al., 1993; Kyei- Boahen et al., 2003; Yu et al., 2004; Leakey et al., 2006), 而所给出的光饱和点远小于实测值(高峻等, 2006), 且无法拟合植物在光饱和点以后光合速率随光强的增加而降低的响应数据(Evans et al.,1993; Yu et al., 2004)。此外, 由于这些模型是一条渐进曲线, 不存在极点, 所以, 无法由这些模型直接给出植物的光饱和点和最大净光合速率的解析解, 必须用其它方法(Walker, 1989; Richardson & Berlyn, 2002)求得植物的光饱和点。而C3植物光响应新模型(Ye, 2007)能克服这个缺点, 可以拟合华北平原冬小麦(Triticum aestivum)在不同环境条件下的光响应数据。
1 试验地概况及测量方法
大田试验在中国科学院禹城综合试验站进行(36˚57′ N, 116˚36′ E, 平均海拔28 m)。该试验站地处黄河下游冲积平原, 地势低平。土壤母质为黄河冲积物, 土壤质地以粉砂和轻壤为主。属于大陆性暖温带季风气候。年平均气温为13.1℃, 1月平均气温为-3℃, 7月平均气温为26.91℃。年无霜期200 d。年均降水量为610 mm, 其中, 3~5月平均降水量为75.7 mm, 占年均降水量的12.4%; 6~8月平均降水量为419.7 mm, 占年均降水量的68.8%。
测量时间是从2003年4月23日到5月6日, 用美国Li-Cor公司生产的Li-6400便携式光合作用测定仪测定冬小麦品种‘科禹13’抽穗期的旗叶。测定环境条件: 叶面积指数为4.1, 日平均气温为10~22℃, 相对湿度为57%~90%。气温分别设置为20℃和25℃, 气室CO2浓度为360 mol·mol-1。采用Li-6400-02B人工光源提供0~2 000 μmol·m -2·s-1的不同光强, 每个光强下适应3~5 min后测定, 重复3次。详细的实验环境条件、实验设计、测量方法和测量步骤见文献(Yu et al., 2004)。
2 结果与分析
2.1 光合作用光响应曲线的拟合
图1
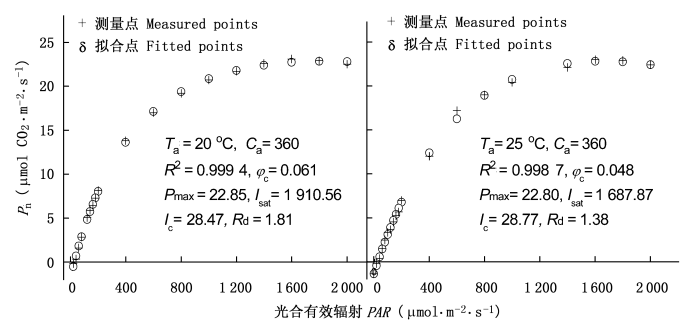
图1
不同气温条件下冬小麦的光响应曲线
Pn: 净光合速率 Net photosynthetic rate PAR: Photosynthetically active radiation Ta: 气温 Air temperature Ca: 气室的CO2浓度 Chamber CO2 concentration φ c: 在光补偿点的量子效率 Quantum yield at light compensation point Pmax: 最大净光合速率 Maximum net photosynthetic rate Isat: 光饱和点 Light saturation point Ic: 光补偿点 Light compensation point Rd: 暗呼吸速率 Dark respiration rate R2: 决定系数 Determination coefficient
Fig. 1
Light response curve of winter wheat (Triticum aestivum) under different temperatures
表1给出了用非直角双曲线模型、直角双曲线模型、P-M模型和C3植物光响应新模型拟合冬小麦在温度为20℃、CO2浓度为360 μmol·mol -1条件下的实测数据与拟合结果比较。从表1可知, 由非直角双曲线模型拟合温度为20℃、CO2浓度为360 μmol·mol -1时的实测数据所得到的冬小麦的Pmax为51.56 μmol CO 2·m-2·s-1, 远大于实测值(约为23 μmol CO 2·m-2·s-1); 由直角双曲线模型拟合同样的实测数据所得到的冬小麦的Pmax为31.27 μmol CO 2·m-2·s-1, 也大于实测值; 由P-M模型拟合同样的实测数据所得到的冬小麦的Pmax为24.32 μmol CO 2·m-2·s-1, 与实测结果相近, 但所给出的Ic为5.52 μmol·m -2·s-1, 远小于实测值(约29 μmol·m -2·s-1)。此外, 用Walker (1989)、Richardson和Berlyn (2002)提出的求植物光饱和点的方法并结合非直角双曲线模型、直角双曲线模型, 得到在该试验条件下冬小麦的Isat分别约为1 220 μmol·m -2·s-1和750 μmol·m -2·s-1, 由P-M模型估算的Isat为1 243.08 μmol·m -2·s-1, 这些估算值远小于实测值(约1 900 μmol·m -2·s-1)。而由C3植物光响应新模型得到该条件下冬小麦的Pmax为22.8 μmol CO 2·m-2·s-1, 与实测数据非常接近, 且C3植物光响应新模型可以直接计算出该试验条件下冬小麦的Isat为1 910.56 μmol·m -2·s-1, 与实测数据也非常接近。此外, 由C3植物光响应新模型拟合所给出的Ic和Rd与实测数据几乎完全相同(表1)。
表1 4个光响应模型拟合冬小麦在20℃和360 μmol·mol-1 CO2时光响应数据所得结果与实测数据的比较
Table 1
| 光合参数 Photosynthetic parameters | 非直角双曲线模型 Nonrectangular hyperbola model | 直角双曲线模型 Rectangular hyperbola model | P-M模型 Prado-Moraes model | C3植物光响应模型 New photosynthetic model for C3 species | 测量值 Measured data |
|---|---|---|---|---|---|
| 最大净光合速率 Maximum net photosynthetic rate (Pmax, μmol CO 2·m-2·s-1) | 51.56 | 31.27 | 24.32 | 22.85 | ≈23 |
| 初始斜率 Initial slope (α) | 0.103 | 0.084 | 0.060 | 0.067 | - |
| 光补偿点 Light compensation point (Ic, μmol·m -2·s-1) | 11.81 | 30.60 | 5.52 | 28.47 | ≈29 |
| 光饱和点 Light saturation point (Isat, μmol·m -2·s-1) | ≈1 220 | ≈750 | 1 243.08 | 1 910.56 | ≈1 900 |
| 暗呼吸速率 Dark respiration rate (Rd, μmol CO 2·m-2·s-1) | -1.21 | -2.57 | -1.243 | -1.81 | -1.8 |
| 决定系数 Determination coefficient (R2) | - | 0.997 0 | 0.999 1 | 0.999 4 | - |
2.2 低光强时冬小麦的光响应
P(I)=0.049I--1.375
图2
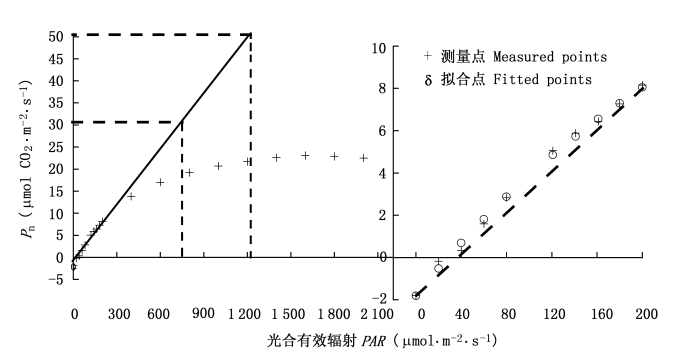
图2
冬小麦的光响应曲线(左)和在低光强时的光合响应曲线(右)
Pn、PAR: 见
Fig. 2
Light-response curve of photosynthesis (left) and photosynthetic response to irradiance at lower levels of light intensity (right) for winter wheat
表2 不同拟合有效光合辐射区间的表观量子效率、光补偿点和暗呼吸速率
Table 2
| 光合有效辐射 Photosynthetically active radiation (PAR, μmol·m -2·s-1) | ≤200 μmol·m-2·s-1 | ≤180 μmol·m-2·s-1 | ≤160 μmol·m-2·s-1 | ≤140 μmol·m-2·s-1 | ≤120 μmol·m-2·s-1 |
|---|---|---|---|---|---|
| 表观量子效率 Apparent quantum yield (AQY) | 0.049 | 0.050 | 0.052 | 0.054 | 0.055 |
| 光补偿点 Light compensation point ( Ic, μmol·m -2·s-1) | 28.16 | 28.80 | 29.23 | 30.00 | 30.18 |
| 暗呼吸速率 Dark respiration rate (Rd, μmol·m -2·s-1) | -1.38 | -1.44 | -1.52 | -1.62 | -1.66 |
3 结论与讨论
非直角双曲线模型(Thornley, 1976)、直角双曲线模型(Thornley, 1976)和P-M模型(Prado & Moraes, 1997)是一条渐近线, 不存在极值。所以我们无法用这3个模型直接估算出冬小麦的Pmax和Isat, 即无法从这3个模型直接求出冬小麦的Pmax和Isat的解析解。对于直角双曲线模型和非直角直角双曲线模型而言, 要想得到植物的Isat就必须结合其它方法(Walker, 1989; Richardson & Berlyn, 2002)。如图2所示的那样, 即先假定光合有效辐射在0~200 μmol·m -2·s-1时P(I)观察值为一条直线, 它与X轴(光合有效辐射) 的交点就是Ic, 该直线与Y=Pmax直线相交, 交点所对应于X轴的数值即为Isat。但用这种方法给出的Isat明显小于实测值(表1), 这种现象在其它植物的拟合过程中也存在(Kyei-Boahen et al., 2003; Yu et al., 2004; 高峻等, 2006)。而用P-M模型求Isat是按P(I)为Pmax的90%时的光合有效辐射这个假定得到的(Prado & Moraes, 1997)。显然, 由P-M模型得到植物的Isat在很大程度上受到人为影响, 并不客观, 且拟合得到的Isat远小于实测值(表1)。另外, 由于非直角双曲线模型、直角双曲线模型和P-M模型不存在极值, 所以我们无法用这3个模型拟合植物在光抑制条件下的光响应数据(Evans et al.,1993; Yu et al., 2004; Leakey et al., 2006), 且所给出冬小麦的Pmax远大于实测值(表1)。这种现象在其它植物的拟合过程中也存在(Evans et al., 1993; Kyei-Boahen et al., 2003; Yu et al., 2004; Leakey et al., 2006; 高峻等, 2006)。而由P-M模型拟合同样的光响应数据, 得到的Isat远小于实测值, 且Ic为实测值的1/6(表1)。对C3植物光响应新模型而言, 由于它的一阶导数可以等于0, 即该模型的数学函数存在极值, 因此, 我们可以用此模型拟合植物叶片在不同光强条件下, 包括光抑制条件下的光响应数据(Ye, 2007)。从图1可以看出, 两种温度条件下冬小麦的拟合结果与实测结果符合程度非常显著, 决定系数分别为R2=0.999 4和R2=0.998 7, 且拟合的结果与实测数据非常接近。
低光强下净光合速率对光强的响应曲线是评价植物光合特性的强有力工具(Olsson & Leverenz, 1994), 用表观量子效率来表示, 它反映植物对光能的利用效率。但由表2的数据可知, 如果拟合的光合有效辐射范围不同, 所得到的表观量子效率是不同的, 因此, 通过拟合低光强条件下(≤200 μmol·m-2·s-1)植物叶片净光合速率与光强之间的关系所得到的表观量子效率的值具有一定的人为性。由此可知, 表观量子效率并非描述植物利用光能的一个理想指标。为了解决这个问题, 我们建议用植物在光补偿点处的量子效率作为表征植物利用光能的一个指标, 它表示植物叶片把光能转化为净能量的能力(叶子飘, 2007), 这样就可避免上述问题的出现。因为在确定的试验条件下, 植物的光补偿点只有一个, 所以该植物在光补偿点处的量子效率也只有一个, 因而具有唯一性。此外, 由图2(右)可知, 在温度为20℃、CO2浓度为360 μmol·mol -1条件下华北平原冬小麦在低光强时的光合速率对光强的响应是非线性的。所以我们认为, 在低光强条件下植物叶片的净光合速率对光强的线性响应是一种近似。
由图1可知, 温度不同而CO2浓度相同的条件下, 冬小麦的Pmax和Ic几乎相同, 但在20℃条件下冬小麦的φc、Rd和Isat要大于25℃时的冬小麦。20 ℃时冬小麦的光能利用效率要高于25℃时, 这是因为20℃时冬小麦的φc比在25℃时大, 20℃时的Isat要比25℃时的大, 即25℃条件下的冬小麦要先于20℃时的冬小麦达到光饱和, 这表明在该试验条件下25℃时冬小麦的光合酶活性比20℃时的大。因此, C3植物光响应新模型可以为单一变量条件下植物光合作用特性的比较提供一个有效的理论工具。
总之, 利用植物叶片的光响应测量数据, 由C3植物光响应新模型就可以直接准确地拟合出植物叶片的主要光合参数, 并且拟合结果与实测数据的符合程度高。因此, 利用C3植物光响应新模型的特性可以讨论不同试验条件下植物的光合参数以及影响这些光合参数的环境因素和可能的生理生态学意义, 可为作物育种、植物生理生态学研究提供合理而有效的参数。
参考文献
Exploring the observation methods of photosynthetic responses to light and carbon dioxide
A model for the relationship between light intensity and the rate of photosynthesis in phytoplankton
Photosynthetic light-response curves. 2. Gradients of light absorption and photosynthetic capacity
A simulation model of the effects of vertical mixing on primary productivity
A biochemical model of photosynthetic CO 2 assimilation in leaves of C 3 species

Various aspects of the biochemistry of photosynthetic carbon assimilation in C3 plants are integrated into a form compatible with studies of gas exchange in leaves. These aspects include the kinetic properties of ribulose bisphosphate carboxylase-oxygenase; the requirements of the photosynthetic carbon reduction and photorespiratory carbon oxidation cycles for reduced pyridine nucleotides; the dependence of electron transport on photon flux and the presence of a temperature dependent upper limit to electron transport. The measurements of gas exchange with which the model outputs may be compared include those of the temperature and partial pressure of CO2(p(CO2)) dependencies of quantum yield, the variation of compensation point with temperature and partial pressure of O2(p(O2)), the dependence of net CO2 assimilation rate on p(CO2) and irradiance, and the influence of p(CO2) and irradiance on the temperature dependence of assimilation rate.
Photosynthesis response of phytoplankton to light: a physiological model
Photosynthesis and transpiration of Salvia miltiorrhiza in tree-herb system of Prunus dulcis and Salvia miltiorrhiza
Mathematical formulation of the relationship between photosynthesis and light for phytoplankton
Effects of light and CO 2 on net photosynthetic rates of stands of aubergine and Amaranthus
Photosynthetic response of carrots to varying irradiances
Photosynthesis, productivity, and yield of maize are not affected by open-air elevation of CO 2 concentration in the absence of drought
While increasing temperatures and altered soil moisture arising from climate change in the next 50 years are projected to decrease yield of food crops, elevated CO2 concentration ([CO2]) is predicted to enhance yield and offset these detrimental factors. However, C4 photosynthesis is usually saturated at current [CO2] and theoretically should not be stimulated under elevated [CO2]. Nevertheless, some controlled environment studies have reported direct stimulation of C4 photosynthesis and productivity, as well as physiological acclimation, under elevated [CO2]. To test if these effects occur in the open air and within the Corn Belt, maize (Zea mays) was grown in ambient [CO2] (376 micromol mol(-1)) and elevated [CO2] (550 micromol mol(-1)) using Free-Air Concentration Enrichment technology. The 2004 season had ideal growing conditions in which the crop did not experience water stress. In the absence of water stress, growth at elevated [CO2] did not stimulate photosynthesis, biomass, or yield. Nor was there any CO2 effect on the activity of key photosynthetic enzymes, or metabolic markers of carbon and nitrogen status. Stomatal conductance was lower (-34%) and soil moisture was higher (up to 31%), consistent with reduced crop water use. The results provide unique field evidence that photosynthesis and production of maize may be unaffected by rising [CO2] in the absence of drought. This suggests that rising [CO2] may not provide the full dividend to North American maize production anticipated in projections of future global food supply.
A model for C 3 leaves describing the dependence of net photosynthesis on irradiance
Kinetics of oxygenic photosynthesis in planktonic algae
Non-uniform stomata closure and the apparent convexity of the photosynthetic photon flux density response curve
Photosynthetic capacity and specific leaf mass in twenty woody species of Cerrado vegetation under field condition
Changes in foliar spectral reflectance and chlorophyll fluorescence of four temperate species following branch cutting
Spectral reflectance and chlorophyll fluorescence are rapid non-invasive methods that can be used to quantify plant stress. Because variation in ambient light (e.g., diurnal patterns of solar radiation) may have a confounding effect on these measurements, branches are often excised in the field and then measured under controlled conditions in the laboratory. We studied four temperate tree species (Abies balsamea (L.) Mill. (balsam fir), Betula papyrifera var. cordifolia (Regel) Fern. (paper birch), Picea rubens Sarg. (red spruce) and Sorbus americana Marsh. (mountain-ash)) to determine how quickly reflectance and fluorescence change following branch cutting. We hypothesized that conifer species, which have tough xeromorphic foliage, would exhibit changes more slowly than broadleaf species. Furthermore, we hypothesized that keeping broadleaf samples cool and moist would delay the onset of reflectance and fluorescence changes. In one set of experiments, we did not use any treatments to maintain the freshness of cut branches. During the first 12 h following cutting, changes in reflectance and fluorescence were slight for all species. Two or 3 days after branch cutting, the two conifers still showed only small changes in the ratio of variable to maximum fluorescence (Fv/Fm) and most reflectance indices, whereas paper birch and mountain-ash showed larger and more rapid declines in Fv/Fm and most reflectance indices. We attribute these declines to loss of water. As a consequence of xeromorphic leaf structure, the conifers were better able to minimize water loss than the two broadleaf species. In another experiment, paper birch that had been kept cool and moist after cutting showed only slight changes in fluorescence and reflectance, even after 3 days, indicating that with careful handling the time interval between collection and measurement of reflectance and fluorescence of many broadleaf specimens can be extended to several days. We conclude that measurements of reflectance and fluorescence need not be made in situ to be accurate and reliable.
Kok effect and the quantum yield of photosynthesis
A mechanistic model of photosynthesis in microalgae
A dynamic model of photosynthesis is developed, accounting for factors such as photoadaptation, photoinhibition, and the
Mathematical Models in Plant Physiology
Automated measurement of leaf photosynthetic O 2 evolution as a function of photon flux density
Carbon dioxide exchange of Alnus rubra: a mathematical model
Application of light-response model in estimating the photosynthesis of super-hybrid rice combinationⅡ—Youming 86
A new model for relationship between light intensity and the rate of photosynthesis in Oryza sativa
Photosynthetica,
Simulation of the stomatal conductance of winter wheat in response to light, temperature and CO 2 changes
BACKGROUND AND AIMS: The stomata are a key channel of the water cycle in ecosystems, and are constrained by both physiological and environmental elements. The aim of this study was to parameterize stomatal conductance by extending a previous empirical model and a revised Ball-Berry model. METHODS: Light and CO(2) responses of stomatal conductance and photosynthesis of winter wheat in the North China Plain were investigated under ambient and free-air CO(2) enrichment conditions. The photosynthetic photon flux density and CO(2) concentration ranged from 0 to 2000 micro mol m(-2) s(-1) and from 0 to 1400 micro mol mol(-1), respectively. The model was validated with data from a light, temperature and CO(2) response experiment. RESULTS: By using previously published hyperbolic equations of photosynthetic responses to light and CO(2), the number of parameters in the model was reduced. These response curves were observed diurnally with large variations of temperature and vapour pressure deficit. The model interpreted stomatal response under wide variations in environmental factors. CONCLUSIONS: Most of the model parameters, such as initial photon efficiency and maximum photosynthetic rate (P(max)), have physiological meanings. The model can be expanded to include influences of other physiological elements, such as leaf ageing and nutrient conditions, especially leaf nitrogen content.
Response of photosynthesis to light intensity in intact and detached leaves of Arabidopsis thaliana
Photoinhibition as affected by photoacclimation in phytoplankton: a model approach
