


森林动态监测研究可追溯到20世纪80年代, Stephen Hubble首先在巴拿马Barro Colorado岛(BCI)建立了50 hm2森林动态监测样地(Condit, 1995)。随后的20余年间, 美国Smithsonian热带研究所的热带森林科学研究中心(Center for Tropical Forest Science)在拉丁美洲、非洲、亚洲和大洋洲建立了21个热带监测样地, 在北美洲建立两个温带监测样地, 构成热带及温带森林动态样地监测网络。至此, 采用大面积固定样地进行长期动态监测已经成为森林生态学研究中的一种重要方法和手段。2004年, 在中国科学院森林生物多样性委员会的组织协调下, 多家科研单位分别在温带(郝占庆等, 2008)、中亚热带(祝燕等, 2008)、南亚热带(叶万辉等, 2008)和热带地区森林(兰国玉等, 2008)建立了20~25 hm2固定监测样地, 形成了中国森林生物多样性监测网络。中国森林生物多样性监测网络的建立, 使得在大尺度上比较研究不同气候区森林群落结构及动态变化规律成为可能。
长白山覆盖着大面积未受干扰的温带原始森林, 原始阔叶红松林作为长白山西部地区的地带性顶级植被类型, 其林龄超过200 a, 是我国过去几十年间的重要木材产地之一。但20世纪初, 大规模工业采伐使原始阔叶红松林遭到了严重破坏, 大面积森林逐渐为次生林或人工林所代替(Chen et al., 1994)。为了比较研究北温带森林不同演替阶段的结构特征及发展动态, 我们在长白山地区选取典型次生杨桦林、次生针阔混交林及椴树红松林, 分别建立5.2 hm2固定监测样地, 为研究温带森林群落动态演替过程提供了理论基础和数据支持。
1 材料和方法
1.1 研究区概况
研究地位于吉林省白河林业局光明林场(次生杨桦林、次生针阔混交林样地)和长白山北坡自然保护区(椴树红松林样地)。该区域属于受季风影响的温带大陆性山地气候, 年均气温3.6 ℃, 最热月7月平均气温19.6 ℃, 最冷月1月平均气温-15.4 ℃, 极端最高气温32.3 ℃, 极端最低气温-37.6 ℃。年均降水量707 mm。土壤类型为山地暗棕色森林土, 土层厚20~100 cm。
1.2 样地设置及分析方法
参照CTFS (Center for Tropical Forest Science)样地建设标准(Center for Tropical Forest Science, 2005), 于2005~2007年, 选择典型次生杨桦林、次生针阔混交林和椴树红松林建立了15.6 hm2永久监测样地, 3块样地构成了一个由次生林分逐渐向顶级植被类型过渡的典型演替系列。监测样地概况如表1所示。每个样地面积均为5.2 hm2, 长260 m, 宽200 m, 将其划分为130个20 m×20 m的连续样方。为便于测量每个个体的相对位置, 将每个20 m×20 m样方进一步划分成16个5 m×5 m的亚样方, 记录样地内所有胸径DBH≥1 cm的全部活个体种名、胸径、树高、冠幅(东西冠幅长、南北冠幅长)及枝下高, 并挂牌标记。测量植株到5 m×5 m亚样方4个顶点的距离, 并换算为其在整个样地内的相对坐标。于2006年8月晴天时, 用手持土壤水分测定仪(HH2 DelLa-T Devices Moisture Meter, 英国Delta-公司)测量每个20 m×20 m样方表层土壤湿度。在每个20 m×20 m样方内土壤表层(0~20 cm)取两个土壤样品,带回实验室进行分析。室内土壤样品分析方法依据《土壤农业化学分析方法》(中国土壤学会, 1999)的操作步骤进行, 测定土壤全氮、全磷、全钾、有机质含量和土壤pH值。计算两个重复样品的平均值作为每个样方的值。为了评价林分光照状况, 使用冠层分析仪(WinSCANOPYTM2003, 加拿大Regent Instrument公司)在每个样方中距离地面1 m处拍摄两张半球状照片, 用对应的WinSCANOPY和XLScanopy软件处理照片, 根据Bonhomme和Chartier (1972)的方法计算叶面积指数。同时计算每个样方内两次重复测量结果的平均值。
表1 长白山3块森林永久监测样地概况
Table 1
| 林型 Forest types | 样地代码 Codes | 经纬度 Longitude and latitude | 平均海拔 Average altitude (m) | 样地面积 Plot areas (hm2) | 原始植被 Primary vegetation |
|---|---|---|---|---|---|
| 次生杨桦林 Secondary Populus davidiana-Betula platyphylla forests | Plot 1 | 42º19.1667′ N 128º07.817′ E | 899 | 5.2 (260 m×200 m) | 阔叶红松林 Broad-leaved Pinus koraiensisforests |
| 次生针阔混交林 Secondary conifer and broad-leaved mixed forests | Plot 2 | 42º20.907′ N 128º07.988′ E | 748 | 5.2 (260 m×200 m) | 阔叶红松林 Broad-leaved Pinus koraiensisforests |
| 椴树红松林 Tilia amurensis-Pinus koraiensis mixed forests | Plot 3 | 42º13.684′ N 128º04.573′ E | 1 042 | 5.2 (260 m×200 m) | 阔叶红松林 Broad-leaved Pinus koraiensisforests |
在各种空间点格局分析方法中, Ripley’sK(r)近年来被大量应用于格局研究。对于强度为λ的同质点格局, 二元特征可以用函数K(r)来描述, 对于一个任意点周围半径为r的范围内邻体期望数为: N(r)=λK(r)。以Ripley’sK(r)为基础的L(r)也是一种较流行的空间点格局分析方法, 但这种方法仍存在缺陷。Ripley’sK(r)或L(r)分析以某个点为圆心, r为半径的圆内点的空间格局, 随着半径的增加, 格局量度结果包含了圆内的全部信息。因此Ripley’sK(r)或L(r)是累计量度函数, 在每个大尺度上的量度结果包括了全部小尺度上的信息(Condit et al., 2000; George et al., 2006)。双相关函数g(r)以Ripley’sK(r)或L(r)为基础(Ripley, 1981), 用圆环代替了Ripley’sK(r)或L(r)函数的圆, 计算某个个体周围以r为半径的一定宽度圆环内邻体的平均数, 从而区分出了特定距离级上的点格局(Wiegand & Moloney, 2004)。通常在r个等距离dr上计算空间点的强度, r=tdr (t=1,2,…tmax)。则圆tdr与(t-1)dr之间的面积为S(r)=π(tdr)2-π((t-1)dr)2。在这个环形面积内出现一个点的概率为P(r)=N(tdr)-N((t-1)dr)。因此, 双相关函数可表达为: g(r)=P(r)/λS(r)=[K(tdr)-K((t-1)dr)]/S(r)。为了评价空间点格局偏离完全随机分布的程度, 本文通过10 000次随机模拟计算95%置信区间, 当g(r)位于上包迹线以上时为聚集分布, 位于下包迹线以下时为均匀分布, 位于上下包迹线之间时为随机分布。
根据Legendre和Legendre (2006)的研究方法, 利用环境变量和空间变量对树木种群空间分布数据(定义为每个20 m×20 m样方中的株数)进行定量分离计算。本文由全氮、全磷、全钾、有机质、土壤pH值、土壤水分和叶面积指数7个环境因子构成环境矩阵X, 相邻矩阵主坐标(PCNM)作为空间矩阵W (Borcard & Legendre,2002)。使用环境变量和空间变量, 通过RDA方法来分割反应变量的空间变异。利用调整决定系数R2来估计不同解释部分的贡献率(Peres-Neto et al., 2006)。相邻矩阵主坐标利用PCNM.R函数计算(Dray et al., 2006)。利用R软件的“vegan”包进行定量分离计算。
本文通过对3块森林监测样地中木本植物的数量特征、径级结构及分布格局的研究, 试图揭示森林树木种群的演替动态规律。文中统计分析、制图采用国际通用软件R2.6.2进行。
2 结果和分析
2.1 森林样地树种组成演替动态
次生杨桦林样地中监测到32种木本植物, 隶属于13科21属。次生针阔混交林中监测到31种木本植物, 隶属于12科20属。椴树红松林中监测到20种木本植物, 隶属于11科13属。次生杨桦林、次生针阔混交林及椴树红松林中分别监测到木本植物20 949、14 725和12 062株, 总胸高断面积分别为24.74、32.07和56.64 m2·hm-2。次生杨桦林中重要值前10位的树种分别为: 紫椴(Tilia amurensis)、簇毛槭(Acer barbinerve)、山杨(Populus daviana)、色木槭(Acer mono)、白桦(Betula platyphylla)、水曲柳(Fraxinus mandshurica)、臭松(Abies nephrolepis)、蒙古栎(Quercus mongolica)、青楷槭(Acer tegmentosum)和鱼鳞松(Picea jezoensis)。胸高断面积最大的5个树种分别为: 白桦、紫椴、水曲柳、山杨和蒙古栎, 这5个树种胸高断面积之和占总断面积的60.7%。次生针阔混交林中重要值前10位的树种分别为: 紫椴、臭松、假色槭(Acer pseudo-sieboldianum)、色木槭、白桦、簇毛槭、红松(Pinus koraiensis)、蒙古栎、水曲柳和大青杨(Populus ussuriensis)。胸高断面积最大的5个树种分别为: 紫椴、白桦、大青杨、臭松及水曲柳, 这5个树种胸高断面积之和占总断面积的61.2%。椴树红松林中重要值前10位的树种分别为: 红松、簇毛槭、紫椴、臭松、假色槭、色木槭、大青杨、鱼鳞松、花楷槭(Acer ukurunduense)和青楷槭。胸高断面积最大的5个树种分别为: 红松、紫椴、大青杨、臭松和色木槭, 这5个树种胸高断面积之和占总断面积的95.4% (表2)。
表2 长白山3个森林监测样地内36种木本植物的多度、胸高断面积及重要值
Table 2
| 树种 Tree species | 次生杨桦林 Secondary Populus davidiana-Betula platyphylla forests | 次生针阔混交林 Secondary conifer and broadleaved mixed forests | 椴树红松林 Tilia amurensis-Pinus koraiensis mixed forests | ||||||||
|---|---|---|---|---|---|---|---|---|---|---|---|
| 多度 Abun- dance | 胸高断面积 Basal area (m2·hm-2) | 重要值Important value | 多度 Abun-dance | 胸高断面积Basal area (m2·hm-2) | 重要值Important value | 多度 Abun- dance | 胸高断面积 Basal area (m2·hm-2) | 重要值Important value | |||
| 红松 Pinus koraiensis | 439 | 0.99 | 3.79 | 709 | 2.06 | 6.35 | 911 | 28.55 | 24.62 | ||
| 紫椴 Tilia amurensis | 2 268 | 3.58 | 10.66 | 1 103 | 6.30 | 11.64 | 796 | 15.55 | 16.74 | ||
| 糠椴 Tilia mandshurica | 86 | 0.17 | 0.56 | 42 | 0.10 | 0.40 | 0 | 0 | 0 | ||
| 臭松 Abies nephrolepis | 1 071 | 1.34 | 5.21 | 2616 | 2.65 | 11.28 | 3 847 | 4.05 | 13.02 | ||
| 蒙古栎 Quercus mongolica | 727 | 1.49 | 4.98 | 237 | 2.41 | 5.06 | 1 | <0.01 | 0.05 | ||
| 鱼鳞松 Picea jezoensis | 508 | 1.46 | 4.73 | 192 | 0.83 | 2.40 | 214 | 0.44 | 3.71 | ||
| 水曲柳 Fraxinus mandshurica | 773 | 3.22 | 7.54 | 285 | 2.58 | 4.65 | 0 | 0 | 0 | ||
| 色木槭 Acer mono | 2 845 | 0.98 | 8.01 | 1 947 | 2.04 | 9.11 | 329 | 1.33 | 5.73 | ||
| 假色槭 Acer pseudo- sieboldianum | 778 | 0.13 | 3.01 | 3 048 | 1.51 | 11.07 | 962 | 0.75 | 7.98 | ||
| 青楷槭 Acer tegmentosum | 1 755 | 0.31 | 4.98 | 490 | 0.38 | 3.30 | 59 | 0.22 | 1.22 | ||
| 簇毛槭 Acer barbinerve | 4 585 | 0.27 | 9.73 | 1 852 | 0.25 | 6.45 | 4 681 | 0.65 | 18.71 | ||
| 花楷槭 Acer ukurunduense | 277 | 0.06 | 1.23 | 566 | 0.11 | 2.82 | 174 | 0.08 | 2.93 | ||
| 白牛槭 Acer mandshuricum | 84 | 0.01 | 0.62 | 0 | 0 | 0.00 | 0 | 0 | 0 | ||
| 春榆 Ulmus japonica | 754 | 1.03 | 4.41 | 167 | 0.17 | 1.77 | 0 | 0 | 0 | ||
| 怀槐 Maachia amurensis | 175 | 0.18 | 1.33 | 260 | 0.80 | 3.30 | 0 | 0 | 0 | ||
| 黄檗 Phellodendron amurense | 45 | 0.08 | 0.45 | 31 | 0.17 | 0.65 | 2 | 0.13 | 0.13 | ||
| 黄榆 Ulmus macrocarpa | 0 | 0 | 0 | 17 | 0.05 | 0.29 | 2 | <0.01 | 0.05 | ||
| 花楸 Sorbus pohuashanensis | 63 | 0.05 | 0.59 | 25 | 0.04 | 0.46 | 1 | <0.01 | 0.05 | ||
| 水榆 Sorbus alnifolia | 83 | 0.20 | 0.89 | 26 | 0.08 | 0.44 | 1 | <0.01 | 0.05 | ||
| 长白落叶松 Larix kaempferi | 10 | 0.05 | 0.22 | 34 | 0.19 | 0.63 | 1 | 0.05 | 0.08 | ||
| 裂叶榆 Ulmus laciniata | 128 | 0.10 | 1.11 | 33 | 0.03 | 0.47 | 3 | 0.01 | 0.10 | ||
| 山杨 Populus daviana | 1 777 | 3.03 | 8.90 | 143 | 0.95 | 1.93 | 3 | 0.20 | 0.25 | ||
| 大青杨 Populus ussuriensis | 64 | 0.57 | 1.18 | 45 | 2.86 | 4.31 | 71 | 4.52 | 4.42 | ||
| 香杨 Populus kareana | 0 | 0 | 0 | 55 | 0.18 | 0.41 | 0 | 0 | 0 | ||
| 朝鲜柳 Salix koreensis | 76 | 0.64 | 1.50 | 0 | 0 | 0.00 | 0 | 0 | 0 | ||
| 白桦 Betula platyphylla | 733 | 3.69 | 7.98 | 643 | 5.23 | 8.91 | 2 | 0.04 | 0.04 | ||
| 枫桦 Betula costata | 30 | 0.11 | 0.50 | 133 | 0.83 | 2.16 | 1 | 0.02 | 0.02 | ||
| 胡桃楸 Juglans mandshurica | 42 | 0.06 | 0.48 | 0 | 0 | 0 | 0 | 0 | 0 | ||
| 色赤杨 Alnus tinctoria | 233 | 0.76 | 2.12 | 0 | 0 | 0 | 0 | 0 | 0 | ||
| 大黄柳 Salix raddeana | 19 | <0.01 | 0.11 | 5 | <0.01 | 0.08 | 0 | 0 | 0 | ||
| 毛山楂 Crataegus maximowiczii | 0 | 0 | 0 | 6 | <0.01 | 0.11 | 0 | 0 | 0 | ||
| 山丁子 Malus baccata | 53 | 0.02 | 0.70 | 8 | <0.01 | 0.16 | 0 | 0 | 0 | ||
| 稠李 Prunus padus | 410 | 0.12 | 1.81 | 3 | <0.01 | 0.07 | 0 | 0 | 0 | ||
| 鼠李 Rhamnus davurica | 15 | 0.02 | 0.20 | 2 | <0.01 | 0.04 | 0 | 0 | 0 | ||
| 黑樱桃 Cerasus maximowiczii | 41 | 0.01 | 0.40 | 2 | <0.01 | 0.04 | 0 | 0 | 0 | ||
| 红豆杉 Taxus cuspidata | 0 | 0 | 0 | 0 | 0 | 0.00 | 1 | <0.01 | 0.05 | ||
| 合计 Total | 20 949 | 24.74 | 14 725 | 32.07 | 12 062 | 56.64 | |||||
2.2 种-面积关系及个体数-面积关系演替动态
表3 长白山3个森林监测样地内主要树种空间分布的环境和空间解释
Table 3
| 树种 Tree species | 样地1 Plot 1 | 样地2 Plot 2 | 样地3 Plot 3 | ||||||
|---|---|---|---|---|---|---|---|---|---|
| a | b | c | a | b | c | a | b | c | |
| 紫椴 Tilia amurensis | 8.89 | 46.64 | 9.04 | 1.72 | 26.90 | 6.85 | 0 | 51.53 | 0 |
| 鱼鳞松 Picea jezoensis | 1.63 | 45.36 | 0 | 27.45 | 68.10 | 29.98 | 0 | 62.71 | 0 |
| 色木槭 Acer mono | 6.36 | 40.84 | 5.72 | 4.60 | 56.80 | 4.76 | 1.33 | 14.89 | 0 |
| 红松 Pinus koraiensis | 3.09 | 66.04 | 4.26 | 5.35 | 38.35 | 4.99 | 1.34 | 44.29 | 0 |
| 臭松 Abies nephrolepis | 10.18 | 78.22 | 12.09 | 12.75 | 50.74 | 13.29 | 0 | 64.71 | 0 |
a: 环境变量解释部分(%) Variations explained by environmental variables (%) b: 空间变量解释部分(%) Variations explained by spatial variables (%) c: 环境变量和空间变量交互作用解释部分(%) Variations explained by interaction effect of spatiah and environmental variables (%)
图1
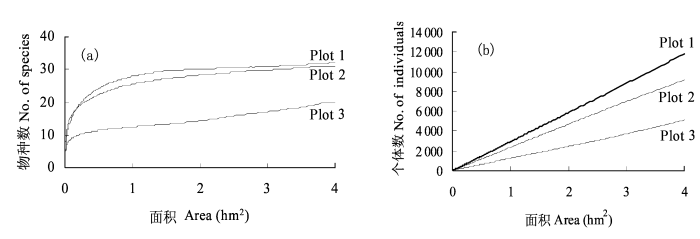
图1
长白山3个森林监测样地木本植物种-面积曲线(a)及个体数-面积曲线(b)
Fig. 1
Species-area curve (a) and individual-area (b) curve of woody plant in three forest plots in Changbai Mountains
2.3 树种径级结构演替动态
选择在3个森林监测样地中均出现的5个优势树种, 分析树木种群径级结构的演替动态(图2)。次生杨桦林、次生针阔混交林及椴树红松林中全部个体的径级结构呈倒J型分布, DBH<5 cm的个体分别占全部个体的70%、58.1%和60.9%, 说明林下更新较好。次生杨桦林中DBH>1 cm的活个体共计20 949株, 其中DBH<30 cm的个体为20 713株, 占全部个体的98.8%; 平均胸径为8 cm, 最大胸径为105 cm。次生针阔混交林中DBH>1 cm的活个体共计14725株, 其中DBH<30 cm的个体为14 449株, 占全部个体的98.1%; 平均胸径为11.7 cm, 最大胸径为91.2 cm。椴树红松林中DBH>1 cm的活个体共计12 062株, 其中DBH<30 cm的个体为10 784株, 占全部个体的89.4%; 平均胸径为24.9 cm, 最大胸径达147.7 cm。
图2
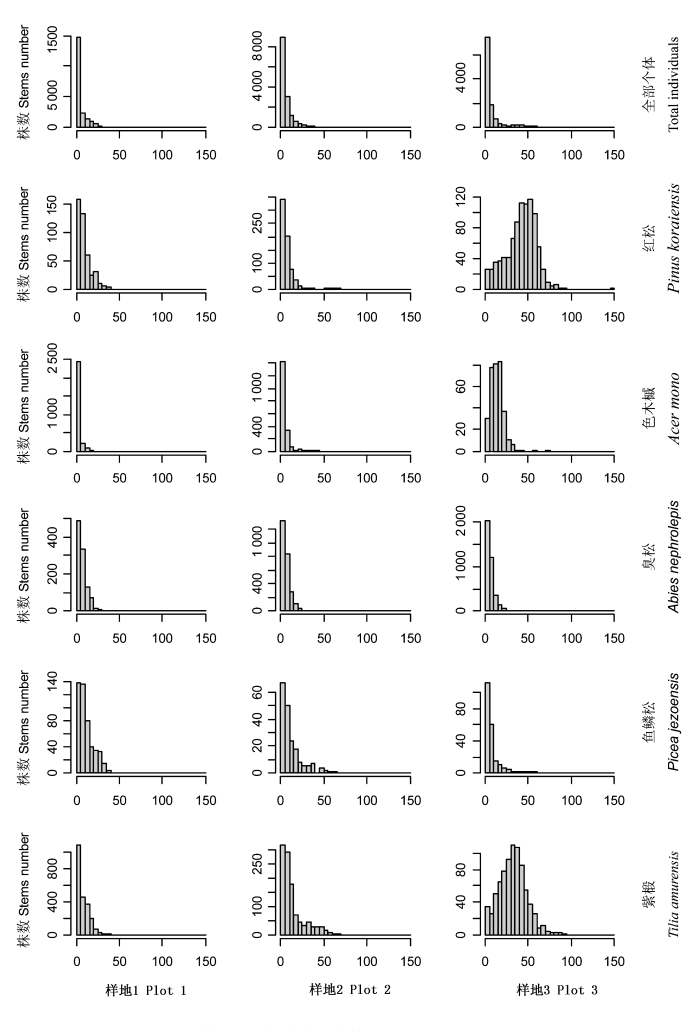
图2
长白山3个森林监测样地优势树种径级结构
Fig. 2
Size-class distribution of main tree species in three forest plots in Changbai Mountains
红松径级结构在次生杨桦林和次生针阔混交林中均呈倒J型分布, 个体径级结构主要分布在1~40 cm范围内, 分别占全部个体的99.7%和96.3%。红松在椴树红松林内呈单峰分布, 峰值主要出现在35~65 cm处, 占全部个体的63.8%。色木槭、臭松和鱼鳞松在次生杨桦林、次生针阔混交林及椴树红松林中均呈倒J型分布。次生杨桦林和次生针阔混交林中, 色木槭径级主要分布在1~10 cm; 在椴树红松林中则主要分布在1~25 cm径级。在次生杨桦林、次生针阔混交林及椴树红松林中, 臭松主要分布在DBH<25 cm径级内, 鱼鳞松则主要分布在DBH<50 cm径级内。紫椴径级结构在次生杨桦林及次生针阔混交林中呈倒J型分布, 在椴树红松林内呈单峰分布。因此, 由次生杨桦林经次生针阔混交林阶段向椴树红松林演替过程中, 紫椴径级分布向大径级偏移。
2.4 树种空间分布演替动态
利用g(r)分析5个优势树种在不同监测样地内的分布格局演替动态。g(r)量化了在每个宽度为1 m的环状范围内树种的空间分布状态, 避免了小尺度格局对大尺度的累计效应影响, 更准确地反映了树种的空间分布状况。结果表明: 次生杨桦林样地中, 红松、紫椴在中小尺度上(r<60 m)呈聚集分布; 而次生针阔混交林及椴树红松林样地中, 红松和紫椴在较小尺度上(r<40 m)呈聚集分布。次生杨桦林样地中, 臭松、色木槭及鱼鳞松在中小尺度上(r<60 m)呈聚集分布; 次生针阔混交林样地中, 臭松、色木槭及鱼鳞松在绝大多数研究尺度上呈聚集分布; 而椴树红松林样地中, 臭松、色木槭及鱼鳞松主要在较小尺度上聚集分布(图3)。因此, 长白山不同演替阶段森林样地中优势树种均以聚集性分布为主。
图3
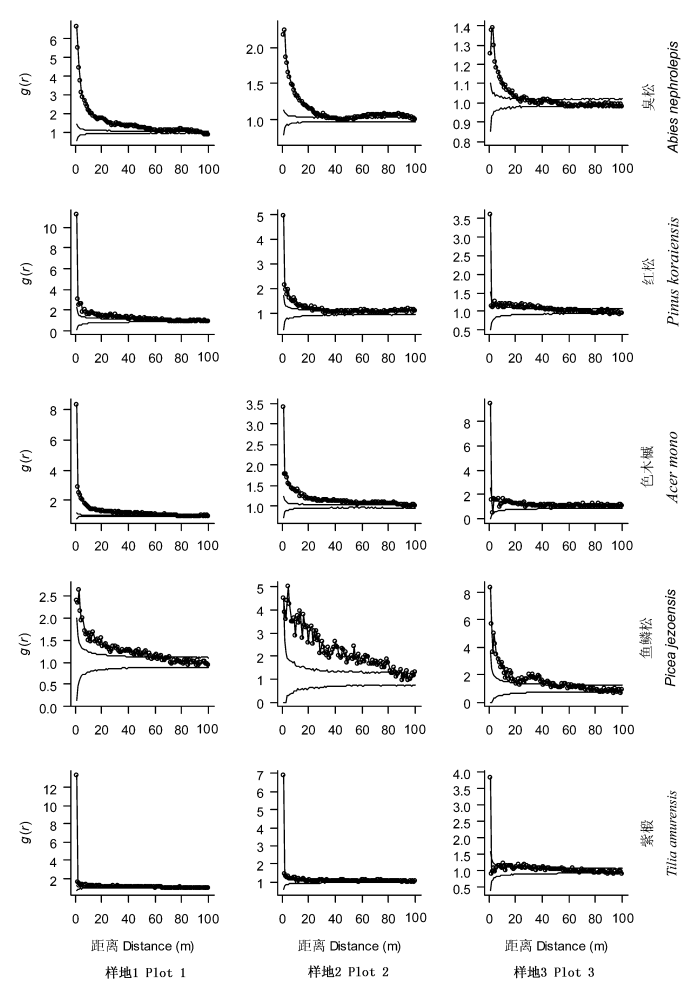
图3
长白山3个森林监测样地优势树种空间分布格局
Fig. 3
Spatial distributions of main tree species in three forest plots in Changbai Mountains
当种群表现为聚集分布时, 把偏离置信区间的最大值定义为聚集强度, 对应于聚集强度的尺度定义为聚集尺度(Rebertus et al., 1989)。在所有监测样地中, 红松、色木槭和紫椴均在r=0时出现最大聚集强度。而次生杨桦林样地内, 臭松在r=0时出现最大聚集强度, 次生针阔混交林和椴树红松林样地内, 臭松分别在r=1和3 m处达到最大聚集强度。在次生杨桦林、次生针阔混交林及椴树红松林样地中, 鱼鳞松分别在r=4、2和0 m处达到最大聚集强度(图3)。5个优势树种均在较小的聚集尺度上(r≤4 m)达到最大聚集强度, 说明5个优势树种个体均聚集在同种植株附近, 并且随着距离增加, 目标植物周围同种个体密度急剧下降。
2.5 树种空间分布的环境解释
环境变量和空间变量对5个优势树种种群空间分布的定量分离结果(表3)表明: 次生林中(次生杨桦林和次生针阔混交林), 环境变量对树种空间变异的解释量较高, 最高可达27.45%; 而椴树红松林中, 树种空间分布的环境解释量均极低。阔叶树种紫椴、色木槭种群空间分布的环境解释量随着群落演替(次生杨桦林→次生针阔混交林→椴树红松林)逐渐减小; 而针叶树种鱼鳞松、红松和臭松种群空间分布的环境解释量在次生针阔混交林中最大。3个森林样地中空间变量对树木种群空间变异的解释能力均较强, 空间解释量绝大多数在40%以上。环境因子与空间变量的耦合作用对次生林样地中树种的空间分布影响较大, 对椴树红松林中5个优势树种的空间分布则无影响。
3 讨论
郝占庆等(2008)对长白山25 hm2阔叶红松林的研究显示, 作为地带性顶级植物群落类型, 群落主要由针叶树种红松, 阔叶树种紫椴、蒙古栎、水曲柳、春榆、裂叶榆、大青杨、色木槭和拧劲槭等组成。从重要值及胸高断面积看, 色木槭、假色槭、紫椴、蒙古栎、红松和水曲柳共同在上层林冠占据优势地位。而椴树红松林是阔叶红松林的主要森林类型, 红松、紫椴在上层林冠中占据了绝对优势地位, 二者胸高断面积之和占到样地总胸高面积的78%。长白山25 hm2阔叶红松林样地内, DBH>1 cm个体的总胸高断面积为43.23 m2·hm-2。总胸高断面积值大于次生杨桦林(24.74 m2·hm-2)及次生针阔混交林(32.07 m2·hm-2), 但远低于椴树红松林(56.64 m2·hm-2)。因此, 椴树红松林处于上述几个林型的森林演替进程最末端。
处于不同演替阶段的森林群落在物种组成及种群结构上均存在较大差异。次生杨桦林及次生针阔混交林中蒙古栎、水曲柳、春榆、山杨、白桦的多度、胸高断面积及重要值较高, 在林分内占据重要地位, 影响着林分未来的发展方向。槭树类(如假色槭、青楷槭、簇毛槭和花楷槭等)的多度、重要值在椴树红松林内虽然仍然较高, 但由于这些树种主要分布于林冠下层, 胸高断面积值非常低, 故而对林分未来发展影响不大。木本植物物种数及总植株数在森林群落演替过程中显著下降。椴树红松林样地中所有木本植物的总植株数比次生杨桦林减少了42.4%, 而总胸高断面积增加了128.9%。这种变化可以通过树种径级分布很好地加以解释。由于次生林中林下幼苗、幼树丰富, 虽然植株密度较大, 但大径级植株比例却不高。而椴树红松林中树种小径级植株比例显著减少, 大径级植株比例增加, 故而林分总胸高断面积增大。在森林演替进程中, 山杨、白桦及蒙古栎等许多喜光树种被淘汰掉。剩余顶级树种的幼苗、幼树由于竞争或庇荫作用影响在林下密度也极低, 如椴树红松林中的主要树种红松、紫椴的径级分布均呈单峰型。因此, 未来椴树红松林的自我更新能否或如何才能继续得以维持、森林演替进程最终走向成为当前亟需关注的问题。
不同演替阶段的森林样地中优势树种在空间上主要表现为聚集性分布, 这与以往研究结果一致(张春雨等, 2008; Zhang et al., 2009)。木本植物空间分布是地形、环境因子(如光照、土壤和水分等)和繁殖过程(种子传播)等综合作用的结果。古田山24 hm2样地木本植物分布与生境显著相关分析表明, 106种木本植物中, 84种(79%)至少与一种生境显著相关; CCA (Canonical correspondence analysis)及随机化排列测验方法分析表明, 大部分物种的分布受地形生境因子限制(宫贵权等, 2007)。干旱季节, 高光照、高温、低土壤养分和低土壤湿度等微生境特征是树木幼苗、幼树建立和存活的重要限制性因子(Uhl et al., 1988; Nepstad, 1989; Gerhardt, 1993; Hooper et al., 2002), 对土壤湿度的敏感性是制约幼苗、幼树空间分布的重要机制(Engelbrecht et al., 2007)。张春雨等(2008)和Zhang等(2009)发现, 在长白山次生杨桦林及次生针阔混交林中, 环境因子对树种不同生长阶段个体空间分布影响不同, 环境因子主要作用于幼树和小树, 对大树的解释能力较差。本文研究结果显示, 树木种群空间格局的环境解释量受树木种类和森林群落所处演替阶段影响。次生林中环境因子与空间变量耦合作用对树种空间分布变异的解释能力较强, 说明树种与环境因子相互作用过程中形成了较好的适应关系, 树种分布格局对环境因子的空间结构形成了空间依赖性(Dray et al., 2006)。椴树红松林中树种空间分布对当前考虑的环境因子的响应较差, 但这并不代表环境因子对树种空间格局没有影响。由于椴树红松林中幼树较少, 树木种群主要由大径级植株构成, 因此树木空间格局受过去的环境状况和树种自身的生物学特性影响要更大一些。此外, 群落自身互作、人类采伐经营活动以及一些未涉及的环境因子、干扰事件或随机因子也影响着植物种群的空间格局(Borcard et al., 1992)。
4 结论
森林群落演替过程中木本植物种类减少, 林分株树密度下降, 胸高断面积显著增加。随着森林群落演替, 红松、紫椴和臭松种群在群落中的重要性增大; 蒙古栎、鱼鳞松、色木槭和水曲柳等树种在森林群落中的重要性减小; 一些槭类树种(如白牛槭)及下层树种(如山丁子、稠李、鼠李和黑樱桃等)则逐渐退出林分。
森林演替过程中色木槭、臭松和鱼鳞松的径级结构保持倒J型不变, 而红松、紫椴的径级结构则由倒J型变为单峰分布。因此, 未来优势树种红松、紫椴的林下更新值得关注。长白山不同演替阶段森林样地中5个主要树种均以聚集性分布为主, 并且在较小的聚集尺度(r≤4 m)上达到最大聚集强度。随着森林演替, 主要树种空间分布的环境解释量逐渐减小; 不同演替阶段, 主要树种种群结构变异的空间解释量均在40%以上。
参考文献
The interpretation and automatic measurement of hemispherical photographs to obtain sunlit folige area and gap frequency
Partialling out the spatial component of ecological variation
All-scale spatial analysis of ecological data by means of principal coordinates of neighbour matrices
Natural Secondary Forest: Structure, Function, Dynamic, and Management (天然次生林结构、功能动态与经营)
Soil Agricultural Chemical Analysis Procedure(土壤农业化学分析方法)
Methods for census of the 50 ha plot on Barro Colorado Island
http://www.ctfs.edu.
Research in large, long-term tropical forest plot
Spatial patterns in the distribution of tropical tree species

Fully mapped tree census plots of large area, 25 to 52 hectares, have now been completed at six different sites in tropical forests, including dry deciduous to wet evergreen forest on two continents. One of the main goals of these plots has been to evaluate spatial patterns in tropical tree populations. Here the degree of aggregation in the distribution of 1768 tree species is examined based on the average density of conspecific trees in circular neighborhoods around each tree. When all individuals larger than 1 centimeter in stem diameter were included, nearly every species was more aggregated than a random distribution. Considering only larger trees (>/= 10 centimeters in diameter), the pattern persisted, with most species being more aggregated than random. Rare species were more aggregated than common species. All six forests were very similar in all the particulars of these results.
Spatial modelling: a comprehensive framework for principal coordinate analysis of neighbour matrices (PCNM)
Drought sensitivity shapes species distribution patterns in tropical forests
A comparison of methods for the statistical analysis of spatial point patterns in plant ecology
Tree seedling development in tropical dry abandoned pasture and secondary forest in Costa Rica
Habitat associations of wood species in the Gutianshan subtropical broad-leaved evergreen forest
Broad-leaved Korean pine ( Pinus koraiensis) mixed forest plot in Changbaishan (CBS) of China: community composition and structure
Responses of 20 native tree species to reforestation strategies for abandoned farmland in Panama
Establishment of Xishuangbanna tropical forest dynamics plot: species compositions and spatial distribution patterns
Forest Regrowth in Abandoned Pastures of Eastern Amazonia: Limitations to Tree Seedling Survival and Growth
Variation partitioning of species data matrices: estimation and comparison of fractions
Establishing relationships between species distributions and environmental characteristics is a major goal in the search for forces driving species distributions. Canonical ordinations such as redundancy analysis and canonical correspondence analysis are invaluable tools for modeling communities through environmental predictors. They provide the means for conducting direct explanatory analysis in which the association among species can be studied according to their common and unique relationships with the environmental variables and other sets of predictors of interest, such as spatial variables. Variation partitioning can then be used to test and determine the likelihood of these sets of predictors in explaining patterns in community structure. Although variation partitioning in canonical analysis is routinely used in ecological analysis, no effort has been reported in the literature to consider appropriate estimators so that comparisons between fractions or, eventually, between different canonical models are meaningful. In this paper, we show that variation partitioning as currently applied in canonical analysis is biased. We present appropriate unbiased estimators. In addition, we outline a statistical test to compare fractions in canonical analysis. The question addressed by the test is whether two fractions of variation are significantly different from each other. Such assessment provides an important step toward attaining an understanding of the factors patterning community structure. The test is shown to have correct Type I. error rates and good power for both redundancy analysis and canonical correspondence analysis.
Fire- induced changes in Quercus laevis spatial pattern in Florida sandhills
Abandoned pastures in eastern Amazonia. I. Patterns of plant succession
Rings, circles and null-models for point pattern analysis in ecology
Community structure of a 20 hm 2 lower subtropical evergreen broad-leaved forest plot in Dinghushan, China
Spatial distribution of tree species and environmental interpretations in a secondary forest in Changbai Mountains
Spatial structures in a secondary forest in Changbai Mountains, Northeast China
Community composition and structure of Gutianshan forest dynamic plot in a mid-subtropical evergreen broad-leaved forest, East China
