The light and CO2 response curve of photosynthesis is an important tool to study plant physiology and plant ecology that can provide a scientific basis for the response of plant photosynthetic properties to environmental factors. This review considered the progress and potential weaknesses of light and CO2 response models of photosynthesis and discussed research trends. Photosynthesis, which involves energy of light, absorption, energy conversion, electron transfer, ATP synthesis, CO2 fixation etc., is a complex physical and chemical reaction process. It includes three basic steps: the primary reaction, the assimilatory power forms and the carbon assimilation, and each link may directly influence other processes. Classical models on photosynthetic light response only involve with light energy absorption, and biochemistry models do with the assimilatory power to form as well as carbon assimilation. A future direction of research of the mechanistic model of photosynthetic light response is the primary reaction of photosynthesis, namely participation the energy of light absorption, the transmission and the transformation of the harvesting light pigment member the physical parameter (e.g., the light-harvesting pigment molecules, light energy absorption cross-section of the harvesting pigment, the mean lifetime of the harvesting light pigment) unify in the biochemistry model.
Keywords:biochemical model
;
CO2 response model of photosynthesis
;
light-response model of photosynthesis
YE Zi-Piao. A review on modeling of responses of photosynthesis to light and CO2. Chinese Journal of Plant Ecology[J], 2010, 34(6): 727-740 DOI:10.3773/j.issn.1005-264x.2010.06.012
光合作用是植物(包括光合细菌)将光能转换为可用于生命过程的化学能并进行有机物合成的生物过程。光是光合作用中光能的唯一来源, CO2则是光合作用的基本原料。植物与光、CO2环境的关系一直是植物生理和植物生态学研究的热点问题(Moreno-Sotomayor et al., 2002; Awada et al., 2003; Damesin, 2003)。植物光合作用对光响应模型(或光响应曲线)研究的是植物净光合速率和光合有效辐射之间的关系, 对了解植物光化学过程中的光化学效率非常重要(Robert et al., 1984)。也可以由光合作用对光响应曲线估算植物的饱和光强、最大净光合速率、光补偿点、暗呼吸速率和表观量子效率等重要的光合参数。其中, 饱和光强反映了植物利用光强的能力, 其值高说明植物在受到强光时生长发育不易受到抑制; 叶片的最大净光合速率反映了植物叶片的最大光合能力; 光补偿点反映的是植物叶片光合作用过程中光合同化作用与呼吸消耗相当时的光强; 表观量子效率反映了植物在弱光情况下的光合能力。植物光合作用对CO2响应模型(或CO2响应曲线)研究的是植物净光合速率和CO2之间的关系, 以此可估算植物的饱和CO2浓度、光合能力、CO2补偿点、羧化效率和光下呼吸等光合参数。其中, 饱和CO2浓度反映了植物利用高CO2浓度的能力; 光合能力反映了植物叶片的光合电子传递和磷酸化的活性; CO2补偿点反映植物叶光合同化作用与呼吸消耗相当时的CO2浓度; 羧化效率反映了Rubisco的量的多少与酶活性的大小。
Fig. 1
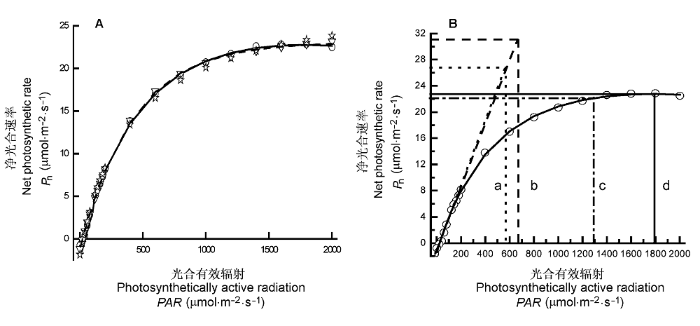
Light-response curve of photosynthesis for Triticum aestivum (Cited from Yu et al., 2004).
A, Light-response curve of photosynthesis for T. aestivum fitted by four photosynthetic light response models. ○, measured points; —, points fitted by modified model; ☆, points fitted by rectangular hyperbola; ┅, points fitted by non-rectangular hyperbola; ▽, pointed fitted by exponential equation. B, Saturation irradiance estimated by four photosynthetic light response models. a, saturation irradiance obtained by a method combined non-rectangular hyperbola with line equation; b, saturation irradiance obtained by a method combined rectangular hyperbola with line equation; c, saturation irradiance, i.e. irradiance at 0.9Pnmax; d, saturation irradiance obtained by the modified model.
Table 1
表1
表1四个光响应模型拟合温度在20 ℃、CO2浓度在365 μmol·mol-1条件下冬小麦的实测值(引自文献Yu et al., 2004)与拟合结果
Table 1 Results fitted by four models of light-response curve of photosynthesis and measured values for Triticum aestivum at 30 ℃ and 365 μmol·mol-1 CO2 concentration (Cited from Yu et al., 2004)
Fig. 2
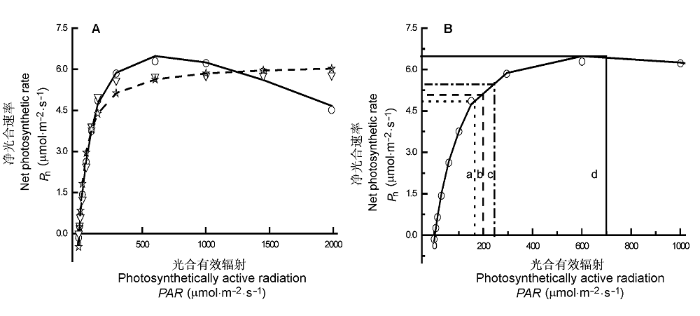
Light-response curve of photosynthesis for Bidens pilosa grown under low light condition (Cited from Ye & Zhao, 2008).
A, Light-response curve of photosynthesis for Bidens pilosa fitted by four photosynthetic light response models. ○, measured points; —, points fitted by modified model; ☆, points fitted by rectangular hyperbola; ┅, points fitted by non-rectangular hyperbola; ▽, pointed fitted by exponential equation. B, Saturation irradiance estimated by four photosynthetic light response models. a, saturation irradiance obtained by a method combined non-rectangular hyperbola with line equation; b, saturation irradiance obtained by a method combined rectangular hyperbola with line equation; c, saturation irradiance, i.e. irradiance at 0.9Pnmax; d, saturation irradiance obtained by the modified model.
Table 2
表2
表2四个光响应模型拟合温度在27.3 ℃、CO2浓度在390 μmol·mol-1条件下三叶鬼针草的实测值(引自文献 Ye & Zhao, 2008)与拟合结果
Table 2 Results fitted by four models of light-response curve of photosynthesis and measured values for Bidens pilosa grown under low light condition (Cited from Ye & Zhao, 2008)
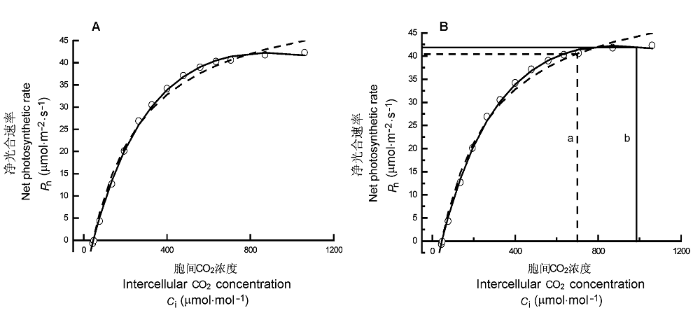
A, 3个光合作用对CO2响应模型拟合华北平原冬小麦的光响应曲线。○, 测量点; —, 修正模型的拟合点; ┅, 直角双曲线或Michaelis-Menten模型的拟合点。B, 3个光合作用对CO2响应模型估算饱和CO2浓度的方法。a,净光合速率为0.6Pnmax的CO2浓度为饱和胞间CO2浓度; b, 由修正模型得到的饱和胞间CO2浓度。
Fig. 3
Intercellular CO2 response of photosynthesis for Triticum aestivum (Cited from Yu et al., 2004).
A, CO2 response curve of photosynthesis for T. aestivum fitted by three CO2 response models of phtosynthesis. ○, measured points; —, points fitted by a modified model; ┅, points fitted by rectangular hyperbola or Michaelis-Menten model. B, Saturation CO2 estimated by three CO2 response models of photosynthesis. a, saturation intercellular CO2 concentration, i.e. Ci at 0.6Pnmax; b, saturation intercellular CO2 concentration obtained by the modified model.
During photoinhibition of photosystem II (PSII) in cyanobacteria, salt stress inhibits the repair of photodamaged PSII and, in particular, the synthesis of the D1 protein (D1). We investigated the effects of salt stress on the repair of PSII and the synthesis of D1 in wild-type tobacco (Nicotiana tabacum 'Xanthi') and in transformed plants that harbored the katE gene for catalase from Escherichia coli. Salt stress due to NaCl enhanced the photoinhibition of PSII in leaf discs from both wild-type and katE-transformed plants, but the effect of salt stress was less significant in the transformed plants than in wild-type plants. In the presence of lincomycin, which inhibits protein synthesis in chloroplasts, the activity of PSII decreased rapidly and at similar rates in both types of leaf disc during photoinhibition, and the observation suggests that repair of PSII was protected by the transgene-coded enzyme. Incorporation of [(35)S]methionine into D1 during photoinhibition was inhibited by salt stress, and the transformation mitigated this inhibitory effect. Northern blotting revealed that the level of psbA transcripts was not significantly affected by salt stress or by the transformation. Our results suggest that salt stress enhanced photoinhibition by inhibiting repair of PSII and that the katE transgene increased the resistance of the chloroplast's translational machinery to salt stress by scavenging hydrogen peroxide.
Seasonal dynamics of net photosynthesis (Anet) in 2-year-old seedlings of Pinus brutia Ten., Pinus pinea L. and Pinus pinaster Ait. were investigated. Seedlings were grown in the field in two light regimes: sun (ambient light) and shade (25% of photosynthetically active radiation (PAR)). Repeated measures analyses over a 12-month period showed that Anet varied significantly among species and from season to season. Maximum Anet in sun-acclimated seedlings was low in winter (yet remained positive) and peaked during summer. Maximum Anet was observed in June in P. pinea (12 micromol m-2 s-1), July in P. pinaster (23 micromol m-2 s-1) and August in P. brutia (20 micromol m-2 s-1). Photosynthetic light response curves saturated at a PAR of 200-300 micromol m-2 s-1 in winter and in shade-acclimated seedlings in summer. Net photosynthesis in sun-acclimated seedlings did not saturate at PAR up to 1900 micromol m-2 s-1 in P. brutia and P. pinaster. Minimum air temperature of the preceding night was apparently one of the main factors controlling Anet during the day. In shade-acclimated seedlings, photosynthetic rates were reduced by 50% in P. brutia and P. pinaster and by 20% in P. pinea compared with those in sun-acclimated seedlings. Stomatal conductance was generally lower in shaded seedlings than in seedlings grown in the sun, except on days with a high vapor pressure deficit. Total chlorophyll concentration per unit leaf area, specific leaf area (SLA) and height significantly increased in P. pinea in response to shade, but not in P. pinaster or P. brutia. In response to shade, P. brutia showed a significant increase in total chlorophyll concentration but not SLA. Photosynthetic and growth data indicate that P. pinaster and P. brutia are more light-demanding than P. pinea.
The effect of leaf-level spatial variability in photosynthetic capacity on biochemical parameter estimates using the Farquhar Model: a theoretical analysis
Application of the widely used Farquhar model of photosynthesis in interpretation of gas exchange data assumes that photosynthetic properties are homogeneous throughout the leaf. Previous studies showed that heterogeneity in stomatal conductance (g(s)) across a leaf could affect the shape of the measured leaf photosynthetic CO(2) uptake rate (A) versus intercellular CO(2) concentration (C(i)) response curve and, in turn, estimation of the critical biochemical parameters of this model. These are the maximum rates of carboxylation (V(c,max)), whole-chain electron transport (J(max)), and triose-P utilization (V(TPU)). The effects of spatial variation in V(c,max,) J(max), and V(TPU) on estimation of leaf averages of these parameters from A-C(i) curves measured on a whole leaf have not been investigated. A mathematical model incorporating defined degrees of spatial variability in V(c,max) and J(max) was constructed. One hundred and ten theoretical leaves were simulated, each with the same average V(c,max) and J(max), but different coefficients of variation of the mean (CV(VJ)) and varying correlation between V(c,max) and J(max) (Omega). Additionally, the interaction of variation in V(c,max) and J(max) with heterogeneity in V(TPU), g(s), and light gradients within the leaf was also investigated. Transition from V(c,max)- to J(max)-limited photosynthesis in the A-C(i) curve was smooth in the most heterogeneous leaves, in contrast to a distinct inflection in the absence of heterogeneity. Spatial variability had little effect on the accuracy of estimation of V(c,max) and J(max) from A-C(i) curves when the two varied in concert (Omega = 1.0), but resulted in underestimation of both parameters when they varied independently (up to 12.5% in V(c,max) and 17.7% in J(max) at CV(VJ) = 50%; Omega = 0.3). Heterogeneity in V(TPU) also significantly affected parameter estimates, but effects of heterogeneity in g(s) or light gradients were comparatively small. If V(c,max) and J(max) derived from such heterogeneous leaves are used in models to project leaf photosynthesis, actual A is overestimated by up to 12% at the transition between V(c,max)- and J(max)-limited photosynthesis. This could have implications for both crop production and Earth system models, including projections of the effects of atmospheric change.
DamesinC (2003).
Respiration and photosynthesis characteristics of current 2 year stems of Fagus sylvatica: from the seasonal pattern to an annual balance
Various aspects of the biochemistry of photosynthetic carbon assimilation in C3 plants are integrated into a form compatible with studies of gas exchange in leaves. These aspects include the kinetic properties of ribulose bisphosphate carboxylase-oxygenase; the requirements of the photosynthetic carbon reduction and photorespiratory carbon oxidation cycles for reduced pyridine nucleotides; the dependence of electron transport on photon flux and the presence of a temperature dependent upper limit to electron transport. The measurements of gas exchange with which the model outputs may be compared include those of the temperature and partial pressure of CO2(p(CO2)) dependencies of quantum yield, the variation of compensation point with temperature and partial pressure of O2(p(O2)), the dependence of net CO2 assimilation rate on p(CO2) and irradiance, and the influence of p(CO2) and irradiance on the temperature dependence of assimilation rate.
GeiderRJ, MacIntyreHL, KanaTM (1998).
A dynamic regulatory model of phytoplanktonic acclimation to, nutrients and temperatures
Blue light regulates many molecular and physiological activities in a large number of organisms. In Neurospora crassa, a eukaryotic model system for studying blue-light responses, the transcription factor and blue-light photoreceptor WHITE COLLAR-1 (WC-1) and its partner WC-2 are central to blue-light sensing. Neurospora's light responses are transient, that is, following an initial acute phase of induction, light-regulated processes are down-regulated under continuous illumination, a phenomenon called photoadaptation. The molecular mechanism(s) of photoadaptation are not well understood. Here we show that a common mechanism controls the light-induced transcription of immediate early genes (such as frq, al-3, and vvd) in Neurospora, in which light induces the binding of identical large WC-1/WC-2 complexes (L-WCC) to the light response elements (LREs) in their promoters. Using recombinant proteins, we show that the WC complexes are functional without the requirement of additional factors. In vivo, WCC has a long period photocycle, indicating that it cannot be efficiently used for repeated light activation. Contrary to previous expectations, we demonstrate that the light-induced hyperphosphorylation of WC proteins inhibits bindings of the L-WCC to the LREs. We show that, in vivo, due to its rapid hyperphosphorylation, L-WCC can only bind transiently to LREs, indicating that WCC hyperphosphorylation is a critical process for photoadaptation. Finally, phosphorylation was also shown to inhibit the LRE-binding activity of D-WCC (dark WC complex), suggesting that it plays an important role in the circadian negative feedback loop.
Growth in elevated CO2 can both increase and decrease photochemistry and photoinhibition of photosynthesis in a predictable manner. Dactylis glomerata grown in two levels of nitrogen nutrition
We report here the striking anisotropy of fluorescence exhibited by crystals of native green fluorescence protein (GFP). The crystals were generated by water dialysis of highly purified GFP obtained from the jellyfish Aequorea. We find that the fluorescence becomes six times brighter when the excitation, or emission, beam is polarized parallel (compared with perpendicular) to the crystal long axis. Thus, the major dipoles of the fluorophores must be oriented very nearly parallel to the crystal long axis. Observed in a polarizing microscope between parallel polars instead of either a polarizer or analyzer alone, the fluorescence polarization ratio rises to an unexpectedly high value of about 30:1, nearly the product of the fluorescence excitation and emission ratios, suggesting a sensitive method for measuring fluorophore orientations, even of a single fluorophore molecule. We have derived equations that accurately describe the relative fluorescence intensities of crystals oriented in various directions, with the polarizer and analyzer arranged in different configurations. The equations yield relative absorption and fluorescence coefficients for the four transition dipoles involved. Finally, we propose a model in which the elongated crystal is made of GFP molecules that are tilted 60 degrees to align the fluorophores parallel to the crystal long axis. The unit layer in the model may well correspond to the arrangement of functional GFP molecules, to which resonant energy is efficiently transmitted from Ca2+-activated aequorin, in the jellyfish photophores.
The principles, equipment and procedures for measuring leaf and canopy gas exchange have been described previously as has chlorophyll fluorescence. Simultaneous measurement of the responses of leaf gas exchange and modulated chlorophyll fluorescence to light and CO2 concentration now provide a means to determine a wide range of key biochemical and biophysical limitations on photo synthesis in vivo. Here the mathematical frameworks and practical procedures for determining these parameters in vivo are consolidated. Leaf CO2 uptake (A) versus intercellular CO2 concentration (Ci) curves may now be routinely obtained from commercial gas exchange systems. The potential pitfalls, and means to avoid these, are examined. Calculation of in vivo maximum rates of ribulose-1,5-bisphosphate (RuBP) carboxylase/oxygenase (Rubisco) carboxylation (Vc,max), electron transport driving regeneration of RuBP (Jmax), and triose-phosphate utilization (VTPU) are explained; these three parameters are now widely assumed to represent the major limitations to light-saturated photosynthesis. Precision in determining these in intact leaves is improved by the simultaneous measurement of electron transport via modulated chlorophyll fluorescence. The A/Ci response also provides a simple practical method for quantifying the limitation that stomata impose on CO2 assimilation. Determining the rate of photorespiratory release of oxygen (Rl) has previously only been possible by isotopic methods, now, by combining gas exchange and fluorescence measurements, Rl may be determined simply and routinely in the field. The physical diffusion of CO2 from the intercellular air space to the site of Rubisco in C3 leaves has long been suspected of being a limitation on photosynthesis, but it has commonly been ignored because of the lack of a practical method for its determination. Again combining gas exchange and fluorescence provides a means to determine mesophyll conductance. This method is described and provides insights into the magnitude and basis of this limitation.
LongSP, HumpherisS, FalkowskiPG (1994).
Photoinhibition of photosynthesis in nature
Annual Review of Plant Physiology and Plant Molecular Biology, 45, 633-662.
Transcription of the Neurospora crassa gene con-10 is induced during conidiation and following exposure of vegetative mycelia to light, but light activation is transient due to photoadaptation. We describe mutational analyses of photoadaptation using a N. crassa strain bearing a translational fusion of con-10, including its regulatory region, to a selectable bacterial gene conferring hygromycin resistance (hph). Growth of this strain was sensitive to hygromycin, upon continuous culture in the light. Five mutants were isolated that were resistant to hygromycin when cultured under constant light. Three mutant strains displayed elevated, sustained accumulation of con-10::hph mRNA during continued light exposure, suggesting that they bear mutations that reduce or eliminate the presumed light-dependent repression mechanism that blocks con-10 transcription upon prolonged illumination. These mutations altered photoadaptation for only a specific group of genes (con-10 and con-6), suggesting that regulation of photoadaptation is relatively gene specific. The mutations increased light-dependent mRNA accumulation for genes al-1, al-2, and al-3, each required for carotenoid biosynthesis, resulting in a threefold increase in carotenoid accumulation following continuous light exposure. Identification of the altered gene or genes in these mutants may reveal novel proteins that participate in light regulation of gene transcription in fungi.
OsmondCB (1994).
What is photoinhibition? Some insights from comparisons of shade and sun plants
In: Baker NR ed. Photoinhibition of Photosynthesis: from Molecular Mechanisms to FieldBIOS Scientific Publishers, Oxford. 1-24.
BACKGROUND AND AIMS: Theory for optimal allocation of foliar nitrogen (ONA) predicts that both nitrogen concentration and photosynthetic capacity will scale linearly with gradients of insolation within plant canopies. ONA is expected to allow plants to efficiently use both light and nitrogen. However, empirical data generally do not exhibit perfect ONA, and light-use optimization per se is little explored. The aim was to examine to what degree partitioning of nitrogen or light is optimized in the crowns of three tropical canopy tree species. METHODS: Instantaneous photosynthetic photon flux density (PPFD) incident on the adaxial surface of individual leaves was measured along vertical PPFD gradients in tree canopies at a frequency of 0.5 Hz over 9-17 d, and summed to obtain the average daily integral of PPFD for each leaf to characterize its insolation regime. Also measured were leaf N per area (N(area)), leaf mass per area (LMA), the cosine of leaf inclination and the parameters of the photosynthetic light response curve [photosynthetic capacity (A(max)), dark respiration (R(d)), apparent quantum yield (phi) and curvature (theta)]. The instantaneous PPFD measurements and light response curves were used to estimate leaf daily photosynthesis (A(daily)) for each leaf. KEY RESULTS: Leaf N(area) and A(max) changed as a hyperbolic asymptotic function of the PPFD regime, not the linear relationship predicted by ONA. Despite this suboptimal nitrogen partitioning among leaves, A(daily) did increase linearly with PPFD regime through co-ordinated adjustments in both leaf angle and physiology along canopy gradients in insolation, exhibiting a strong convergence among the three species. CONCLUSIONS: The results suggest that canopy tree leaves in this tropical forest optimize photosynthetic use of PPFD rather than N per se. Tropical tree canopies then can be considered simple 'big-leaves' in which all constituent 'small leaves' use PPFD with the same photosynthetic efficiency.
PradoCHBA, MoraesJAPV (1997).
Photosynthetic capacity and specific leaf mass in twenty woody species of Cerrado vegetation under field condition
Leaves of C(3) plants which exhibit a normal O(2) inhibition of CO(2) fixation at less than saturating light intensity were found to exhibit O(2)-insensitive photosynthesis at high light. This behavior was observed in Phaseolus vulgaris L., Xanthium strumarium L., and Scrophularia desertorum (Shaw.) Munz. O(2)-insensitive photosynthesis has been reported in nine other C(3) species and usually occurred when the intercellular CO(2) pressure was about double the normal pressure. A lack of O(2) inhibition of photosynthesis was always accompanied by a failure of increased CO(2) pressure to stimulate photosynthesis to the expected degree. O(2)-insensitive photosynthesis also occurred after plants had been water stressed. Under such conditions, however, photosynthesis became O(2) and CO(2) insensitive at physiological CO(2) pressures. Postillumination CO(2) exchange kinetics showed that O(2) and CO(2) insensitivity was not the result of elimination of photorespiration.It is proposed that O(2) and CO(2) insensitivity occurs when the concentration of phosphate in the chloroplast stroma cannot be both high enough to allow photophosphorylation and low enough to allow starch and sucrose synthesis at the rates required by the rest of the photosynthetic component processes. Under these conditions, the energy diverted to photorespiration does not adversely affect the potential for CO(2) assimilation.
Photosynthetic responses to carbon dioxide concentration can provide data on a number of important parameters related to leaf physiology. Methods for fitting a model to such data are briefly described. The method will fit the following parameters: V(cmax), J, TPU, R(d) and g(m)[maximum carboxylation rate allowed by ribulose 1.5-bisphosphate carboxylase/oxygenase (Rubisco), rate of photosynthetic electron transport (based on NADPH requirement), triose phosphate use, day respiration and mesophyll conductance, respectively]. The method requires at least five data pairs of net CO(2) assimilation (A) and [CO(2)] in the intercellular airspaces of the leaf (C(i)) and requires users to indicate the presumed limiting factor. The output is (1) calculated CO(2) partial pressure at the sites of carboxylation, C(c), (2) values for the five parameters at the measurement temperature and (3) values adjusted to 25 degrees C to facilitate comparisons. Fitting this model is a way of exploring leaf level photosynthesis. However, interpreting leaf level photosynthesis in terms of underlying biochemistry and biophysics is subject to assumptions that hold to a greater or lesser degree, a major assumption being that all parts of the leaf are behaving in the same way at each instant.
SpringerCJ, ThomasRB (2007).
Photosynthetic responses of forest understory tree species to long-term exposure to elevated carbon dioxide concentration at the Duke Forest FACE experiment
We examined the photosynthetic responses of four species of saplings growing in the understory of the Duke Forest FACE experiment during the seventh year of exposure to elevated CO2 concentration ([CO2]). Saplings of these same species were measured in the first year of the Duke Forest FACE experiment and at that time showed only seasonal fluctuations in acclimation of photosynthesis to elevated [CO2]. Based on observations from the Duke Forest FACE experiment, we hypothesized that after seven years of exposure to elevated [CO2] significant photosynthetic down-regulation would be observed in these tree species. To test our hypothesis, photosynthetic CO2-response and light-response curves, along with chlorophyll fluorescence, chlorophyll concentration and foliar N were measured twice during the summer of 2003. Exposure to elevated [CO2] continued to increase photosynthesis in all species measured after seven years of treatment with the greatest photosynthetic increase observed near saturating irradiances. In all species, elevated [CO2] increased electron transport efficiency but did not significantly alter carboxylation efficiency. Quantum yield estimated by light curves, chlorophyll concentration, and foliar nitrogen concentrations were unaffected by elevated [CO2]. Contrary to our hypothesis, there is little evidence of progressive N limitation of leaf-level processes in these understory tree species after seven years of exposure to elevated [CO2] in the Duke Forest FACE experiment.
Cyclic electron flow (CEF) around photosystem I has a role in avoiding photoinhibition of photosystem II (PSII), which occurs under conditions in which the rate of photodamage to PSII exceeds the rate of its repair. However, the molecular mechanism underlying how CEF contributes to photoprotection is not yet well understood. We examined the effect of impairment of CEF and thermal energy dissipation (qE) on photoinhibition using CEF (pgr5) and qE (npq1 and npq4) mutants of Arabidopsis (Arabidopsis thaliana) exposed to strong light. Impairment of CEF by mutation of pgr5 suppressed qE and accelerated photoinhibition. We found that impairment of qE, by mutations of pgr5, npq1, and npq4, caused inhibition of the repair of photodamaged PSII at the step of the de novo synthesis of the D1 protein. In the presence of the chloroplast protein synthesis inhibitor chloramphenicol, impairment of CEF, but not impairment of qE, accelerated photoinhibition, and a similar effect was obtained when leaves were infiltrated with the protonophore nigericin. These results suggest that CEF-dependent generation of DeltapH across the thylakoid membrane helps to alleviate photoinhibition by at least two different photoprotection mechanisms: one is linked to qE generation and prevents the inhibition of the repair of photodamaged PSII at the step of protein synthesis, and the other is independent of qE and suppresses photodamage to PSII.
A series of experiments is presented investigating short term and long term changes of the nature of the response of rate of CO2 assimilation to intercellular p(CO2). The relationships between CO2 assimilation rate and biochemical components of leaf photosynthesis, such as ribulose-bisphosphate (RuP2) carboxylase-oxygenase activity and electron transport capacity are examined and related to current theory of CO2 assimilation in leaves of C3 species. It was found that the response of the rate of CO2 assimilation to irradiance, partial pressure of O2, p(O2), and temperature was different at low and high intercellular p(CO2), suggesting that CO2 assimilation rate is governed by different processes at low and high intercellular p(CO2). In longer term changes in CO2 assimilation rate, induced by different growth conditions, the initial slope of the response of CO2 assimilation rate to intercellular p(CO2) could be correlated to in vitro measurements of RuP2 carboxylase activity. Also, CO2 assimilation rate at high p(CO2) could be correlated to in vitro measurements of electron transport rate. These results are consistent with the hypothesis that CO2 assimilation rate is limited by the RuP2 saturated rate of the RuP2 carboxylase-oxygenase at low intercellular p(CO2) and by the rate allowed by RuP2 regeneration capacity at high intercellular p(CO2).
In: Yan GG (严国光), Zhou PZ (周佩珍), Guo C (郭础), Dai YL (戴云玲) eds. Primary Process of Photosynthesis (光合作用的原初过程). Science Press, Beijing. 62-102. (in Chinese)
The calculated maximum net photosynthetic rate (P N) at saturation irradiance (I m) of 1 314.13 μmol m−2 s−1 was 25.49 μmol(CO2) m−2 s−1, and intrinsic quantum yield at zero irradiance was 0.103. The results fitted by nonrectangular hyperbolic model, rectangular hyperbolic method, binomial regression method, and the new model were compared. The maximum P N values calculated by nonrectangular hyperbolic model and rectangular hyperbolic model were higher than the measured values, and the I m calculated by nonrectangular hyperbolic model and rectangular hyperbolic model were less than measured values. Results fitted by new model showed that the response curve of P N to I was nonlinear at low I for Oryza sativa, P N increased nonlinearly with I below saturation value. Above this value, P N decreased nonlinearly with I.]]>
YeZP (叶子飘), YuQ (于强) (2008).
Comparison of new and several classical models of photosynthesis in response to irradiance
Journal of Plant Ecology (Chinese Version)(植物生态学报), 32, 1356-1361. (in Chinese with English abstract)
The model couples stomatal conductance (g s) and net photosynthetic rate (P N) describing not only part of the curve up to and including saturation irradiance (I max), but also the range above the saturation irradiance. Maximum stomatal conductance (g smax) and I max can be calculated by the coupled model. For winter wheat (Triticum aestivum) the fitted results showed that maximum P N (P max) at 600 μmol mol−1 was more than at 350 μmol mol−1 under the same leaf temperature, which can not be explained by the stomatal closure at high CO2 concentration because g smax at 600 μmol mol−1 was less than at 350 μmol mol−1. The irradiance-response curves for winter wheat had similar tendency, e.g. at 25 °C and 350 μmol mol−1 both P N and g s almost synchronously reached the maximum values at about 1 600 μmol m−2 s−1. At 25 °C and 600 μmol mol−1 the I max corresponding to P max and g smax was 2 080 and 1 575 μmol m−2 s−1, respectively.]]>
YeZP, ZhaoZH (2008).
Primary application on a light-response model to describe light response curve of Bidens pilosa leaf net photosynthesis, grown at two different light intensities
Proceedings of the 6th Conference of Biomathematics. World Academic Press, England, UK. 889-892.
BACKGROUND AND AIMS: The stomata are a key channel of the water cycle in ecosystems, and are constrained by both physiological and environmental elements. The aim of this study was to parameterize stomatal conductance by extending a previous empirical model and a revised Ball-Berry model. METHODS: Light and CO(2) responses of stomatal conductance and photosynthesis of winter wheat in the North China Plain were investigated under ambient and free-air CO(2) enrichment conditions. The photosynthetic photon flux density and CO(2) concentration ranged from 0 to 2000 micro mol m(-2) s(-1) and from 0 to 1400 micro mol mol(-1), respectively. The model was validated with data from a light, temperature and CO(2) response experiment. RESULTS: By using previously published hyperbolic equations of photosynthetic responses to light and CO(2), the number of parameters in the model was reduced. These response curves were observed diurnally with large variations of temperature and vapour pressure deficit. The model interpreted stomatal response under wide variations in environmental factors. CONCLUSIONS: Most of the model parameters, such as initial photon efficiency and maximum photosynthetic rate (P(max)), have physiological meanings. The model can be expanded to include influences of other physiological elements, such as leaf ageing and nutrient conditions, especially leaf nitrogen content.
The photosynthetic characteristics of Eriobotrya japonica in northern marginal cultivation area in Spring
1
2008
... 与直角双曲线模型的讨论相似.如果植物在饱和光强之后光合速率不下降, 则用非直角双曲线模型估算的植物Pnmax必大于实测值(Springer & Thomas, 2007; Ye & Zhao, 2008; Ye & Yu, 2008; Lombardini et al., 2009; Posada et al., 2009), 且无法用它拟合光合速率随光强增加而下降这一段响应曲线(Ye & Zhao, 2008; 张中峰等, 2009).此外, 估算植物的饱和光强方法与直角双曲线模型的方法相同, 但用这种方法得到的饱和光强同样远小于实测值(曹雪丹等, 2008; 贾彩凤和李艾莲, 2008; 叶子飘和于强, 2008; 张中峰等, 2009). ...
The effect of leaf-level spatial variability in photosynthetic capacity on biochemical parameter estimates using the Farquhar Model: a theoretical analysis
1
2008
... 从上面对生化模型的描述可知, 虽然生化模型中涉及的参数和方程比较多, 但当外界环境因素确定时, 就可以用(24)式拟合CO2响应曲线估算植物的生化参数, 如Vc,max、J、TPU和Rd等(Harley et al., 1992; Hymus et al., 2001; Bernacchi et al., 2003; Long & Bernacchi, 2003; Ethier & Livingston, 2004; Sharkey et al., 2007; Chen et al., 2008).且这4个生化参数中只有J可通过快速光曲线(rapid light curve, RLC)确定, Rd可通过气体交换测量确定, 而Vcmax和TPU是隐参数, 无法通过实验测量这两个参数值. ...
Respiration and photosynthesis characteristics of current 2 year stems of Fagus sylvatica: from the seasonal pattern to an annual balance
1
2003
... 光合作用是植物(包括光合细菌)将光能转换为可用于生命过程的化学能并进行有机物合成的生物过程.光是光合作用中光能的唯一来源, CO2则是光合作用的基本原料.植物与光、CO2环境的关系一直是植物生理和植物生态学研究的热点问题(Moreno-Sotomayor et al., 2002; Awada et al., 2003; Damesin, 2003).植物光合作用对光响应模型(或光响应曲线)研究的是植物净光合速率和光合有效辐射之间的关系, 对了解植物光化学过程中的光化学效率非常重要(Robert et al., 1984).也可以由光合作用对光响应曲线估算植物的饱和光强、最大净光合速率、光补偿点、暗呼吸速率和表观量子效率等重要的光合参数.其中, 饱和光强反映了植物利用光强的能力, 其值高说明植物在受到强光时生长发育不易受到抑制; 叶片的最大净光合速率反映了植物叶片的最大光合能力; 光补偿点反映的是植物叶片光合作用过程中光合同化作用与呼吸消耗相当时的光强; 表观量子效率反映了植物在弱光情况下的光合能力.植物光合作用对CO2响应模型(或CO2响应曲线)研究的是植物净光合速率和CO2之间的关系, 以此可估算植物的饱和CO2浓度、光合能力、CO2补偿点、羧化效率和光下呼吸等光合参数.其中, 饱和CO2浓度反映了植物利用高CO2浓度的能力; 光合能力反映了植物叶片的光合电子传递和磷酸化的活性; CO2补偿点反映植物叶光合同化作用与呼吸消耗相当时的CO2浓度; 羧化效率反映了Rubisco的量的多少与酶活性的大小. ...
On the need to incorporate sensitivity to CO2 transfer conductance into the Farquhar-von Caemmerer-Berry leaf photosynthesis model
Growth in elevated CO2 can both increase and decrease photochemistry and photoinhibition of photosynthesis in a predictable manner. Dactylis glomerata grown in two levels of nitrogen nutrition
2
2001
... 从上面对生化模型的描述可知, 虽然生化模型中涉及的参数和方程比较多, 但当外界环境因素确定时, 就可以用(24)式拟合CO2响应曲线估算植物的生化参数, 如Vc,max、J、TPU和Rd等(Harley et al., 1992; Hymus et al., 2001; Bernacchi et al., 2003; Long & Bernacchi, 2003; Ethier & Livingston, 2004; Sharkey et al., 2007; Chen et al., 2008).且这4个生化参数中只有J可通过快速光曲线(rapid light curve, RLC)确定, Rd可通过气体交换测量确定, 而Vcmax和TPU是隐参数, 无法通过实验测量这两个参数值. ...
... 尽管人们对光合作用光和CO2响应模型的研究取得了很大进展, 但仍存在以下问题: 1)光合作用对光和CO2响应的经验模型只涉及植物对光能和CO2的利用; 光合作用对CO2响应的生化模型则涉及当光合有效辐射一定时植物所同化的CO2量, 考虑了光、CO2浓度和温度等环境因子对光合速率的影响.2)光合作用对光和CO2响应的经验模型估算的参数属于显性参数, 拟合结果可以与实测值进行比较, 而生化模型通过拟合CO2响应曲线得到的参数除了电子传递速率和光下暗呼吸速率外, 其他2个是隐性参数, 这些隐性参数无法由实验直接测量.3)光合作用的光响应模型和生化模型没有有机地联系起来, 即这些模型仅仅各自研究了植物的光能吸收和CO2的同化问题, 无法用这些模型研究和解决植物的光抑制(Long et al., 1994; Weis & Berry, 1987; Osmond, 1994; Hymus et al., 2001; Al-Taweel et al., 2007; Takahashi et al., 2009)、光适应(Marra, 1978a, 1978b; Geider et al., 1998; He & Liu, 2005; Navarro-Sampedro et al., 2008)和荧光(Lichtenthaler, 1992; Govindjee, 1995; Krause & Weis, 1991; Inoué et al., 2002; Sekatskii, 2004)等问题. ...
Fluorescence polarization of green fluorescence protein
1
2002
... 尽管人们对光合作用光和CO2响应模型的研究取得了很大进展, 但仍存在以下问题: 1)光合作用对光和CO2响应的经验模型只涉及植物对光能和CO2的利用; 光合作用对CO2响应的生化模型则涉及当光合有效辐射一定时植物所同化的CO2量, 考虑了光、CO2浓度和温度等环境因子对光合速率的影响.2)光合作用对光和CO2响应的经验模型估算的参数属于显性参数, 拟合结果可以与实测值进行比较, 而生化模型通过拟合CO2响应曲线得到的参数除了电子传递速率和光下暗呼吸速率外, 其他2个是隐性参数, 这些隐性参数无法由实验直接测量.3)光合作用的光响应模型和生化模型没有有机地联系起来, 即这些模型仅仅各自研究了植物的光能吸收和CO2的同化问题, 无法用这些模型研究和解决植物的光抑制(Long et al., 1994; Weis & Berry, 1987; Osmond, 1994; Hymus et al., 2001; Al-Taweel et al., 2007; Takahashi et al., 2009)、光适应(Marra, 1978a, 1978b; Geider et al., 1998; He & Liu, 2005; Navarro-Sampedro et al., 2008)和荧光(Lichtenthaler, 1992; Govindjee, 1995; Krause & Weis, 1991; Inoué et al., 2002; Sekatskii, 2004)等问题. ...
Redox potentials of chlorophylls in the photosystem II reaction center
1
2005
... 类囊体膜是光合作用的原初光化学反应、电子传递和光合磷酸化的发生部位.现在, 人们虽然对类囊体膜的超微结构、化学组成和空间结构(Liu et al., 2004; Ishikita et al., 2005; Raszewski et al., 2005; Vasil’ev & Bruce, 2006; van der Weij-De Wit et al., 2008)已有所了解, 同时也比较清楚植物光合作用的发生过程(严国光, 1987; 徐春和和米华玲, 2001), 但是, 目前人们对植物光合作用对光响应机理的认识还不是十分清楚.多年来, 许多学者的研究结果证实, 光强和光质在植物光合作用对光响应中起重要的作用, 并且探明了捕光天线色素分子在光能的吸收和传递中担当的角色(Raszewski et al., 2005; van der Weij-De Wit et al., 2007).然而, 我们现在还无法从理论上预测捕光天线色素分子吸收的光能中有多少光能被用于退激发(热辐射和荧光)、多少光能用于共振传递到PSII, 从而引起PSII的电荷分离以及此后的电子传递, 尤其是光能吸收、传递和退激发与PSII捕光天线色素分子的哪些物理参数有关, 以及这些参数之间的关系如何. ...
Studies on photosynthetic characteristics of medicinal plant Fagoyrum cymosum
1
2008
... 与直角双曲线模型的讨论相似.如果植物在饱和光强之后光合速率不下降, 则用非直角双曲线模型估算的植物Pnmax必大于实测值(Springer & Thomas, 2007; Ye & Zhao, 2008; Ye & Yu, 2008; Lombardini et al., 2009; Posada et al., 2009), 且无法用它拟合光合速率随光强增加而下降这一段响应曲线(Ye & Zhao, 2008; 张中峰等, 2009).此外, 估算植物的饱和光强方法与直角双曲线模型的方法相同, 但用这种方法得到的饱和光强同样远小于实测值(曹雪丹等, 2008; 贾彩凤和李艾莲, 2008; 叶子飘和于强, 2008; 张中峰等, 2009). ...
Photosynthetic response of carrots to varying irradiances
2
2003
... 由于α和Pnmax均大于0, 由(2)式可知必有${{P}_{\text{n}}}^{'}>0$, 表明(1)式是一个没有极值的函数, 也即直角双曲线是一条没有极点的渐近线.因此, 我们无法由(1)式直接求出植物的Pnmax和饱和光强, 即无法用(1)式求解植物饱和光强的解析解.为了估算Pnmax, 就必须利用非线性最小二乘法.如果植物在饱和光强之后光合速率不下降, 则得到的Pnmax必远大于实测值(Kyei-Boahen et al., 2003; Yu et al., 2004; Leakey et al., 2006; 孙旭生等, 2009; 王照兰等, 2009), 且无法用此模型拟合光合速率随光强增加而下降这一段响应曲线(Ye & Zhao, 2008).此外, 直角双曲线模型也无法直接估算植物的饱和光强(Kyei-Boahen et al., 2003; Yu et al., 2004; Leakey et al., 2006).为了估算植物的饱和光强, 就需要用直线方程拟合弱光强条件下(≤200 μmol·m-2·s-1)的光响应数据得到表观量子效率(apparent quantum efficiency, AQE), 然后解直线方程: Pnmax = AQE $\times $ Isat - Rd可以得到饱和光强(Isat).然而用这种方法得到的饱和光强远小于实测值(叶子飘和于强, 2008; 张中峰等, 2009).也有学者假设0.7Pnmax所对应的光强为饱和光强(张雪松等, 2009). ...
The Kautsky effect: 60 years of chlorophyll fluorescence induction kinetics
1
1992
... 尽管人们对光合作用光和CO2响应模型的研究取得了很大进展, 但仍存在以下问题: 1)光合作用对光和CO2响应的经验模型只涉及植物对光能和CO2的利用; 光合作用对CO2响应的生化模型则涉及当光合有效辐射一定时植物所同化的CO2量, 考虑了光、CO2浓度和温度等环境因子对光合速率的影响.2)光合作用对光和CO2响应的经验模型估算的参数属于显性参数, 拟合结果可以与实测值进行比较, 而生化模型通过拟合CO2响应曲线得到的参数除了电子传递速率和光下暗呼吸速率外, 其他2个是隐性参数, 这些隐性参数无法由实验直接测量.3)光合作用的光响应模型和生化模型没有有机地联系起来, 即这些模型仅仅各自研究了植物的光能吸收和CO2的同化问题, 无法用这些模型研究和解决植物的光抑制(Long et al., 1994; Weis & Berry, 1987; Osmond, 1994; Hymus et al., 2001; Al-Taweel et al., 2007; Takahashi et al., 2009)、光适应(Marra, 1978a, 1978b; Geider et al., 1998; He & Liu, 2005; Navarro-Sampedro et al., 2008)和荧光(Lichtenthaler, 1992; Govindjee, 1995; Krause & Weis, 1991; Inoué et al., 2002; Sekatskii, 2004)等问题. ...
Crystal structure of spinach major light-harvesting complex at 2.72? resolution
1
2004
... 类囊体膜是光合作用的原初光化学反应、电子传递和光合磷酸化的发生部位.现在, 人们虽然对类囊体膜的超微结构、化学组成和空间结构(Liu et al., 2004; Ishikita et al., 2005; Raszewski et al., 2005; Vasil’ev & Bruce, 2006; van der Weij-De Wit et al., 2008)已有所了解, 同时也比较清楚植物光合作用的发生过程(严国光, 1987; 徐春和和米华玲, 2001), 但是, 目前人们对植物光合作用对光响应机理的认识还不是十分清楚.多年来, 许多学者的研究结果证实, 光强和光质在植物光合作用对光响应中起重要的作用, 并且探明了捕光天线色素分子在光能的吸收和传递中担当的角色(Raszewski et al., 2005; van der Weij-De Wit et al., 2007).然而, 我们现在还无法从理论上预测捕光天线色素分子吸收的光能中有多少光能被用于退激发(热辐射和荧光)、多少光能用于共振传递到PSII, 从而引起PSII的电荷分离以及此后的电子传递, 尤其是光能吸收、传递和退激发与PSII捕光天线色素分子的哪些物理参数有关, 以及这些参数之间的关系如何. ...
Photosynthetic light response and epidermal characteristics of sun and shade pecan leaves
1
2009
... 与直角双曲线模型的讨论相似.如果植物在饱和光强之后光合速率不下降, 则用非直角双曲线模型估算的植物Pnmax必大于实测值(Springer & Thomas, 2007; Ye & Zhao, 2008; Ye & Yu, 2008; Lombardini et al., 2009; Posada et al., 2009), 且无法用它拟合光合速率随光强增加而下降这一段响应曲线(Ye & Zhao, 2008; 张中峰等, 2009).此外, 估算植物的饱和光强方法与直角双曲线模型的方法相同, 但用这种方法得到的饱和光强同样远小于实测值(曹雪丹等, 2008; 贾彩凤和李艾莲, 2008; 叶子飘和于强, 2008; 张中峰等, 2009). ...
Gas exchange measurements, what can they tell us about the underlying limitations to photosynthesis? Procedures and sources of error
Theory of optical spectra of photosystem II reaction centers: location of the triplet state and the identity of the primary electron donor
2
2005
... 类囊体膜是光合作用的原初光化学反应、电子传递和光合磷酸化的发生部位.现在, 人们虽然对类囊体膜的超微结构、化学组成和空间结构(Liu et al., 2004; Ishikita et al., 2005; Raszewski et al., 2005; Vasil’ev & Bruce, 2006; van der Weij-De Wit et al., 2008)已有所了解, 同时也比较清楚植物光合作用的发生过程(严国光, 1987; 徐春和和米华玲, 2001), 但是, 目前人们对植物光合作用对光响应机理的认识还不是十分清楚.多年来, 许多学者的研究结果证实, 光强和光质在植物光合作用对光响应中起重要的作用, 并且探明了捕光天线色素分子在光能的吸收和传递中担当的角色(Raszewski et al., 2005; van der Weij-De Wit et al., 2007).然而, 我们现在还无法从理论上预测捕光天线色素分子吸收的光能中有多少光能被用于退激发(热辐射和荧光)、多少光能用于共振传递到PSII, 从而引起PSII的电荷分离以及此后的电子传递, 尤其是光能吸收、传递和退激发与PSII捕光天线色素分子的哪些物理参数有关, 以及这些参数之间的关系如何. ...
... ), 但是, 目前人们对植物光合作用对光响应机理的认识还不是十分清楚.多年来, 许多学者的研究结果证实, 光强和光质在植物光合作用对光响应中起重要的作用, 并且探明了捕光天线色素分子在光能的吸收和传递中担当的角色(Raszewski et al., 2005; van der Weij-De Wit et al., 2007).然而, 我们现在还无法从理论上预测捕光天线色素分子吸收的光能中有多少光能被用于退激发(热辐射和荧光)、多少光能用于共振传递到PSII, 从而引起PSII的电荷分离以及此后的电子传递, 尤其是光能吸收、传递和退激发与PSII捕光天线色素分子的哪些物理参数有关, 以及这些参数之间的关系如何. ...
Kok effect and the quantum yield of photosynthesis
1
1984
... 光合作用是植物(包括光合细菌)将光能转换为可用于生命过程的化学能并进行有机物合成的生物过程.光是光合作用中光能的唯一来源, CO2则是光合作用的基本原料.植物与光、CO2环境的关系一直是植物生理和植物生态学研究的热点问题(Moreno-Sotomayor et al., 2002; Awada et al., 2003; Damesin, 2003).植物光合作用对光响应模型(或光响应曲线)研究的是植物净光合速率和光合有效辐射之间的关系, 对了解植物光化学过程中的光化学效率非常重要(Robert et al., 1984).也可以由光合作用对光响应曲线估算植物的饱和光强、最大净光合速率、光补偿点、暗呼吸速率和表观量子效率等重要的光合参数.其中, 饱和光强反映了植物利用光强的能力, 其值高说明植物在受到强光时生长发育不易受到抑制; 叶片的最大净光合速率反映了植物叶片的最大光合能力; 光补偿点反映的是植物叶片光合作用过程中光合同化作用与呼吸消耗相当时的光强; 表观量子效率反映了植物在弱光情况下的光合能力.植物光合作用对CO2响应模型(或CO2响应曲线)研究的是植物净光合速率和CO2之间的关系, 以此可估算植物的饱和CO2浓度、光合能力、CO2补偿点、羧化效率和光下呼吸等光合参数.其中, 饱和CO2浓度反映了植物利用高CO2浓度的能力; 光合能力反映了植物叶片的光合电子传递和磷酸化的活性; CO2补偿点反映植物叶光合同化作用与呼吸消耗相当时的CO2浓度; 羧化效率反映了Rubisco的量的多少与酶活性的大小. ...
Fluorescence resonance energy transfer scanning near-field optical microscopy
1
2004
... 尽管人们对光合作用光和CO2响应模型的研究取得了很大进展, 但仍存在以下问题: 1)光合作用对光和CO2响应的经验模型只涉及植物对光能和CO2的利用; 光合作用对CO2响应的生化模型则涉及当光合有效辐射一定时植物所同化的CO2量, 考虑了光、CO2浓度和温度等环境因子对光合速率的影响.2)光合作用对光和CO2响应的经验模型估算的参数属于显性参数, 拟合结果可以与实测值进行比较, 而生化模型通过拟合CO2响应曲线得到的参数除了电子传递速率和光下暗呼吸速率外, 其他2个是隐性参数, 这些隐性参数无法由实验直接测量.3)光合作用的光响应模型和生化模型没有有机地联系起来, 即这些模型仅仅各自研究了植物的光能吸收和CO2的同化问题, 无法用这些模型研究和解决植物的光抑制(Long et al., 1994; Weis & Berry, 1987; Osmond, 1994; Hymus et al., 2001; Al-Taweel et al., 2007; Takahashi et al., 2009)、光适应(Marra, 1978a, 1978b; Geider et al., 1998; He & Liu, 2005; Navarro-Sampedro et al., 2008)和荧光(Lichtenthaler, 1992; Govindjee, 1995; Krause & Weis, 1991; Inoué et al., 2002; Sekatskii, 2004)等问题. ...
O2-insensitive photosynthesis in C3 plants. its occurrence and a possible explanation
Fitting photosynthetic carbon dioxide response curves for C3 leaves
1
2007
... 从上面对生化模型的描述可知, 虽然生化模型中涉及的参数和方程比较多, 但当外界环境因素确定时, 就可以用(24)式拟合CO2响应曲线估算植物的生化参数, 如Vc,max、J、TPU和Rd等(Harley et al., 1992; Hymus et al., 2001; Bernacchi et al., 2003; Long & Bernacchi, 2003; Ethier & Livingston, 2004; Sharkey et al., 2007; Chen et al., 2008).且这4个生化参数中只有J可通过快速光曲线(rapid light curve, RLC)确定, Rd可通过气体交换测量确定, 而Vcmax和TPU是隐参数, 无法通过实验测量这两个参数值. ...
Photosynthetic responses of forest understory tree species to long-term exposure to elevated carbon dioxide concentration at the Duke Forest FACE experiment
1
2007
... 与直角双曲线模型的讨论相似.如果植物在饱和光强之后光合速率不下降, 则用非直角双曲线模型估算的植物Pnmax必大于实测值(Springer & Thomas, 2007; Ye & Zhao, 2008; Ye & Yu, 2008; Lombardini et al., 2009; Posada et al., 2009), 且无法用它拟合光合速率随光强增加而下降这一段响应曲线(Ye & Zhao, 2008; 张中峰等, 2009).此外, 估算植物的饱和光强方法与直角双曲线模型的方法相同, 但用这种方法得到的饱和光强同样远小于实测值(曹雪丹等, 2008; 贾彩凤和李艾莲, 2008; 叶子飘和于强, 2008; 张中峰等, 2009). ...
Effects of different amount of nitrogen supply on the CO2-response curve in flag leaves of super high-yield winter wheat at flowering stage
1
2009
... 由于α和Pnmax均大于0, 由(2)式可知必有${{P}_{\text{n}}}^{'}>0$, 表明(1)式是一个没有极值的函数, 也即直角双曲线是一条没有极点的渐近线.因此, 我们无法由(1)式直接求出植物的Pnmax和饱和光强, 即无法用(1)式求解植物饱和光强的解析解.为了估算Pnmax, 就必须利用非线性最小二乘法.如果植物在饱和光强之后光合速率不下降, 则得到的Pnmax必远大于实测值(Kyei-Boahen et al., 2003; Yu et al., 2004; Leakey et al., 2006; 孙旭生等, 2009; 王照兰等, 2009), 且无法用此模型拟合光合速率随光强增加而下降这一段响应曲线(Ye & Zhao, 2008).此外, 直角双曲线模型也无法直接估算植物的饱和光强(Kyei-Boahen et al., 2003; Yu et al., 2004; Leakey et al., 2006).为了估算植物的饱和光强, 就需要用直线方程拟合弱光强条件下(≤200 μmol·m-2·s-1)的光响应数据得到表观量子效率(apparent quantum efficiency, AQE), 然后解直线方程: Pnmax = AQE $\times $ Isat - Rd可以得到饱和光强(Isat).然而用这种方法得到的饱和光强远小于实测值(叶子飘和于强, 2008; 张中峰等, 2009).也有学者假设0.7Pnmax所对应的光强为饱和光强(张雪松等, 2009). ...
How does cyclic electron flow alleviate photoinhibition in Arabidopsis?
1
2009
... 尽管人们对光合作用光和CO2响应模型的研究取得了很大进展, 但仍存在以下问题: 1)光合作用对光和CO2响应的经验模型只涉及植物对光能和CO2的利用; 光合作用对CO2响应的生化模型则涉及当光合有效辐射一定时植物所同化的CO2量, 考虑了光、CO2浓度和温度等环境因子对光合速率的影响.2)光合作用对光和CO2响应的经验模型估算的参数属于显性参数, 拟合结果可以与实测值进行比较, 而生化模型通过拟合CO2响应曲线得到的参数除了电子传递速率和光下暗呼吸速率外, 其他2个是隐性参数, 这些隐性参数无法由实验直接测量.3)光合作用的光响应模型和生化模型没有有机地联系起来, 即这些模型仅仅各自研究了植物的光能吸收和CO2的同化问题, 无法用这些模型研究和解决植物的光抑制(Long et al., 1994; Weis & Berry, 1987; Osmond, 1994; Hymus et al., 2001; Al-Taweel et al., 2007; Takahashi et al., 2009)、光适应(Marra, 1978a, 1978b; Geider et al., 1998; He & Liu, 2005; Navarro-Sampedro et al., 2008)和荧光(Lichtenthaler, 1992; Govindjee, 1995; Krause & Weis, 1991; Inoué et al., 2002; Sekatskii, 2004)等问题. ...
Phycocyanin sensitizes both photosystem I and photosystem II in cryptophyte Chroomonas CCMP270 cells
1
2008
... 类囊体膜是光合作用的原初光化学反应、电子传递和光合磷酸化的发生部位.现在, 人们虽然对类囊体膜的超微结构、化学组成和空间结构(Liu et al., 2004; Ishikita et al., 2005; Raszewski et al., 2005; Vasil’ev & Bruce, 2006; van der Weij-De Wit et al., 2008)已有所了解, 同时也比较清楚植物光合作用的发生过程(严国光, 1987; 徐春和和米华玲, 2001), 但是, 目前人们对植物光合作用对光响应机理的认识还不是十分清楚.多年来, 许多学者的研究结果证实, 光强和光质在植物光合作用对光响应中起重要的作用, 并且探明了捕光天线色素分子在光能的吸收和传递中担当的角色(Raszewski et al., 2005; van der Weij-De Wit et al., 2007).然而, 我们现在还无法从理论上预测捕光天线色素分子吸收的光能中有多少光能被用于退激发(热辐射和荧光)、多少光能用于共振传递到PSII, 从而引起PSII的电荷分离以及此后的电子传递, 尤其是光能吸收、传递和退激发与PSII捕光天线色素分子的哪些物理参数有关, 以及这些参数之间的关系如何. ...
Excitation energy transfer in native and unstacked thylakoid membranes studied by low temperature and ultrafast fluorescence spectroscopy
1
2007
... 类囊体膜是光合作用的原初光化学反应、电子传递和光合磷酸化的发生部位.现在, 人们虽然对类囊体膜的超微结构、化学组成和空间结构(Liu et al., 2004; Ishikita et al., 2005; Raszewski et al., 2005; Vasil’ev & Bruce, 2006; van der Weij-De Wit et al., 2008)已有所了解, 同时也比较清楚植物光合作用的发生过程(严国光, 1987; 徐春和和米华玲, 2001), 但是, 目前人们对植物光合作用对光响应机理的认识还不是十分清楚.多年来, 许多学者的研究结果证实, 光强和光质在植物光合作用对光响应中起重要的作用, 并且探明了捕光天线色素分子在光能的吸收和传递中担当的角色(Raszewski et al., 2005; van der Weij-De Wit et al., 2007).然而, 我们现在还无法从理论上预测捕光天线色素分子吸收的光能中有多少光能被用于退激发(热辐射和荧光)、多少光能用于共振传递到PSII, 从而引起PSII的电荷分离以及此后的电子传递, 尤其是光能吸收、传递和退激发与PSII捕光天线色素分子的哪些物理参数有关, 以及这些参数之间的关系如何. ...
A protein dynamics study of photosystem II: the effects of protein conformation on reaction center function
1
2006
... 类囊体膜是光合作用的原初光化学反应、电子传递和光合磷酸化的发生部位.现在, 人们虽然对类囊体膜的超微结构、化学组成和空间结构(Liu et al., 2004; Ishikita et al., 2005; Raszewski et al., 2005; Vasil’ev & Bruce, 2006; van der Weij-De Wit et al., 2008)已有所了解, 同时也比较清楚植物光合作用的发生过程(严国光, 1987; 徐春和和米华玲, 2001), 但是, 目前人们对植物光合作用对光响应机理的认识还不是十分清楚.多年来, 许多学者的研究结果证实, 光强和光质在植物光合作用对光响应中起重要的作用, 并且探明了捕光天线色素分子在光能的吸收和传递中担当的角色(Raszewski et al., 2005; van der Weij-De Wit et al., 2007).然而, 我们现在还无法从理论上预测捕光天线色素分子吸收的光能中有多少光能被用于退激发(热辐射和荧光)、多少光能用于共振传递到PSII, 从而引起PSII的电荷分离以及此后的电子传递, 尤其是光能吸收、传递和退激发与PSII捕光天线色素分子的哪些物理参数有关, 以及这些参数之间的关系如何. ...
... 类囊体膜是光合作用的原初光化学反应、电子传递和光合磷酸化的发生部位.现在, 人们虽然对类囊体膜的超微结构、化学组成和空间结构(Liu et al., 2004; Ishikita et al., 2005; Raszewski et al., 2005; Vasil’ev & Bruce, 2006; van der Weij-De Wit et al., 2008)已有所了解, 同时也比较清楚植物光合作用的发生过程(严国光, 1987; 徐春和和米华玲, 2001), 但是, 目前人们对植物光合作用对光响应机理的认识还不是十分清楚.多年来, 许多学者的研究结果证实, 光强和光质在植物光合作用对光响应中起重要的作用, 并且探明了捕光天线色素分子在光能的吸收和传递中担当的角色(Raszewski et al., 2005; van der Weij-De Wit et al., 2007).然而, 我们现在还无法从理论上预测捕光天线色素分子吸收的光能中有多少光能被用于退激发(热辐射和荧光)、多少光能用于共振传递到PSII, 从而引起PSII的电荷分离以及此后的电子传递, 尤其是光能吸收、传递和退激发与PSII捕光天线色素分子的哪些物理参数有关, 以及这些参数之间的关系如何. ...
Light energy absorption and transmission
1
1987
... 类囊体膜是光合作用的原初光化学反应、电子传递和光合磷酸化的发生部位.现在, 人们虽然对类囊体膜的超微结构、化学组成和空间结构(Liu et al., 2004; Ishikita et al., 2005; Raszewski et al., 2005; Vasil’ev & Bruce, 2006; van der Weij-De Wit et al., 2008)已有所了解, 同时也比较清楚植物光合作用的发生过程(严国光, 1987; 徐春和和米华玲, 2001), 但是, 目前人们对植物光合作用对光响应机理的认识还不是十分清楚.多年来, 许多学者的研究结果证实, 光强和光质在植物光合作用对光响应中起重要的作用, 并且探明了捕光天线色素分子在光能的吸收和传递中担当的角色(Raszewski et al., 2005; van der Weij-De Wit et al., 2007).然而, 我们现在还无法从理论上预测捕光天线色素分子吸收的光能中有多少光能被用于退激发(热辐射和荧光)、多少光能用于共振传递到PSII, 从而引起PSII的电荷分离以及此后的电子传递, 尤其是光能吸收、传递和退激发与PSII捕光天线色素分子的哪些物理参数有关, 以及这些参数之间的关系如何. ...
A new model for relationship between light intensity and the rate of photosynthesis in Oryza sativa
Primary application on a light-response model to describe light response curve of Bidens pilosa leaf net photosynthesis, grown at two different light intensities
7
2008
... 由于α和Pnmax均大于0, 由(2)式可知必有${{P}_{\text{n}}}^{'}>0$, 表明(1)式是一个没有极值的函数, 也即直角双曲线是一条没有极点的渐近线.因此, 我们无法由(1)式直接求出植物的Pnmax和饱和光强, 即无法用(1)式求解植物饱和光强的解析解.为了估算Pnmax, 就必须利用非线性最小二乘法.如果植物在饱和光强之后光合速率不下降, 则得到的Pnmax必远大于实测值(Kyei-Boahen et al., 2003; Yu et al., 2004; Leakey et al., 2006; 孙旭生等, 2009; 王照兰等, 2009), 且无法用此模型拟合光合速率随光强增加而下降这一段响应曲线(Ye & Zhao, 2008).此外, 直角双曲线模型也无法直接估算植物的饱和光强(Kyei-Boahen et al., 2003; Yu et al., 2004; Leakey et al., 2006).为了估算植物的饱和光强, 就需要用直线方程拟合弱光强条件下(≤200 μmol·m-2·s-1)的光响应数据得到表观量子效率(apparent quantum efficiency, AQE), 然后解直线方程: Pnmax = AQE $\times $ Isat - Rd可以得到饱和光强(Isat).然而用这种方法得到的饱和光强远小于实测值(叶子飘和于强, 2008; 张中峰等, 2009).也有学者假设0.7Pnmax所对应的光强为饱和光强(张雪松等, 2009). ...
... 与直角双曲线模型的讨论相似.如果植物在饱和光强之后光合速率不下降, 则用非直角双曲线模型估算的植物Pnmax必大于实测值(Springer & Thomas, 2007; Ye & Zhao, 2008; Ye & Yu, 2008; Lombardini et al., 2009; Posada et al., 2009), 且无法用它拟合光合速率随光强增加而下降这一段响应曲线(Ye & Zhao, 2008; 张中峰等, 2009).此外, 估算植物的饱和光强方法与直角双曲线模型的方法相同, 但用这种方法得到的饱和光强同样远小于实测值(曹雪丹等, 2008; 贾彩凤和李艾莲, 2008; 叶子飘和于强, 2008; 张中峰等, 2009). ...
... A, 4个光合作用对光响应模型拟合低光强条件下生长的三叶鬼针草的光响应曲线.○, 测量点; —, 修正模型的拟合点; ☆, 直角双曲线的拟合点; ┅ , 非直角双曲线的拟合点; ▽, 指数方程的拟合点.B, 4个光合作用对光响应模型估算饱和光强的方法.a, 由直线方程结合非直角双曲线得到的饱和光强; b, 由直线方程结合直角双曲线得到的饱和光强; c, 净光合速率为0.9Pnmax所对应光强为饱和光强; d, 由修正模型得到的饱和光强. Light-response curve of photosynthesis for <i>Bidens pilosa</i> grown under low light condition (Cited from <xref ref-type="bibr" rid="b67">Ye & Zhao, 2008</xref>).
A, Light-response curve of photosynthesis for Bidens pilosa fitted by four photosynthetic light response models. ○, measured points; —, points fitted by modified model; ☆, points fitted by rectangular hyperbola; ┅, points fitted by non-rectangular hyperbola; ▽, pointed fitted by exponential equation. B, Saturation irradiance estimated by four photosynthetic light response models. a, saturation irradiance obtained by a method combined non-rectangular hyperbola with line equation; b, saturation irradiance obtained by a method combined rectangular hyperbola with line equation; c, saturation irradiance, i.e. irradiance at 0.9Pnmax; d, saturation irradiance obtained by the modified model. ...
... 四个光响应模型拟合温度在27.3 ℃、CO2浓度在390 μmol·mol-1条件下三叶鬼针草的实测值(引自文献 Ye & Zhao, 2008)与拟合结果 ...
... Results fitted by four models of light-response curve of photosynthesis and measured values for Bidens pilosa grown under low light condition (Cited from Ye & Zhao, 2008) ...
Comparison of photosynthetic response to intercellular CO2 and air CO2
... A, 4个光合作用对光响应模型拟合华北平原冬小麦的光响应曲线.○, 测量点; —, 修正模型的拟合点; ☆, 直角双曲线的拟合点; ┅, 非直角双曲线的拟合点; ▽, 指数方程的拟合点.B, 4个光合作用对光响应模型估算饱和光强的方法.a, 由直线方程结合非直角双曲线得到的饱和光强; b, 由直线方程结合直角双曲线得到的饱和光强; c, 净光合速率为0.9Pnmax所对应光强为饱和光强; d, 由修正模型得到的饱和光强. Light-response curve of photosynthesis for <i>Triticum aestivum</i> (Cited from <xref ref-type="bibr" rid="b69">Yu <i>et al</i>., 2004</xref>).
A, Light-response curve of photosynthesis for T. aestivum fitted by four photosynthetic light response models. ○, measured points; —, points fitted by modified model; ☆, points fitted by rectangular hyperbola; ┅, points fitted by non-rectangular hyperbola; ▽, pointed fitted by exponential equation. B, Saturation irradiance estimated by four photosynthetic light response models. a, saturation irradiance obtained by a method combined non-rectangular hyperbola with line equation; b, saturation irradiance obtained by a method combined rectangular hyperbola with line equation; c, saturation irradiance, i.e. irradiance at 0.9Pnmax; d, saturation irradiance obtained by the modified model. ...
... 四个光响应模型拟合温度在20 ℃、CO2浓度在365 μmol·mol-1条件下冬小麦的实测值(引自文献Yu et al., 2004)与拟合结果 ...
... Results fitted by four models of light-response curve of photosynthesis and measured values for Triticum aestivum at 30 ℃ and 365 μmol·mol-1 CO2 concentration (Cited from Yu et al., 2004) ...
... A, 3个光合作用对CO2响应模型拟合华北平原冬小麦的光响应曲线.○, 测量点; —, 修正模型的拟合点; ┅, 直角双曲线或Michaelis-Menten模型的拟合点.B, 3个光合作用对CO2响应模型估算饱和CO2浓度的方法.a,净光合速率为0.6Pnmax的CO2浓度为饱和胞间CO2浓度; b, 由修正模型得到的饱和胞间CO2浓度. Intercellular CO<sub>2</sub> response of photosynthesis for <i>Triticum aestivum</i> (Cited from <xref ref-type="bibr" rid="b69">Yu <i>et al</i>., 2004</xref>)<i>. </i>
A, CO2 response curve of photosynthesis for T. aestivum fitted by three CO2 response models of phtosynthesis. ○, measured points; —, points fitted by a modified model; ┅, points fitted by rectangular hyperbola or Michaelis-Menten model. B, Saturation CO2 estimated by three CO2 response models of photosynthesis. a, saturation intercellular CO2 concentration, i.e. Ci at 0.6Pnmax; b, saturation intercellular CO2 concentration obtained by the modified model. ...
Comparison of two photosynthesis-light response curve—fitting models of the karst plant
3
2009
... 由于α和Pnmax均大于0, 由(2)式可知必有${{P}_{\text{n}}}^{'}>0$, 表明(1)式是一个没有极值的函数, 也即直角双曲线是一条没有极点的渐近线.因此, 我们无法由(1)式直接求出植物的Pnmax和饱和光强, 即无法用(1)式求解植物饱和光强的解析解.为了估算Pnmax, 就必须利用非线性最小二乘法.如果植物在饱和光强之后光合速率不下降, 则得到的Pnmax必远大于实测值(Kyei-Boahen et al., 2003; Yu et al., 2004; Leakey et al., 2006; 孙旭生等, 2009; 王照兰等, 2009), 且无法用此模型拟合光合速率随光强增加而下降这一段响应曲线(Ye & Zhao, 2008).此外, 直角双曲线模型也无法直接估算植物的饱和光强(Kyei-Boahen et al., 2003; Yu et al., 2004; Leakey et al., 2006).为了估算植物的饱和光强, 就需要用直线方程拟合弱光强条件下(≤200 μmol·m-2·s-1)的光响应数据得到表观量子效率(apparent quantum efficiency, AQE), 然后解直线方程: Pnmax = AQE $\times $ Isat - Rd可以得到饱和光强(Isat).然而用这种方法得到的饱和光强远小于实测值(叶子飘和于强, 2008; 张中峰等, 2009).也有学者假设0.7Pnmax所对应的光强为饱和光强(张雪松等, 2009). ...
... 与直角双曲线模型的讨论相似.如果植物在饱和光强之后光合速率不下降, 则用非直角双曲线模型估算的植物Pnmax必大于实测值(Springer & Thomas, 2007; Ye & Zhao, 2008; Ye & Yu, 2008; Lombardini et al., 2009; Posada et al., 2009), 且无法用它拟合光合速率随光强增加而下降这一段响应曲线(Ye & Zhao, 2008; 张中峰等, 2009).此外, 估算植物的饱和光强方法与直角双曲线模型的方法相同, 但用这种方法得到的饱和光强同样远小于实测值(曹雪丹等, 2008; 贾彩凤和李艾莲, 2008; 叶子飘和于强, 2008; 张中峰等, 2009). ...
... ; 张中峰等, 2009). ...
The vertical distribution of cotton leaf nitrogen content and photosynthetic characteristics in the North China Plain
1
2009
... 由于α和Pnmax均大于0, 由(2)式可知必有${{P}_{\text{n}}}^{'}>0$, 表明(1)式是一个没有极值的函数, 也即直角双曲线是一条没有极点的渐近线.因此, 我们无法由(1)式直接求出植物的Pnmax和饱和光强, 即无法用(1)式求解植物饱和光强的解析解.为了估算Pnmax, 就必须利用非线性最小二乘法.如果植物在饱和光强之后光合速率不下降, 则得到的Pnmax必远大于实测值(Kyei-Boahen et al., 2003; Yu et al., 2004; Leakey et al., 2006; 孙旭生等, 2009; 王照兰等, 2009), 且无法用此模型拟合光合速率随光强增加而下降这一段响应曲线(Ye & Zhao, 2008).此外, 直角双曲线模型也无法直接估算植物的饱和光强(Kyei-Boahen et al., 2003; Yu et al., 2004; Leakey et al., 2006).为了估算植物的饱和光强, 就需要用直线方程拟合弱光强条件下(≤200 μmol·m-2·s-1)的光响应数据得到表观量子效率(apparent quantum efficiency, AQE), 然后解直线方程: Pnmax = AQE $\times $ Isat - Rd可以得到饱和光强(Isat).然而用这种方法得到的饱和光强远小于实测值(叶子飘和于强, 2008; 张中峰等, 2009).也有学者假设0.7Pnmax所对应的光强为饱和光强(张雪松等, 2009). ...


